VOC Investigation Factors in the Rainforest
Article Information
Robert Müntz*
Reference Analytics GmbH, Thomas Alva Edisonstrasse 1, 7000 Eisenstadt, ATU67109318, Austria
*Corresponding author: Robert Müntz, Reference Analytics GmbH, Thomas Alva Edisonstrasse 1, 7000 Eisenstadt, ATU67109318, Austria.
Received: 22 January 2024; Accepted: 26 January 2024; Published: 19 February 2024
Citation: Robert Müntz. VOC Investigation Factors in the Rainforest. Journal of Biotechnology and Biomedicine. 7 (2024): 121-136.
Share at FacebookAbstract
So far, numerous VOC research studies have been undertaken on orchids to gain a deeper understanding of their propagation mechanisms. Analyses can be carried out in the laboratory under ideal conditions; external influences of the ambient atmosphere can thus be excluded. For extensive field studies on the orchid population of an area, samples must be taken directly at the specimen site. As a result, VOCs in the ambient air are considered a matrix when evaluating the results. VOCs in the ambient air must be considered when evaluating the results; a display of the VOCs in a matrix is usually used for this purpose. Plant components, in particular higher molecular weight plant waxes (C 28 - C 35), are degraded by microorganisms and UV radiation and are found in the forest air as VOCs (alkanes, aldehydes, and ketones). By developing a “scentor” (scent collector) with a closed system, both the sensitivity of the detection limit and the exclusion of the surrounding scents can be achieved. Most of the VOCs found are monoterpenes, followed by sesquiterpenes and to a lesser extent terpenoids, i.e., terpene structures with functional groups. The ubiquitous components of the air (alkanes, aldehydes, and ketones) occurring in outdoor measurements originate from the microbial degradation of higher molecular weight plant waxes (C 28 - C 35) and were taken into account in the evaluation.
Keywords
NIST; Orchid; Costa Rica; Guaitil; Terpene; Fragrance; ADAMS; VOC; SOA; OEP; AI
Article Details
Introduction
The motivation of the present study is the question of characterising plant fragrances in the context of a dissertation [1]. One requirement was to take the samples directly in the field to avoid influencing the fragrance composition by picking and bringing them to a laboratory. The main interest here is the hitherto unexamined question of the scent composition of miniature orchids, and subsequently the identification of relationships in the scent profile of the orchids of a restricted forest area in Costa Rica. The examination of flowers of a size of less than 5 mm is a great challenge in terms of equipment and is coupled with the difficulties of scent sampling in the rainforest. Thus, the sensitivity of the system had to be set very high to delineate the small amount of fragrance in the surrounding forest air matrix. The present work aims to measure volatile organic compounds (VOCs) at the lowest concentrations in the field while minimising the influences of the ambient atmosphere of a rainforest.
Location of the investigation
The Reserva Biologica Guaitil S.A. area of 200 ha in central Costa Rica is the site of the investigation of this study. The area is sparsely populated, there are no water resources of interest to the E-economy, it borders the Tapanti National Park and is situated at altitudes of 800 to 1800 m. About four-fifths of it consists of primary forest, the remaining area is former pastureland that was reforested a few years ago. The author of this paper planted 1800 new trees, which were financed and provided by the energy operator ICE. The area is very steep in parts, landslides occur repeatedly after heavy rainfall. For reforestation, seeds of large trees of the reserve are collected and released in these areas after germination.
Materials and Methodology
In the following sections, the preparatory steps up to the practical implementation of the investigations are outlined. This also includes preliminary tests to optimise the analyses.
Methodical approach
Equipment and materials
An extremely sensitive and at the same time simple way of terpene collection for sampling in the field was achieved with the carbon adsorbents MonoTrap® RGC18TD (article NO 105-74201) from GL-Sciences. For the subsequent analysis of the terpene mixtures, Thermofischer used a GCMS TRACE 1310 GC base module, a TRACE 1300 GC SSL injector, an AI 1310 GC autoinjector for liquid injection TriPlus 500 headspace and the NIST and Robert Adams database.
Methodology development-HS-GC-MS
The sampling as well as the low concentration of the expected fragrances posed a notable challenge in the method design, the MonoTraps® used were thermally desorbed.
Several options were previously evaluated:
For the collection of the VOCs, a first attempt was made using MonoTraps® for liquid extraction, but this method was ruled out because of the increased time and effort involved. Although the samples can be analysed more frequently with this procedure, the chemical desorption turned out to be unreliable in this case because solvents falsified the result.
After initial problems, the Headspace MonoTraps® RGC18TD could be successfully used for thermal desorption and the values showed clear peaks with low background noise. The manufacturer recommends it for polar and hydrophobic molecules with a low to medium boiling point, the functional group being octadecyl-graphite carbon.
The sample was transported to the laboratory in Austria in a vial and analysed directly. This also eliminates contamination or loss during transport and in the laboratory. After several tests, the result of a 10-minute desorption carried out at 170 °C was selected. In this case, a sufficient release is given, in which the substances were not stressed for an excessively long time and degradation could thus be counteracted.
Shelf life of the loaded MonoTraps®
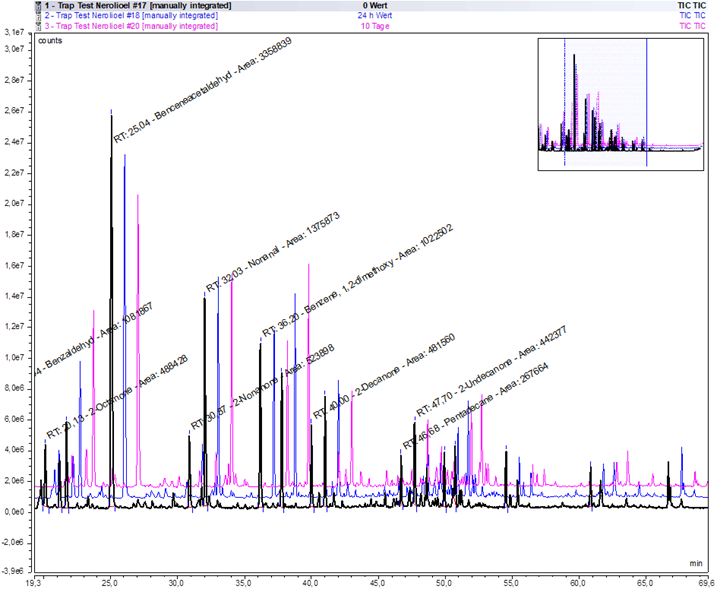
To test the shelf life of MonoTraps® loaded with VOCs, the scent of neroli oil was taken with 3 MonoTraps® for 2 hours. One sample was immediately analysed in the gas chromatograph/mass spectrometer (GC/MS), a second was stored for 48 hours at 5° C and subsequently analysed, and the third was analysed after 10 days at 5° C storage temperature. The results showed an almost one hundred per cent agreement of the spectra, only gradual differences were found in the 10-day-old version (Table 1, Figure1). This suggests different stabilities of the terpenes as well as different adsorption behaviour of the column towards the VOCs.
|
|
Retentions time |
Time 0 |
Time 24 hours |
Time 10 days |
||||
|
[min] |
Area [count*min] |
% |
% |
|||||
|
Difference 24h |
Difference 10 days |
|||||||
|
2-Hexanone |
5.5 |
268167 |
223632 |
18.1 |
151662 |
55.5 |
||
|
Hexanal |
6.01 |
173629 |
158268 |
9.3 |
125027 |
32.5 |
||
|
Benzaldehyde |
16.94 |
1081867 |
1117994 |
-3.3 |
1369008 |
-23.4 |
||
|
2-Octanone |
20.13 |
488428 |
399945 |
19.9 |
264444 |
59.5 |
||
|
Phenylethane |
25.04 |
3358839 |
2887012 |
15.1 |
2470974 |
30.5 |
||
|
2-Nonanone |
30.87 |
523898 |
391542 |
28.9 |
258462 |
67.9 |
||
|
Nonanal |
32.03 |
1375873 |
1424210 |
-3.5 |
1393646 |
-1.3 |
||
|
1,2-Dimethoxybenzene |
36.2 |
1022502 |
1037197 |
-1.4 |
921492 |
10.4 |
||
|
2-Decanon |
40 |
481560 |
356720 |
29.8 |
383805 |
22.6 |
||
|
Pentadecane |
46.68 |
267664 |
318350 |
-17.3 |
254620 |
5.0 |
||
Table 1: Shelf life of loaded MonoTraps®.
Duration of scent removal
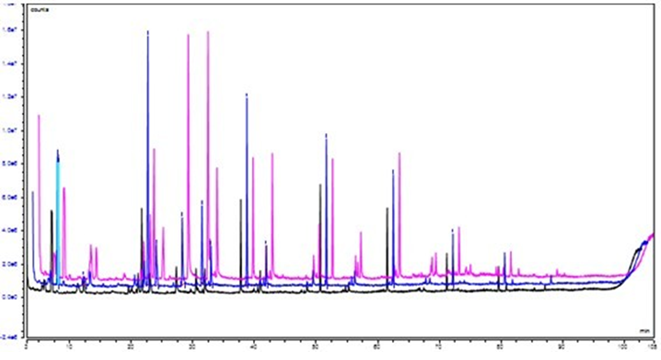
The time span of terpene uptake required optimisation: On the one hand, it is essential for the spectrum recording to obtain strong peaks, i.e., to extend the testing in time. On the other hand, this is difficult to realise in the rainforest during long marches and it is a hindrance to progress to extend the measurement for an unnecessarily long time. Decreasing for too long would also increase the background noise due to the influence of the ambient air of the forest. An attempt was therefore made to determine the optimal duration. The terpenoid mixture of a weakly scented orchid was measured with 3 MonoTraps® over different periods of time: over 15 minutes, over 30 minutes and finally over 60 minutes. After the mentioned time, one adsorption body each was taken from the sampler for the measurement (Figure 2).
Considering the above circumstances, a sampling time of 20 minutes was set after evaluating the measurements. The peaks of the GC were easy to evaluate, they stood out from the noise, and also the duration of the walk for the sampling during the field testing was reasonable.
Vapour pressure and relative concentrations
In addition, there was another aspect to consider: The fragrances of plants consist of a complex mixture of hydrocarbons that have different vapour pressures. If a sample is now taken in the headspace sampler, it contains many portions of low-boiling components. The substances with higher vapour pressure are less numerous. For the evaluation of this work, this means that absolute quantification is not possible and that highly volatile substances are potentially overrepresented [2].
Evaluation of the GC-MS chromatograms
The chromatograms were integrated manually. Wherever possible, the peaks were integrated "valley to valley" to obtain the clearest possible separation of the substances and thus spectra that are as pure as possible.
The Chromeleon software assigns a few possible substances to each peak. However, since the concentrations of the substances are very low, the automatic assignment is only correct in the rarest of cases:
The software assigns possible fragments to the background noise and thus generates false hits, although certain functional groups or structures are always correctly recognised.
If the peak is large enough and the hit accuracy is high enough (Hit Quality >800), it can be assumed that this substance has been correctly detected. In the case of lower hit qualities, the automatic evaluation must in any case be verified with another identification method.
It turned out during the project that a measurement range of the mass/charge ratio between 50 m/z and 250 m/z is sufficient. Initially, a measuring range value of 40 m/z to 250 m/z was chosen, as it was assumed that the fragments between 40 and 50 were relevant for the eval- uation (e.g., C3H7 fragments at m/z 43).
What had not been taken into account was that due to the large amount of throughput, an excessive amount of CO2 is applied to the column. This causes a continuous background noise of 44 m/z. If this area is omitted, clearer spectra are obtained, which simplify manual evalua tion.
Manual evaluation:
Based on the publication by R. Adams [3] a retention time index was assigned to each substance. For this purpose, an alkane standard was measured in advance. The calculation was made according to the formula below, the Arithmetic Index (AI) is calculated as follows:

Equation 1
A large part of the publication by Adams consists of a database of many fragrances (well over 1000), with the substances listed according to the definition of AI above. The AI of the peak from the recorded chromatogram was then compared with the database. The substances in the database with a similar AI are screened and the MS spectra are compared. If the MS spectra are comparable and the AI is sufficiently close to the values in the database (this may vary slightly, since the same column type as in the paper is used, but both the column dimension and the temperature gradient differ), a substance is assigned to the peak. This can vary slightly, because although the same type of column is used as in the publication by Robert Adams, both the column dimension and the temperature gradient differ. This always results in certain substances that potentially could not be assigned without the Adams AI data (structural isomers or similar substances). Many of the small peaks did not yield evaluable results because their spectra are not sufficiently resolved. Although the typical hydrocarbon fragments are recognisable, an evaluation was not possible because characteristic fragments are missing.
Documentation and Permissions
The present study of fragrances considers only VOCs of the ambient air of Reserva Biologica Guaitil SA, therefore no dry preparations of plants were made and archived. The author's research activity in Costa Rica was approved by CONAGEBio - Ministerio de Ambiente y Energia (MINAE) in 2015. Reserva Biologica Guaitil SA was state registered and approved as a reserve on 14.3.2014.
Collection of the scent samples
For the study, a new sampling method for field sampling had to be developed. The ambient air enriched with plant degradation products additionally influenced the experimental procedure. In the chromatograms, an abundance of alkanes and their homologous ketones and al-dehydes were found as intermediate products of leaf wax metabolism. All samples were taken in the reserve of Reserva Biologica Guaitil SA, the times of day were variable, air and temperature conditions as well. The practical implementation of the scent sampling was not easy, samples had to be taken close to the ground as well as those several metres above. Often the scent collection sites were difficult to access, so in one case a ladder had to be procured and in another a tree had to be climbed.
Development of the Scentors
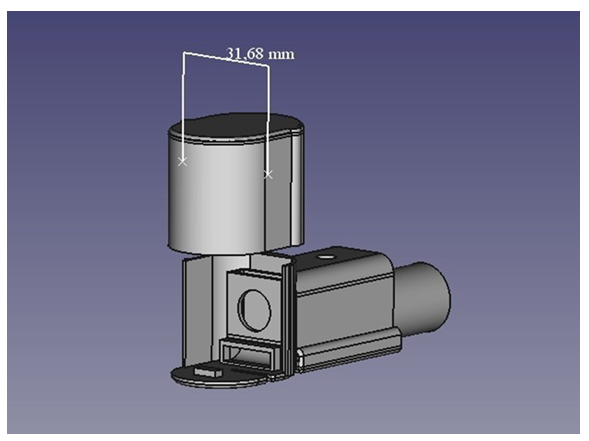
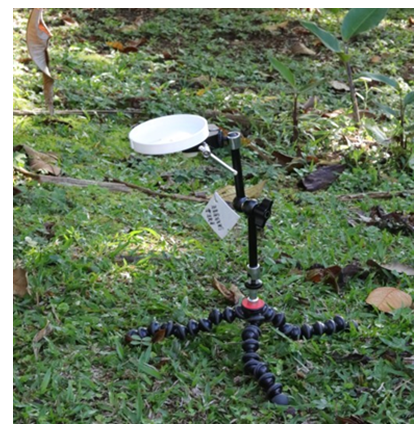
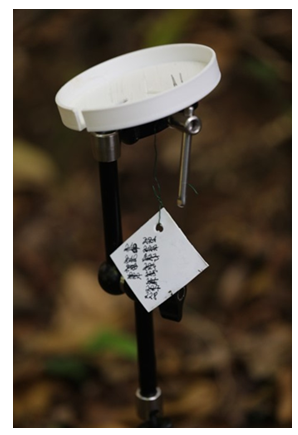
For the above-mentioned reasons, the decision was made in favour of scent collection using MonoTraps®, as these are easy to transport and the transfer to the Reference Analytics GmbH (Doppelreiter, 2023) laboratory in Austria was unproblematic. The shelf-life test went well so transport over 10 days seemed acceptable. In the next development phase, the author decided to build his own scent or use 3D printing. Poly Lactic Acid (PLA) was used to avoid odour contamination by evaporating plasticisers. Dynamic scent collection using the flow-through principle was used to achieve the maximum input. However, this also continuously measured the ambient air, which caused a strong alkane load on the chromatograms. In addition, this process led to a continuous dilution of the terpene concentration in the Mono- Trap®, so that the fragrance loading was lost to a certain extent. The reason for this was the fact that the scent production or release from the osmophores of the orchid flowers was less than the infiltration of carrier air. The results of this method were only usable for intensely scented large specimens, miniature orchids did not give usable results. The next step was to set up scentors of different sizes that followed a recirculation process. This avoided the problems mentioned above and made the results of the scent analyses usable. The new scentors swirled the air around the flower in the closed device, thus reducing the influence of the ambient air or the alkanes to a minimum. Furthermore, an undesired dilution of the terpene concentration on the Mono-Trap® could be prevented. The optimised duration of 20 minutes led to an enrichment of the terpenes released by the flower during this time. In addition, 3 scentors of different sizes were made to be able to optimally adjust to the size of the flowers to be examined. The volume of the unit must be in proportion to the size of the bloom. Especially the volume must not be too small, as squeezing the flower in will cause injury and thus alter the fragrance. However, it should also not be too large, otherwise the peak area in the chromatogram will be too small (Figure3).
Multiple measurements
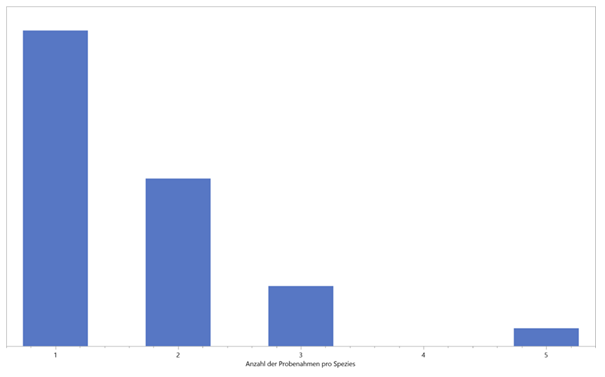
Initially, only individual sampling was carried out per species. In the course of the evaluation, however, it became apparent that multiple scent samples are useful for an assessment. Thus, during a new visit to the area, further data on already-known species were collected and evaluated (Figure 4).
As this graph shows, just under half of all measurements in this study were performed twice and three times. However, this also shows that by far not all orchids have been recorded on Guaitil and numerous species have been encountered for the first time. To date, more than 200 different species have been found in the area studied - this is roughly equivalent to the number of species known in the whole of Europe. The results showed both different VOC distribution patterns and significantly different numbers of identifiable substances within a species. This indicates a complex process of fragrance release from the time of blossoming until flowering.
Interpretation of the GC chromatograms
The evaluation of the GC data from the field trials is complex and shows the interplay of many influences. The components for this can essentially be divided into 3 groups:
Fragrances of the orchids
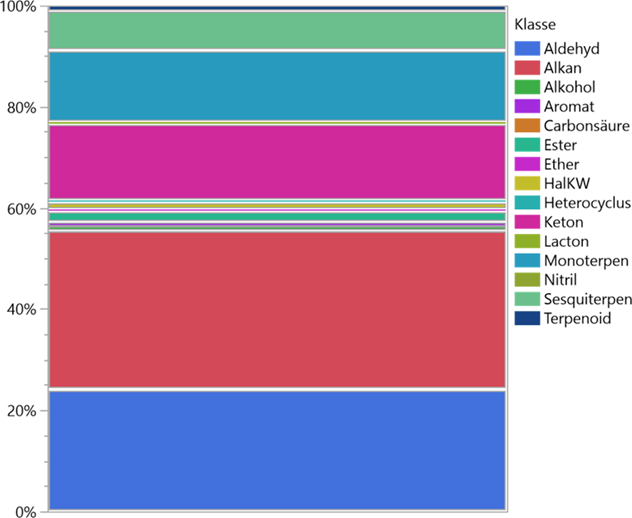
Depending on the phase of anthesis of the orchid examined, the range was from a practically scentless flower to an extremely intense mixture of scents. This refers to the group of terpenes as well as to all other fragrances. It should be noted that the scent intensity - especially with miniature orchids - was usually significantly below the respective concentration of odours from the ambient air. These meas urements only provided evaluable results through the closed recirculation system of the Scentor principle mentioned at the beginning. The chart in Figure 5 shows the ratios of VOCs (terpenes, esters, ethers, alcohols). The heavy weight of the fragrance components is recognisable in the terpenes, especially with the C 10- molecules, followed by the C 15-molecules. The largest proportion of the substances measured in terms of quantity consists of plant degradation products of the forest environment. Alkanes dominate, followed by aldehydes and ketones.
Environmental influences
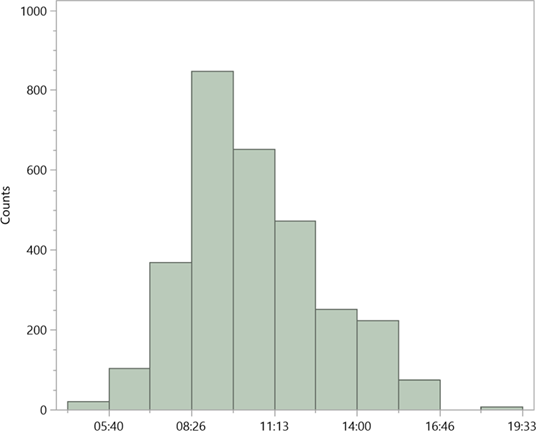
The task was to characterise orchid scents on site, which included the matrix of ambient air. The VOCs of the Guaitil area were determined in several blank tests and considered in the evaluation of the results. Part of the task of characterising orchid scents on site is the matrix of ambient air. All samples of orchid flowers were taken in the Guaitil reserve, the times of day were variable (Figure 6), as were air and temperature conditions.
The altitude of 1200 m above sea level in the main study area usually did not allow tempera tures above 22° degrees Celsius, they were usually well below that.
Aromatics
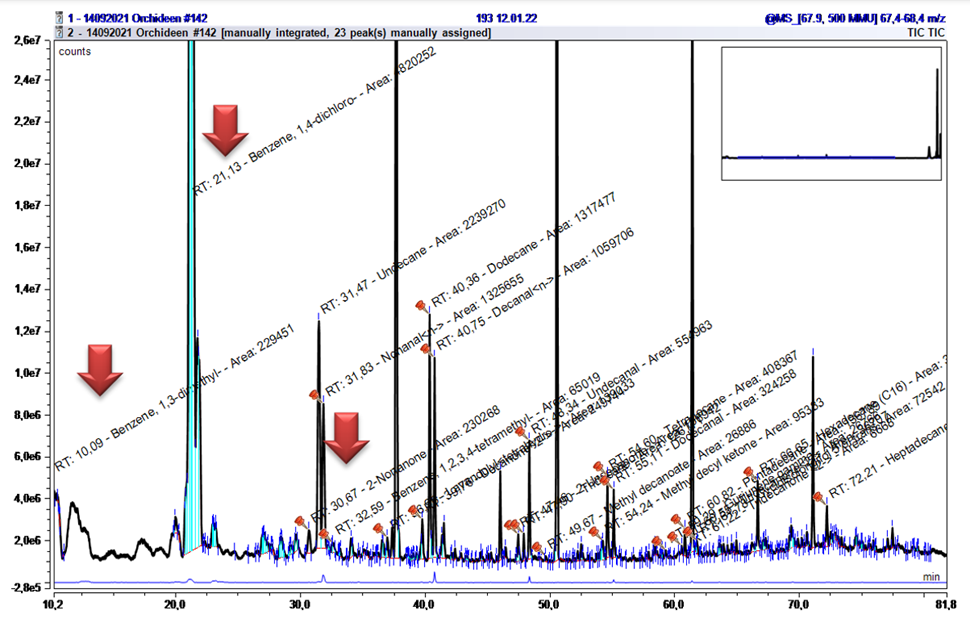
The group of halogenated aromatics showed irregularities in the chromatogram, with many peak areas appearing. These are environmental pollutants and can be found ubiquitously. They are highly toxic to microorganisms living in the water, but also have liver, kidney, and lung-damaging effect on humans. Especially 1,4-Dichlorobenzene is still used in toilet stones, mothballs, pesticides or even in coffin hygiene (Table 2). They are difficult to degrade and thus accumulate in the at- mosphere [4]. In the present chromatograms, they can be identified as broad peaks in the range AI 1000 – 1011 (Figure 7). Furthermore, non-halogenated Benzene derivatives were found in the same AI range.
|
1,2-Dichlorobenzene |
|
1,3-Dichlorobenzene |
|
1,4-Dichlorobenzene |
|
1,2,3,4-Tetramethylbenzene |
|
1,2,3,5-Tetramethylbenzene |
|
1,2,3-Tetramethylbenzene |
|
1,2,4,5-Tetramethylbenzene |
|
1,2-Dimethoxybenzene |
|
1,3-Dimethylbenzene |
|
1,4-Dimethoxybenzene |
|
1-Ethyl-3-methylbenzene |
|
1-Methylethylbenzene |
Table 2: halogenated and nonhalogenated aromatics in ambient air.
They are also ubiquitous as solvents, intermediates in PET bottle production and as dichlorobenzene, as well as a component of paints and lacquers and the like.
Odd over Even Predominance
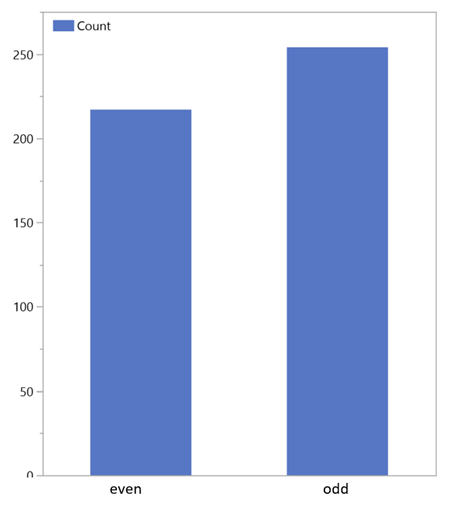
The main source of higher n-alkanes in sediments and soil are waxed from leaves and roots with a length of 25 C to 35 C atoms. These help to regulate the water balance of the plants and have different quantity distribution depending on climatic conditions: The higher or colder the location, the more long chain n-alkanes protect the surface. Their formation takes place via the citric acid cycle. Straight-chain carbon fatty acids are decarboxylated and reduced via ketones, aldehydes, and alcohols reduced to n-alkanes. Mostly, it is microorganisms and earthworms that are responsible for the degradation; odd-numbere dhydrocarbons are produced in the process through decarboxylation. The OEP (Odd over Even Predominance) is a measure of the phytogenic activity of the area and indicates the ratio between even and odd molecules (Figure 7) in the soil and in the ambient air of the area in which the observed plants grow [5].
In addition, there are other indices for characterising alkane distribution patterns, so CPI (Car bon Preference Index) serve as a characterisation of the even-to-odd ratios of n-alkanes, such as CPI (Carbon Preference Index) and ACL (Average Chain Length), which serve as measures of CH chain length. The CPI and OEP values are also an expression of the n-alkane genesis from plant waxes and represent a bioindicator in palaeoclimatology, among other things. Low values indicate that other sources of fragrance are present, such as microbes, but also for forced decomposition of organic material. Investigations of decomposition processes in the soil over several months to years have shown that the CPI and OEP values as a measure of the presence of n-alkanes are reduced by the influence of microorganisms [6].
The ratio of n-alkane leaf waxes of C3 plants depends on the corresponding organs: An investigation on 18 different plants indicated that the alkane concentration of the leaf waxes of the leaves was significantly higher than that of the flowers [7]. The presence of low-chain ketones and aldehydes in the atmosphere is not limited to rainforest areas but is also found in temperate and cool areas. The concentrations of a 24-hour measurement in southern Finland were 1340 ng/m³ Acetone, 480 ng/m³ Formaldehyde and 360 ng/m³ Acetaldehyde. The amounts of monoterpenes were comparatively low at 5ng/m³ Lim- onene ketone [8].
Secondary Organic Aerosols (SOA) are largely produced by the oxidation of Biogenic Volatile Organic Compounds (BVOC), terpenes and sesquiterpenes. These SOAs are an essential com ponent of the atmosphere and are responsible for climate and weather patterns and air qual ity. This takes place through the formation of solid aggregates which, as condensation nuclei, influence the formation of clouds and precipitation. The decomposition takes place, among other things, through the influence of UV radiation and ozone, and the values are dependent on a circadian rhythm and the regional movements of the air masses. Due to the heterogeneity of the terpene structures, their lifespan varies greatly, with sesquit- erpenes undergoing more rapid degradation to SOAs than the C 10 molecules of the monoterpene group [9].
n-alkanes
Already during the first evaluations of the chromatograms, it had to be determined that a multitude of n-alkane signals were present - and this often with an intensity and across almost all samplings. Since they were detectable in almost all samples, the explanation that they orig inate from the ambient air is obvious. This is also plausible because they are the last stage in the degradation of plant material by microorganisms and earthworms.
This raised a question:
- In the publications on orchid scent analysis, increased short-chain n-alkane presence could not be The question, therefore, arises whether there is a specific rea son for this or whether these were not present at all. One explanation could be that the investigations in the laboratory were carried out without the ambient VOCs of the forest air.
- Another explanation for this circumstance could be that due to the high sensitivity of the present method, substances from the ambient air were detected that could not be measured
Blank samples
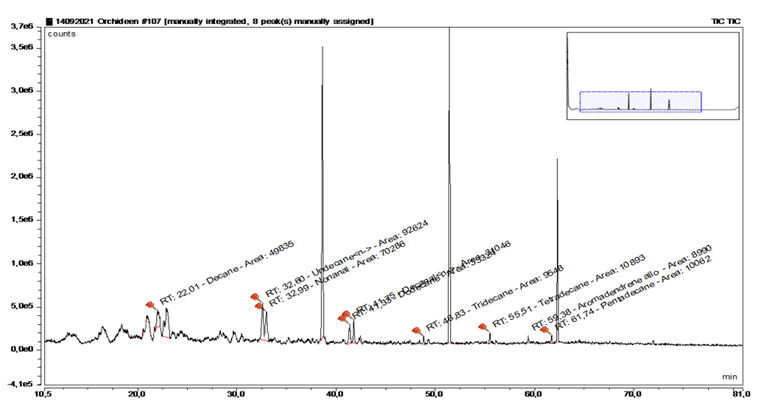
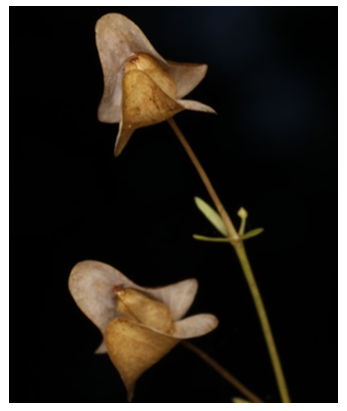
A sampling of faded Lentibularia served as a temporary blank for the determination of alkane contamination and resulted in the following peak distribution (Figure 9+10, Table 3). The three large peaks originate from evaporation of the septum because of the high temperature during the discharge of the MonoTraps®.
|
Substance |
RT |
rel. Area |
AI |
% |
|
Decane |
22.009 |
2.47 |
1000 |
16.2 |
|
n-Undecane |
32.6 |
4.6 |
1100 |
30.1 |
|
n-Nonanal |
32.988 |
3.49 |
1100 |
22.8 |
|
Dodecane |
41.334 |
1.65 |
1200 |
10.8 |
|
n-Decanal |
41.752 |
1.54 |
1201 |
10.1 |
|
Tridecane |
48.826 |
0.47 |
1300 |
3.1 |
|
Tetradecane |
55.513 |
0.54 |
1400 |
3.5 |
|
Pentadecane |
61.737 |
0.5 |
1500 |
3.3 |
Table 3
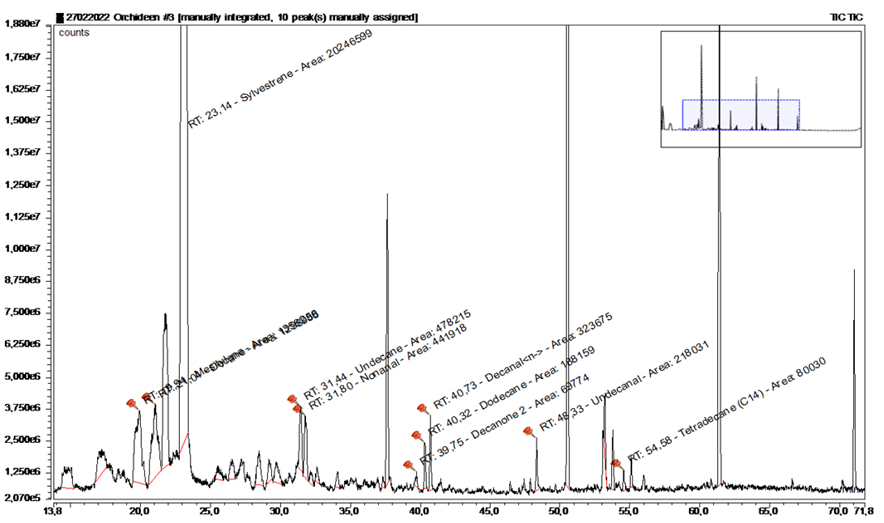
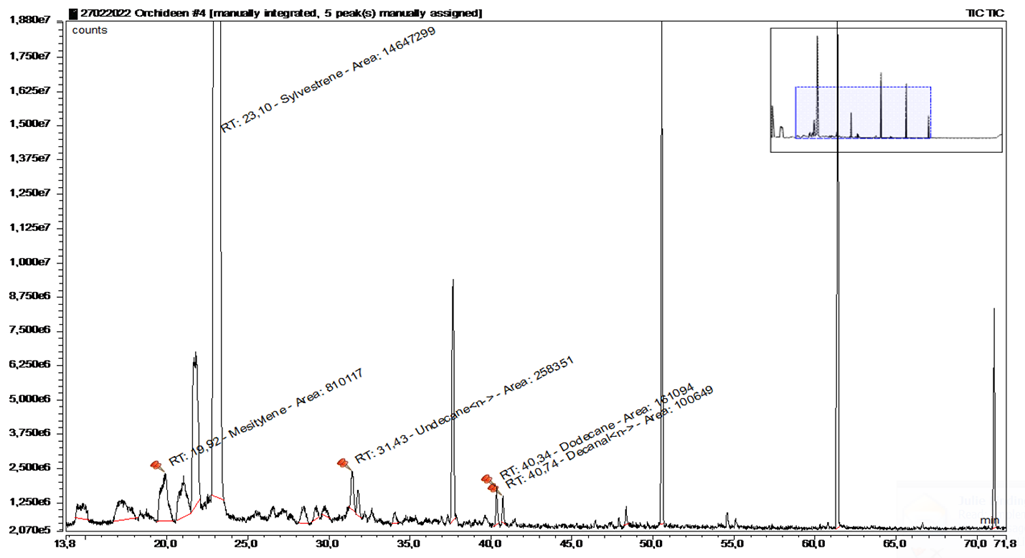
Another blank sample grassland was taken from a smaller meadow in the immediate vicinity of the collection site (Figure 11+12, Table 4).
|
Substance |
RT |
rel. area |
AI |
% |
|
Mesitylene |
19.945 |
3.68 |
994 |
5.5 |
|
Decane |
21.036 |
3.52 |
1100 |
5.3 |
|
Sylvestrene |
23.145 |
54.82 |
1025 |
82 |
|
Undecane |
31.443 |
1.29 |
1100 |
1.9 |
|
Nonanal |
31.797 |
1.2 |
1100 |
1.8 |
|
2-Decanon |
39.745 |
0.19 |
1190 |
0.3 |
|
Dodecane |
40.324 |
0.51 |
1200 |
0.8 |
|
n-Decanal |
40.728 |
0.88 |
1201 |
1.3 |
|
Undecanal |
48.33 |
0.59 |
1305 |
0.9 |
|
Tetradecan |
54.581 |
0.22 |
1400 |
0.3 |
Table 4
In addition, a blank sample was taken in the forest near the base station about 30 cm above the ground (Figure 13+14, Table 5).
|
Substance |
RT |
rel. area |
AI |
% |
|
Sylvestrene |
23.097 |
57.23 |
1025 |
96.6 |
|
n-Undecane |
31.43 |
1.01 |
1100 |
1.7 |
|
Dodecane |
40.341 |
0.63 |
1200 |
1.1 |
|
n-Decanal |
40.735 |
0.39 |
1201 |
0.7 |
Table 5
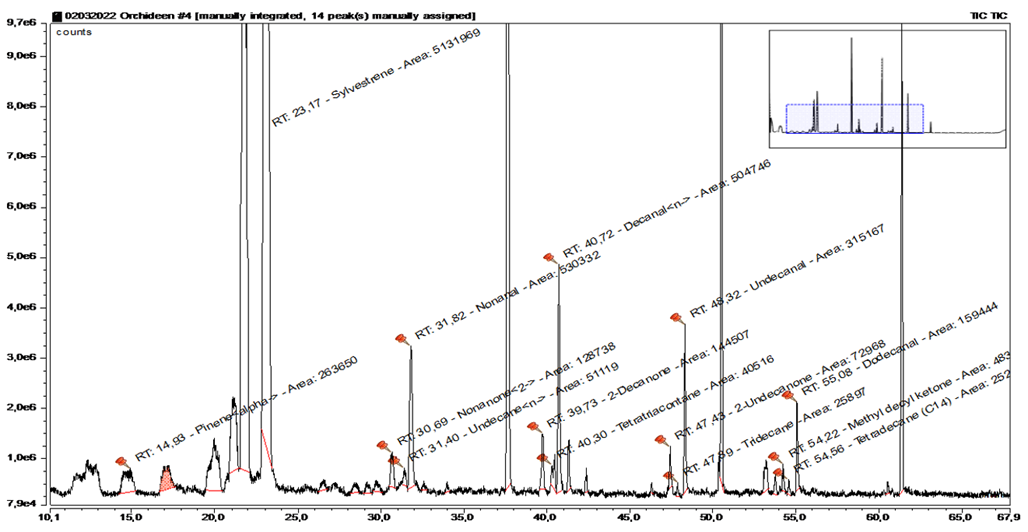
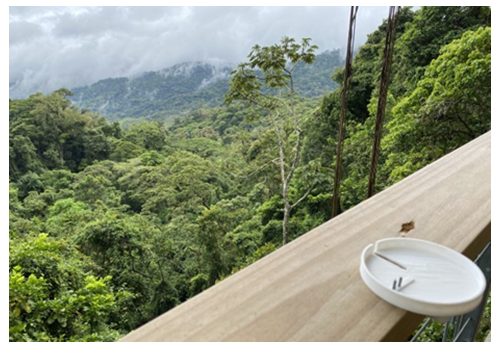
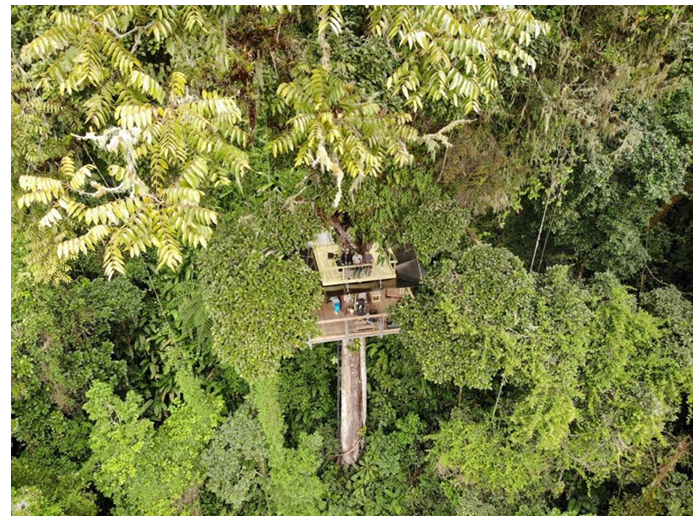
The fourth blank sample took place in a treehouse, about 30 minutes’ walk from the base station, at a height of 35 meters (Figure 15+16, Table 6).
|
Substance |
RT |
rel. area |
AI |
% |
|
alpha-Pinene |
14.935 |
1.29 |
932 |
3.6 |
|
Sylvestrene |
23.165 |
25.12 |
1025 |
69.2 |
|
2-Nonanone |
30.688 |
0.63 |
1087 |
1.7 |
|
n-Undecane |
31.396 |
0.25 |
1100 |
0.7 |
|
Nonanal |
31.821 |
2.6 |
1100 |
7.2 |
|
2-Decanon |
39.732 |
0.71 |
1196 |
1.9 |
|
Dodecane |
40.303 |
0.2 |
1200 |
0.5 |
|
n-Decanal |
40.725 |
2.47 |
1201 |
6.8 |
|
2-Undecanone |
47.428 |
0.36 |
1293 |
1 |
|
Undecanal |
48.319 |
1.54 |
1305 |
4.2 |
|
2-Methyl ethyl ketone |
54.217 |
0.24 |
1388 |
0.7 |
|
Tetradecane |
54.564 |
0.12 |
1400 |
0.3 |
|
Dodecanal |
55.077 |
0.78 |
1408 |
2.1 |
Table 6
What is striking about the samples taken at the tree house are the many alkane derivatives - these exceeded those of the samples near the ground (Table 6). This is an indication that the concentration of environmental VOCs is elevated in the tree canopy.
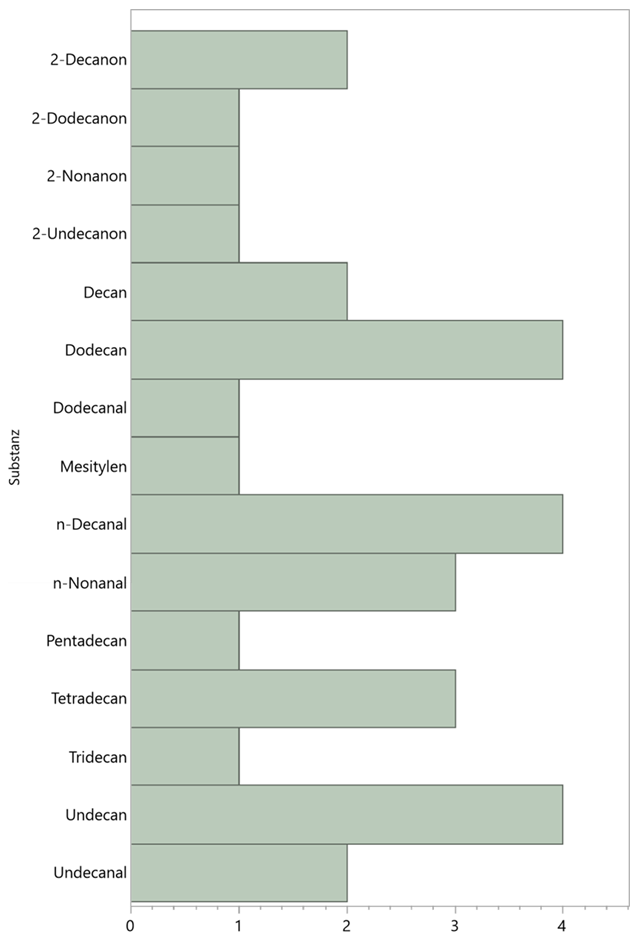
The frequencies (counts) of all identified alkanes of the blank samples (i.e. without the influence of floral scent) is shown in the following diagram Figure 13:
Triassic ketone-alkane-aldehyde
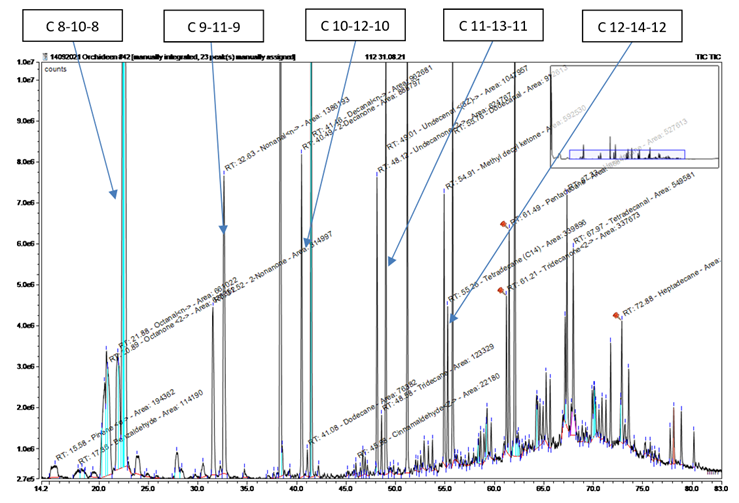
Typical for GC chromatograms of free-air investigations are signal groups with a constant pattern in the atmosphere (Table 7+8, Chromatogram 6). These are groups of three ketone-alkane-aldehyde, which have similarities among themselves in terms of their number of C atoms.
|
|
C 8-10-8 |
C 9-11-9 |
C 10-12-10 |
C 11-13-11 |
C 12-14-12 |
|
Ketone |
Octanone |
Nonanone |
Decanone |
2-Undecanone |
2-Methyldecyl ketone |
|
Alkane |
Decane |
Undecane |
Dodecane |
Tridecane |
Tetradecane |
|
Aldehyde |
Octanal |
Nonanal |
Decanal |
Undecanal |
Dodecanal |
Table 7: Triassic
|
Substance |
RT |
rel. area |
AI |
% |
|
2-Octanone |
20.89 |
1.18 |
988 |
5.5 |
|
n-Octanal |
21.877 |
1.22 |
998 |
5.69 |
|
2-Nonanone |
31.522 |
1.5 |
1087 |
7.02 |
|
n-Nonanal |
32.634 |
2.55 |
1100 |
11.94 |
|
2-Decanon |
40.487 |
1.64 |
1190 |
7.65 |
|
Dodecane |
41.076 |
0.14 |
1200 |
0.66 |
|
n-Decanal |
41.457 |
1.77 |
1201 |
8.29 |
|
2-Undecanone |
48.116 |
1.15 |
1293 |
5.38 |
|
Tridecane |
48.578 |
0.23 |
1300 |
1.06 |
|
Undecanal |
49.007 |
1.93 |
1305 |
9.02 |
|
2-Methyl ethyl ketone |
54.908 |
1.09 |
1388 |
5.1 |
|
Tetradecane |
55.262 |
0.63 |
1400 |
2.93 |
|
Dodecanal |
55.758 |
1.68 |
1408 |
7.86 |
|
2-Tridecanone |
61.207 |
0.62 |
1495 |
2.91 |
|
Pentadecane |
61.486 |
0.94 |
1500 |
4.38 |
|
Hexadecane |
67.332 |
0.97 |
1600 |
4.54 |
|
Tetradecanal |
67.968 |
1.01 |
1611 |
4.73 |
|
Heptadecane |
72.879 |
0.58 |
1700 |
2.7 |
Table 8: Triassic with Comparettia falcata
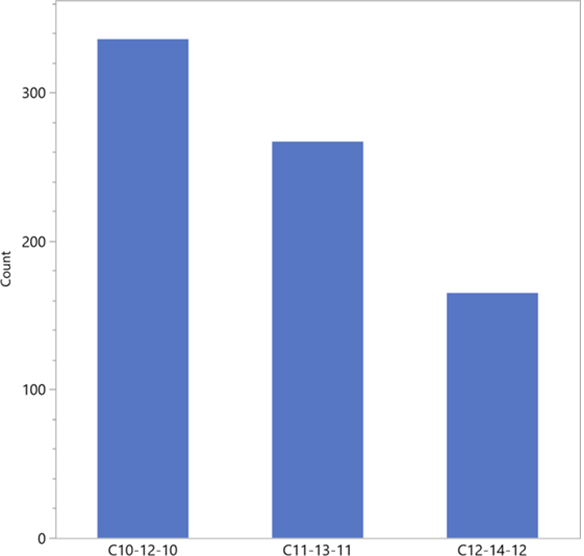
After evaluation of all samples, the C atom number of the ambient air of Reserva Biologica Guaitil SA resulted in a distribution between ketone, alkane and aldehyde = Cx - C(x+2) - Cx, as shown in Figure14:
Terpenes from the ambient air
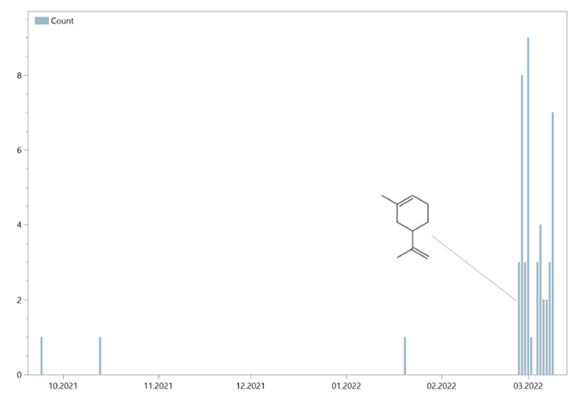
In the samples of the orchid flowers as well as the blank samples, besides the n-alkanes and their derivatives often also terpenes. This depends on the time of year. These were mostly Mesitylene, alpha Pinene and Sylvestrene. The latter also occurred in very high concentrations in relation to the scents of the flowers. This is environmental impact in field sampling that must be considered in the results. This cannot be avoided when flowers are subjected to scent analyses in statu, a closed scentor device is essential here.
The seasonal variation in the example of Sylvestren is shown in Figure 20:
Methodological influences
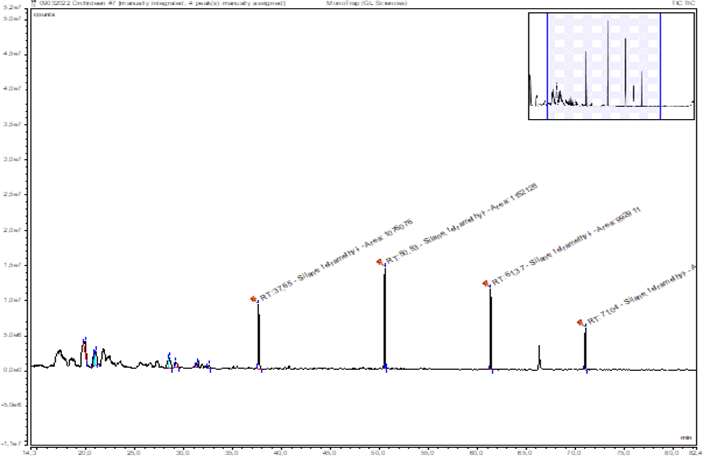
When first working out the optimal parameters of the GC analysis, it became apparent that the maximum detection depth is achieved, among other things, by increasing the temperature gradient up to 280° C. The chromatogram therefore shows peaks that can be attributed to the septum of the headspace vials and bleeding of the column.Therefore, peaks are found in the chromatogram 7 that are due to the septum of the head- space vials, the seals and the bleeding of the column. In the mass spectrum, they have the value 73 m/z and 147 m/z and can be assigned to Dimethylpolysiloxane and Polysiloxane de- rivatives, respectively (Figure 21).
As a consequence of the above-mentioned factors influencing the characterisation of scents in field trials, the environmental and methodological factors were excluded from the evaluations.
Competing interests
The author declares no competing interests.
Datasets
The datasets used and/or analysed during the current study available from the author on reasonable request.
References
- Müntz, Robert. Charakterisierung der Orchideendüfte im Gebiet von Reservea Biologica Guaitil, S.A., Costa Rica. Marburg/Lahn: Phillips Universität Marburg (2023): 715.
- Gerlach, Günter. Fragrances and their Composition in Euglossine-Pollinated Neotropical Orchids. Menzinger Str. 61, 80638 München, Germany: Botanical Garden Munich (2019): 1- 16.
- Robert, Adams. Identification of Essential Oil Components by Gas Chromatography/Mass Spectrometry. Baylor University 2017.
- Lumitos AG. Chemie Lexikon. (2022)
- Tung-Yi Huang, Bing-ei-Chun Chao, Cheng-Wei Fan. Plant n-alkane production from litterfall altered the diversity and community structure of alkane degrading bacteria in letter layer in lowland subtropical rainforest in Taiwan. Biogeosciences (2018): 1815-2018.
- Carrie L Thoma, Jansen, Boris und van Loon. Transformation of n-alkanes from plant to soil: a review. Bd 7 (2021): 785-809.
- Wu Ji, Hunga Wan. Shorter average chain length of n-alkanes from flowers than leaves of modern plants: Implications for the use of n-alkane-derived proxies in soils. Geochemical journal. Research gate 5 (2021): e19-e23.
- Hellen, et al. Carbonyl compounds in boreal coniferous forest air in Hyytiala. 4 (2004): 1771-1780.
- Luis M. Barreira, Arttu Ylisirniö, Iida Pullinen, et al. The importance of sesquiterpene oxidation products for secondary organic aerosol formation in a springtime hemiboreal forest 21 (2021): 11781-11800.

