Transcriptome Dedifferentiation Observed in Animal Primary Cultures is Essential to Plant Reprogramming
Article Information
Norichika Ogata*
Nihon BioData Corporation, Kawasaki, Japan
*Corresponding author: Norichika Ogata, Nihon BioData Corporation, Kawasaki, Japan.
Received: 20 September 2022; Accepted: 30 September 2022; Published: 07 October 2022
Citation:
Norichika Ogata. Transcriptome Dedifferentiation Observed in Animal Primary Cultures is Essential to Plant Reprogramming. Journal of Bioinformatics and Systems Biology 5 (2022): 116-118.
Share at FacebookAbstract
Tissue culture environment liberate cells from ordinary laws of multicellular organisms. This liberation enables cells several behaviors, such as growth, dedifferentiation, acquisition of pluripotency, immortalization and reprogramming. Each phenomenon is relating to each other and hardly to determine. Recently, dedifferentiation of animal cell was quantified as increasing liberality which is information entropy of transcriptome. The increasing liberality induced by tissue culture may reappear in plant cells too. Here we corroborated it. Measuring liberality during reprogramming of plant cells suggested that reprogramming is a combined phenomenon of dedifferentiation and re-differentiation.
Keywords
Dedifferentiation; Information Entropy; Liberality; Primary Culture; Transcriptome; Reprogramming
Dedifferentiation articles; Information Entropy articles; Liberality articles; Primary Culture articles; Transcriptome articles; Reprogramming articles
Dedifferentiation articles Dedifferentiation Research articles Dedifferentiation review articles Dedifferentiation PubMed articles Dedifferentiation PubMed Central articles Dedifferentiation 2023 articles Dedifferentiation 2024 articles Dedifferentiation Scopus articles Dedifferentiation impact factor journals Dedifferentiation Scopus journals Dedifferentiation PubMed journals Dedifferentiation medical journals Dedifferentiation free journals Dedifferentiation best journals Dedifferentiation top journals Dedifferentiation free medical journals Dedifferentiation famous journals Dedifferentiation Google Scholar indexed journals Information Entropy articles Information Entropy Research articles Information Entropy review articles Information Entropy PubMed articles Information Entropy PubMed Central articles Information Entropy 2023 articles Information Entropy 2024 articles Information Entropy Scopus articles Information Entropy impact factor journals Information Entropy Scopus journals Information Entropy PubMed journals Information Entropy medical journals Information Entropy free journals Information Entropy best journals Information Entropy top journals Information Entropy free medical journals Information Entropy famous journals Information Entropy Google Scholar indexed journals Liberality articles Liberality Research articles Liberality review articles Liberality PubMed articles Liberality PubMed Central articles Liberality 2023 articles Liberality 2024 articles Liberality Scopus articles Liberality impact factor journals Liberality Scopus journals Liberality PubMed journals Liberality medical journals Liberality free journals Liberality best journals Liberality top journals Liberality free medical journals Liberality famous journals Liberality Google Scholar indexed journals Primary Culture articles Primary Culture Research articles Primary Culture review articles Primary Culture PubMed articles Primary Culture PubMed Central articles Primary Culture 2023 articles Primary Culture 2024 articles Primary Culture Scopus articles Primary Culture impact factor journals Primary Culture Scopus journals Primary Culture PubMed journals Primary Culture medical journals Primary Culture free journals Primary Culture best journals Primary Culture top journals Primary Culture free medical journals Primary Culture famous journals Primary Culture Google Scholar indexed journals Transcriptome articles Transcriptome Research articles Transcriptome review articles Transcriptome PubMed articles Transcriptome PubMed Central articles Transcriptome 2023 articles Transcriptome 2024 articles Transcriptome Scopus articles Transcriptome impact factor journals Transcriptome Scopus journals Transcriptome PubMed journals Transcriptome medical journals Transcriptome free journals Transcriptome best journals Transcriptome top journals Transcriptome free medical journals Transcriptome famous journals Transcriptome Google Scholar indexed journals Reprogramming articles Reprogramming Research articles Reprogramming review articles Reprogramming PubMed articles Reprogramming PubMed Central articles Reprogramming 2023 articles Reprogramming 2024 articles Reprogramming Scopus articles Reprogramming impact factor journals Reprogramming Scopus journals Reprogramming PubMed journals Reprogramming medical journals Reprogramming free journals Reprogramming best journals Reprogramming top journals Reprogramming free medical journals Reprogramming famous journals Reprogramming Google Scholar indexed journals Tissue culture articles Tissue culture Research articles Tissue culture review articles Tissue culture PubMed articles Tissue culture PubMed Central articles Tissue culture 2023 articles Tissue culture 2024 articles Tissue culture Scopus articles Tissue culture impact factor journals Tissue culture Scopus journals Tissue culture PubMed journals Tissue culture medical journals Tissue culture free journals Tissue culture best journals Tissue culture top journals Tissue culture free medical journals Tissue culture famous journals Tissue culture Google Scholar indexed journals RNA sampling articles RNA sampling Research articles RNA sampling review articles RNA sampling PubMed articles RNA sampling PubMed Central articles RNA sampling 2023 articles RNA sampling 2024 articles RNA sampling Scopus articles RNA sampling impact factor journals RNA sampling Scopus journals RNA sampling PubMed journals RNA sampling medical journals RNA sampling free journals RNA sampling best journals RNA sampling top journals RNA sampling free medical journals RNA sampling famous journals RNA sampling Google Scholar indexed journals BCDAT articles BCDAT Research articles BCDAT review articles BCDAT PubMed articles BCDAT PubMed Central articles BCDAT 2023 articles BCDAT 2024 articles BCDAT Scopus articles BCDAT impact factor journals BCDAT Scopus journals BCDAT PubMed journals BCDAT medical journals BCDAT free journals BCDAT best journals BCDAT top journals BCDAT free medical journals BCDAT famous journals BCDAT Google Scholar indexed journals
Article Details
1. Introduction
Tissue culture is performed to maintain isolated portions of multicellular organisms in an artificial milieu that is outside the individual organism and for considerable periods of time [1]. It is known over a century that cells derived from cultured explants are, in general, different from cells of the corresponding tissue in a living organism [2,3]. In these tissue cultures, cells are liberated from stimulations and prohibition which is ordinary in multi-cellular organisms [4]. This liberation is essential for growth, dedifferentiation, acquisition of pluripotency, immortalization and reprogramming. However, each phenomena related to each other and some of them had not been scientifically justified, such as dedifferentiation, reprogramming and immortalization. For example, it is not unclear that whether the immortalized cell line has individual cellular immortality or population immortality with gene pool sharing. In other case, historically, proliferations of cultured cells were considered to a result of dedifferentiation [2]. To concrete discussion, concrete definition of each phenomenon which happens in liberated tissue cultures. Recently, the cellular dedifferentiation was quantitive defined as increasing of information entropy of transcriptome [5]. A dedifferentiation of animal cells in primary explant culture was corroborated previously [5]. Then we hypothesized that dedifferentiation of cells in primary explant culture is a common phenomenon for diverse multi-cellular organisms. Here we corroborated whether plant cell dedifferentiated in primary explant culture too or not using a shared transcriptome data set [6].
2. Materials and Methods
Transcriptome data set was obtained from DDBJ SRA (DRA000400) [6]. In this entry, time course total RNA sampling during reprogramming of leaf cells of the Moss Physcomitrella patens (0, 1, 3, 6, 12 and 24 hours). Each sample has there biological replicates. We mapped transcriptome sequence data using bowtie 1.1.2 [7] since they used SOLiD sequencer. Information entropy was calculated from all count data as previously described [5]. We compared culture time and information entropy of transcriptome data.
3. Results and Discussion
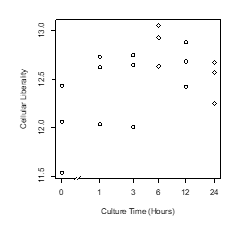
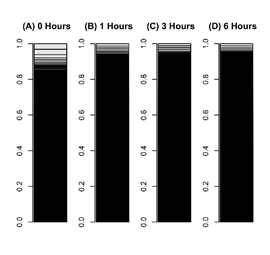
The plant cells dedifferentiated in primary explant culture, equal to animal cells; the information entropy of transcriptome data increased during culture (Figure 1, Figure 2). This result suggested that dedifferentiation of cells in primary explant culture is a common phenomenon for diverse multi-cellular organisms. However, in the case of plants, the information entropy decreases after the information entropy increases up to about 6 hours. This is thought to be re-differentiation to construct new plants and reprogramming can be explained as an integration of dedifferentiation and regeneration. Callus may be regarded as dedifferentiated cells which holding down the re-differentiation process; using callus and plant tissue culture, bi-/multi-stability of transcriptome [8, 9] could be demonstrated in plant. If their re-differentiation process is caused by the determination of intercellular division of labor based on cell-to-cell communication [10], it will be possible to examine them in a test that separates cultured cells. Cellular dedifferentiation and differentiation have been understood as the direction of cellular morphology and phenotype change [2,11]. In this decade, several studies [12-15] following our research [5] repeatedly measured the degree of cellular dedifferentiation and differentiation as a transcriptome Shannon entropy. The Shannon entropy is a kind of alpha diversity in ecology [16], and the transcriptome Shannon entropy is simply transcriptome diversity [5, 17]. It is not incorrect to call it the alpha diversity of the transcriptome, but that would leave its biological significance undefined, as would each principal component that came up in the principal component analysis. Since we can quantitatively assess, judge, and define that dedifferentiation is an increase in the Shannon entropy of the transcriptome and differentiation is a decrease in the Shannon entropy of the transcriptome, it is more accurate to position the “value of information entropy of the transcriptome” not as a mere bioinformatics measure; however, as a number with obvious biological and bioengineering significance, such as viable cell rate, cell density, specific growth rate, or pcd (pg/cell/day). Here we call the quantitative value of cellular dedifferentiation and differentiation “liberality,” since a previous study explained the changes were happening to cultured cells as “libère” [18].

Figure 1: Scatter plot of culture time vs cellular liberality.
The moss leaf cells were cultured in BCDAT medium. Liberalities, the information entropy of transcriptome were measured in each culture time.

Figure 2: Bar charts of leaf cells transcriptome during reprogramming.
The occupation rate of genes in a transcriptome was plotted in a bar chart. Heights of boxes in a bar chart indicate the occupation rate of genes in a transcriptome. Although more than 50,000 transcripts are included in these bar charts, most are invisible and are included in black regions. (A) A transcriptome of leaf cells cultured for 0 hours in BCDAT medium. (B) A transcriptomes of leaf cells cultured for 1 hour in BCDAT medium. (C) A transcriptomes of leaf cells cultured for 3 hours in BCDAT medium. (D) A transcriptomes of leaf cells cultured for 6 hours in BCDAT medium.
References
- Margaret Ransone Murray GK. A Bibliography of the Research in Tissue Culture, 1884-1950. New York: Academic Press (1953): 1741.
- Champy C. Quelques résultats de la méthode de culture de tissus. I. Généralités. II. Le muscle lisse. . Archives de zoologie expérimentale et générale 53 (1913-1914): 42-51.
- Carleton HM. Tissue culture: A critical summary. Journal of Experimental Biology 1 (1923): 131-151.
- Canguilhem G. La connaissance de la vie. Paris: Librairie Philosophique J Vrin (1965).
- Ogata N, Yokoyama T, Iwabuchi K. Transcriptome responses of insect fat body cells to tissue culture environment. PLoS One 7 (2012): e34940.
- Nishiyama T, Miyawaki K, Ohshima M, et al. Digital gene expression profiling by 5'-end sequencing of cDNAs during reprogramming in the moss Physcomitrella patens. PLoS One 7 (2012): e36471.
- Langmead B, Trapnell C, Pop M, et al. Ultrafast and memory-efficient alignment of short DNA sequences to the human genome. Genome Biol 10 (2009): R25.
- Ferrell JE, Jr. Bistability, bifurcations, and Waddington's epigenetic landscape. Curr Biol 22 (2012): R458-466.
- Ogata N, Kozaki T, Yokoyama T, et al. Comparison between the Amount of Environmental Change and the Amount of Transcriptome Change. PLoS One 10 (2015): e0144822.
- de la Cova C, Abril M, Bellosta P, et al. Drosophila myc regulates organ size by inducing cell competition. Cell 117 (2004):107-116.
- Carleton HM, Tissue culture: A critical summary. J. Exp. Biol 1 (1923): 131-151.
- Guo M, Bao EL, Wagner M, et al. SLICE: determining cell differentiation and lineage based on single cell entropy. Nucleic Acids Res 45 (2017): e54.
- Teschendorff AE, Enver T. Single-cell entropy for accurate estimation of differentiation potency from a cell’s transcriptome, Nat Commun 8 (2017): 15599.
- Wiesner K, Teles J, Hartnor M, et al. Haematopoietic stem cells: entropic landscapes of differentiation. Interface Focus 6 (2018): 20180040.
- Kannan S, Farid M, Lin BL, et al. Transcriptomic entropy benchmarks stem cell-derived cardiomyocyte maturation against endogenous tissue at single cell level. PloS Comput Biol 17 (2021): e1009305.
- Dongmei A, Ruocheng H, Jin W, et al. Integrated metagenomic data analysis demonstrates that a loss of diversity in oral microbiota is associated with periodontitis. BMC Genomics 18 (2017): 1041.
- Martinez O, Reyes-Valdes MH. Defining diversity specialization and gene specificity in transcriptomes through information theory, Proc. Natl. Acad. Sci. U.S.A 105 (2008): 9709-9714.
- Canguilhem G. La connaissance de la vie, Pari: Hachette (1952): 41.
