The Impact of the Trendelenburg Maneuver on Right Ventricular Pressure- Volume Relationship
Article Information
Tjorvi E Perry1*, Andrew Shaffer2, Gurumurthy Hiremath3
1Department of Anesthesiology University of Minnesota 420 Delaware St SE, MMC 294 Minneapolis, MN 55455, USA
2Department of Cardiovascular Surgery University of Minnesota 420 Delaware St SE, MMC 207 Minneapolis, MN 55455, USA
3Department of Pediatric Cardiology University of Minnesota Academic Office Building 2450 Riverside Ave S AO-401 Minneapolis, MN 55455, USA
*Corresponding author: Tjorvi E Perry, Department of Anesthesiology University of Minnesota 420 Delaware St SE, MMC 294 Minneapolis, MN 55455, USA.
Received: 25 January 2023; Accepted: 03 Febraury 2023; Published: 15 Febraury 2023
Citation: Tjorvi E Perry, Andrew Shaffer, Gurumurthy Hiremath. The Impact of the Trendelenburg Maneuver on Right Ventricular Pressure-Volume Relationship. Cardiology and Cardiovascular Medicine 7 (2023): 50-51.
Share at FacebookAbstract
Intraoperative hypotension defined as a mean arterial pressure less than 65mmHg is associated with postoperative myocardial infraction, acute kidney injury and mortality [1]. When hypotension is due to inadequate venous return and fluid-responsiveness is suspected [2], increasing preload should improve hemodynamics.
Keywords
right ventricular PV loops; preload; LVAD
Article Details
1. Introduction
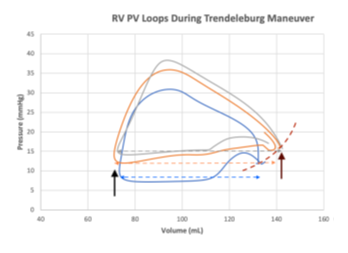
Herein, we present three right ventricular (RV) pressure-volume (PV) loops (CD Lycom, Inc) acquired in a 63 year-old patient after undergoing LVAD placement [3] with normal RV function. The Blue loop representing the patient in ~20° reverse Trendelenburg (decreased effective preload and likely fluid responsive), the Orange loop representing a level position, and the Grey loop representing ~20° Trendelenburg. As the patient’s position changes and preload to the heart gradually increases, RV end-diastolic volume and pressure (Brown arrow) increase along the end-diastolic pressure-volume relations (EDPVR) curve (dotted Brown line). Because RV end-systolic volume remains relatively unchanged (Black arrow), RV stroke volume (end systolic volume minus end diastolic volume; dotted Blue, Orange, Grey lines, respectively) increases. Furthermore, we documented an incremental increase in RV inotrope (dp/dt) from 177 mmHg/s to 185 mmHg/s to 222 mmHg/s as venous return increases. In a patient who is fluid-responsive, administering a fluid bolus should lead to improved hemodynamics. Alternatively, and as predicted by the Frank-Starling Law, administering a fluid bolus to a patient who is not fluid-responsiveness can result in acute RV volume overload, distention and failure. As we demonstrate with these RV PV loops, altering preload by changing the position of the operating room table is a temporary and easily reversable alternative to fluid administration when assessing fluid-responsiveness in a hypotensive patient.
Competing Interests
None
References
- Salmasi V, Maheshwari K, Yang D, et al. Relationship between Intraoperative Hypotension, Defined by Either Reduction from Baseline or Absolute Thresholds, and Acute Kidney and Myocardial Injury after Noncardiac Surgery: A Retrospective Cohort Analysis. Anesthesiology 126 (2017): 47-65.
- Miller TE, Myles PS. Perioperative Fluid Therapy for Major Surgery. Anesthesiology 130 (2019): 825-832.
- Perry T. Hemodynamic Assessment of the Right Ventricle Using Pressure-volume Loop Catheter and Pulmonary Artery Catheter in Patients Undergoing Left Ventricular Assist Device Placement.

