Supervised learning of Plasmodium falciparum life cycle stages using single-cell transcriptomes identifies crucial proteins
Article Information
Swarnim Shukla, Soham Choudhuri, Gayathri Priya Iragavarapu, and Bhaswar Ghosh*
International Institute of Information Technology, Gachibowli, Hyderabad, 500 032 Telangana, INDIA
*Corresponding author: Bhaswar Ghosh, International Institute of Information Technology, Gachibowli, Hyderabad, 500 032 Telangana, INDIA.
Received: 29 November 2022; Accepted: 6 December 2022; Published: 27 February 2023
Citation: Swarnim Shukla, Soham Choudhuri, Gayathri Priya Iragavarapu, and Bhaswar Ghosh. Supervised learning of Plasmodium falciparum life cycle stages using single-cell transcriptomes identifies crucial proteins. Journal of Bioinformatics and Systems Biology. 6 (2023): 31-46.
Share at FacebookAbstract
Vital gene expressions form the basis for the detection of malaria infection levels. Quantification of infected erythrocytes and classification of their life cycle stages are done at a macroscopic level by experts, for making informed decisions for diagnosis and treatment of malaria. Of late multiple computational approaches have been proposed to circumvent the problem of dimensionality leading to accurately predicted results. In this work, a dimensionality reduction technique based on Genetic Algorithm (GA) is applied to Plasmodium falciparum single cell transcriptomics to arrive at an optimized subset of features from the larger dataset. Features are chosen based on their class variants considering increased efficiency and accuracy, to separately transform the selected elements into a lower dimension. For the classification of the life cycle of malaria parasites based on single cell transcriptome data, a three-pronged approach employing the multiclass Support Vector Machine (SVM), Logistic Regression (LR), and Random Forest (RF) technique is used. Further, we constructed protein interaction networks of the genes identified by the feature selection method and gene ontology analysis elucidated the role of the proteins in the progression of the parasite through its life cycle. Our approach presents a novel protocol to implement ML techniques on scRNA seq datasets and subsequently harness the extracted information for biomarker/drug target detection.
Keywords
Plasmodium falciparum, Malaria, Support Vector Machine (SVM).
Plasmodium falciparum articles; Malaria articles; Support Vector Machine (SVM) articles.
Plasmodium falciparum articles Plasmodium falciparum Research articles Plasmodium falciparum review articles Plasmodium falciparum PubMed articles Plasmodium falciparum PubMed Central articles Plasmodium falciparum 2023 articles Plasmodium falciparum 2024 articles Plasmodium falciparum Scopus articles Plasmodium falciparum impact factor journals Plasmodium falciparum Scopus journals Plasmodium falciparum PubMed journals Plasmodium falciparum medical journals Plasmodium falciparum free journals Plasmodium falciparum best journals Plasmodium falciparum top journals Plasmodium falciparum free medical journals Plasmodium falciparum famous journals Plasmodium falciparum Google Scholar indexed journals Malaria articles Malaria Research articles Malaria review articles Malaria PubMed articles Malaria PubMed Central articles Malaria 2023 articles Malaria 2024 articles Malaria Scopus articles Malaria impact factor journals Malaria Scopus journals Malaria PubMed journals Malaria medical journals Malaria free journals Malaria best journals Malaria top journals Malaria free medical journals Malaria famous journals Malaria Google Scholar indexed journals Support Vector Machine (SVM) articles Support Vector Machine (SVM) Research articles Support Vector Machine (SVM) review articles Support Vector Machine (SVM) PubMed articles Support Vector Machine (SVM) PubMed Central articles Support Vector Machine (SVM) 2023 articles Support Vector Machine (SVM) 2024 articles Support Vector Machine (SVM) Scopus articles Support Vector Machine (SVM) impact factor journals Support Vector Machine (SVM) Scopus journals Support Vector Machine (SVM) PubMed journals Support Vector Machine (SVM) medical journals Support Vector Machine (SVM) free journals Support Vector Machine (SVM) best journals Support Vector Machine (SVM) top journals Support Vector Machine (SVM) free medical journals Support Vector Machine (SVM) famous journals Support Vector Machine (SVM) Google Scholar indexed journals scRNA seq articles scRNA seq Research articles scRNA seq review articles scRNA seq PubMed articles scRNA seq PubMed Central articles scRNA seq 2023 articles scRNA seq 2024 articles scRNA seq Scopus articles scRNA seq impact factor journals scRNA seq Scopus journals scRNA seq PubMed journals scRNA seq medical journals scRNA seq free journals scRNA seq best journals scRNA seq top journals scRNA seq free medical journals scRNA seq famous journals scRNA seq Google Scholar indexed journals erythrocyte articles erythrocyte Research articles erythrocyte review articles erythrocyte PubMed articles erythrocyte PubMed Central articles erythrocyte 2023 articles erythrocyte 2024 articles erythrocyte Scopus articles erythrocyte impact factor journals erythrocyte Scopus journals erythrocyte PubMed journals erythrocyte medical journals erythrocyte free journals erythrocyte best journals erythrocyte top journals erythrocyte free medical journals erythrocyte famous journals erythrocyte Google Scholar indexed journals Transcriptomics articles Transcriptomics Research articles Transcriptomics review articles Transcriptomics PubMed articles Transcriptomics PubMed Central articles Transcriptomics 2023 articles Transcriptomics 2024 articles Transcriptomics Scopus articles Transcriptomics impact factor journals Transcriptomics Scopus journals Transcriptomics PubMed journals Transcriptomics medical journals Transcriptomics free journals Transcriptomics best journals Transcriptomics top journals Transcriptomics free medical journals Transcriptomics famous journals Transcriptomics Google Scholar indexed journals Genetic Algorithm articles Genetic Algorithm Research articles Genetic Algorithm review articles Genetic Algorithm PubMed articles Genetic Algorithm PubMed Central articles Genetic Algorithm 2023 articles Genetic Algorithm 2024 articles Genetic Algorithm Scopus articles Genetic Algorithm impact factor journals Genetic Algorithm Scopus journals Genetic Algorithm PubMed journals Genetic Algorithm medical journals Genetic Algorithm free journals Genetic Algorithm best journals Genetic Algorithm top journals Genetic Algorithm free medical journals Genetic Algorithm famous journals Genetic Algorithm Google Scholar indexed journals UMAP projection articles UMAP projection Research articles UMAP projection review articles UMAP projection PubMed articles UMAP projection PubMed Central articles UMAP projection 2023 articles UMAP projection 2024 articles UMAP projection Scopus articles UMAP projection impact factor journals UMAP projection Scopus journals UMAP projection PubMed journals UMAP projection medical journals UMAP projection free journals UMAP projection best journals UMAP projection top journals UMAP projection free medical journals UMAP projection famous journals UMAP projection Google Scholar indexed journals GA articles GA Research articles GA review articles GA PubMed articles GA PubMed Central articles GA 2023 articles GA 2024 articles GA Scopus articles GA impact factor journals GA Scopus journals GA PubMed journals GA medical journals GA free journals GA best journals GA top journals GA free medical journals GA famous journals GA Google Scholar indexed journals
Article Details
1. Introduction
Malaria is a deadly disease caused by the Plasmodium parasite and is transmitted through the bite of a female Anopheles mosquito. This Plasmodium falciparum attacks the red blood cells (RBCs) and the degree of malaria can be estimated by the quantity of infected RBCs [1]. The complex life cycle of malaria parasites features diverse developmental strategies, each of which is uniquely adapted to thrive in the particular host environment. Six Plasmodium species cause human malaria, with the majority of the estimated 0.4 million annual deaths caused by Plasmodium falciparum (P.falciparum). Blood stage development begins when a newly released, extracellular parasite (a merozoite) invades an erythrocyte, establishing the ring stage of infection, and progressing to the trophozoite stage. During this stage, the infected erythrocyte is extensively modified to enable parasite proliferation. After that the parasite divides to form a connected group of daughter cells, called schizont, which eventually lyses the host erythrocyte, releasing the newly formed merozoites to invade new erythrocytes. These steps are collectively known as the intraerythrocytic developmental cycle (IDC) [2]. Malaria symptoms include high fever and headache and in some severe cases, even seizures and death are caused. Malaria mostly affects the economically weak communities of the world, where medical treatment is not readily available. For the quick and successful recovery of any patient, it is vital to diagnose and treat the malarial infection early. If the malaria life cycle stages are somehow ascertained then the treatment of the disease becomes easier. Experienced medical professionals frequently examine a large number of blood films to detect malaria infection. Microscopists normally visualize the thick and thin blood smears to identify a disease or its cause. However, the accuracy depends upon smear quality and expertise in classifying and counting the parasite and non-parasite cells. It is fairly challenging to number the parasites and infected RBCs manually and needs an expert microscopist for quality diagnosis [3]. Recent advances in single cell RNA-sequencing (sc-RNA) techniques paved new ways to characterize gene expression changes during the development stages of the plasmodium life cycle [4,5]. Analysis of the gene expression regulation may allow us to identify new diagnostic markers as well as a potential targets for a new drug. Indeed, many studies have already been conducted in the last few years using sc-RNA experiments for Plasmodium falciparum. One of the central advantages of employing sc-RNA methods is the scope of exploring cell-to-cell heterogeneity in the population by uncovering hidden variability in gene expression among single cells [5-7]. Recent studies have elucidated the role of heterogeneity in enabling a small fraction of the Plasmodium population inside the human host to remain ready to enter into the mosquito host by making the transitions to the gametogenesis stage [8]. Similarly, heterogeneity plays a crucial role in Plasmodium stress response inside the RBC [9]. However, the diagnostics of scRNA-Seq is challenging as its outcome suffers from a lack of fit due to high dimensional gene expression data. Advanced computational skills are needed to study and process the massive volume of proteomic and genomic data obtainable freely from several repositories [10-11] and harness them to reveal new biological insights.
The dataset contains redundant characteristics that behave as noise during model training. As a result, classification performance is degraded and computing time is increased. Dimensionality Reduction (DR) techniques are required to eliminate redundancy and to retrieve irrelevant details that hinder performance. There are two methods for reducing the dimensionality of data: Feature Extraction and Feature Selection. Feature selection is further divided into the filter, wrapper, and embedded methods [12]. In the filter method, mathematical measures are used to select the optimal features. The wrapper is a feedback method that uses a machine learning algorithm to help choose the best features. The embedded approach is hybrid of the filter and wrapper methods. This paper proposes a wrapper-based feature selection technique using the Genetic Algorithm to select the optimal features and remove the redundant noise in the dataset. To evaluate the performance of these features, SVM, LR, and RF classification models are used.
The main objective of our study is to select top-ranked genes from the scRNA-seq profiles at different stages of the plasmodium falciparum life cycle inside infected RBC, using supervised learning coupled with feature selection. The first stage of the proposed model is to optimize the quality of data from the dataset by removing the redundant, noisy, and irrelevant genes (features). From the literature review (see Discussion) it can be concluded that the genetic algorithm (GA) showed a better performance than the other selection algorithms and thus can be prominently used for feature selection from high-dimensional datasets. The subset of selected features is further utilized in the second stage of the process of classification to produce high classification accuracy. We tested the subsets using three classifiers: SVM, LR, and RF to ensure the investigation is carried out rigorously. The combination of the first and second stages of the proposed model will achieve a better identification of the different Malaria Life Cycle stages. Additionally, the feature selection method can identify genes that significantly change expression across the life cycle stages. UMAP projection of the cells based on these features supports the distinction of stages using these features. We constructed the protein interaction network of these genes and performed topological analysis and gene ontology enrichment analysis to provide hierarchies according to the importance of the genes in the network. These genes can be used for diagnosis and drug targets. Our study presents a theoretical framework to select diagnosis markers and drug targets by implementing ML techniques on sc-RNA-seq data.
2. Results
The single cell RNA-seq dataset utilized here was derived from the Malarial Cell Atlas, an open-source database of single cell transcriptomic data spanning the complete life cycle of malarial parasites. It is freely accessible through a dynamic, user-friendly web interface (www.sanger.ac.uk/science/tools/mca/mca/)[13]. For the current study, we considered the 10X scRNA-seq data of the intraerythrocytic stages of P. falciparum in the human host. The dataset has 5066 rows and 6737 columns. Each row corresponds to scRNA-seq read counts of a gene and each column corresponds the same for a single cell. There are 5066 features in this dataset, which correspond to all the genes in each cell of the parasite. Additionally, each cell is assigned one label among the four blood cycle stages (ring, early trophozoite, late trophozoite, and schizont). Thus, we set out to utilize classification ML algorithms (Material and methods) which would allow us to predict the blood cycle stage of the parasite cell based on the gene expression pattern.
2.1 Data visualisation, normalization, and dimensionality reduction of the scRNA-seq data:
We used Seurat [14], an R-based Bioconductor package, to visualise and then apply dimensionality reduction on the single cell RNA-seq data. We integrated the raw expression counts and metadata generated by Howick V.M et al. [13] to visualize the cells on a suitable manifold. Before performing any downstream analysis on the data, it is essential to minimize the variance of expression values. For this, we used the LogNormalize() method in the Seurat package. This operation divides the gene counts of each cell with the respective total counts value, using a single cell scale factor of 1e4. The resultant values are then subjected to log1p transformation, which helps in dealing with the huge number of dropouts that are characteristic of any scRNA-seq dataset [15]. For further analysis, it is useful to focus on genes that exhibit high variation over all cells in the dataset. Hence, we selected highly variable features (genes) from the data using the Find Variable Features() function. The data was then subjected to scaling before applying standard dimensional reduction techniques like PCA and UMAP. Next, PCA was performed on the data, and the clusters produced from this linear dimensional reduction were colored based on the blood cycle stages. Using the first 10 PCs, we also performed a nonlinear UMAP-based dimensional reduction on the cells for a better projection and colored the clusters based on the blood cycle stage. RunUMAP() function was used with dims=1:10. Figure 1 represents the UMAP projection and we notice four clusters for ring, early trophozoite, late trophozoite and schizont respectively.
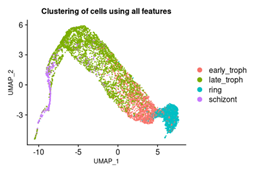
Figure 1: Three dimensional visualization of the cells from the scRNA dataset shows a distinct cluster of life cycle stages. UMAP of cells based on scRNA-seq counts of all variable features. The cell clusters are colored based on the blood cycle stages of Plasmodium Falciparum.
2.2 Classification without feature selection:
Next, we implement SVM, LR and RF algorithms to classify the cells into the four different stages by including all the genes. In order to calculate the prediction accuracy, we randomly selected 80% of the cells as training set and 20% of the cells are chosen for calculating the desired accuracy. Figure 2 shows the accuracy of SVM, LR, and RF. This is the baseline for our experiment. Without feature selection, SVM and RF performed best with classification accuracy measured this 89%. Logistic regression performed with the least accuracy of all (86%).
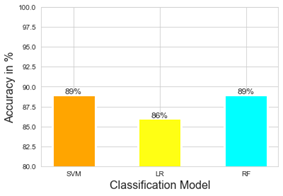
Figure 2: Classification accuracy of different models without feature selection. The classification accuracy is shown for different machine learning protocols namely SVM, LR, and RF.
|
F1 scores(%) |
SVM |
LR |
RF |
|
Malaria Life Cycle Stage |
|||
|
early troph |
0.83 |
0.78 |
0.82 |
|
late troph |
0.91 |
0.88 |
0.91 |
|
ring |
0.95 |
0.94 |
0.95 |
|
schizont |
0.74 |
0.68 |
0.72 |
Table 1: F1 scores of different models of the different classes without Feature Selection.
As listed in Table 1, the following best F1 scores were determined: ring 95%, late troph 91%, early troph 83%, and schizont 74%.
2.3 Feature selection:
From the dataset, we observed that there are many genes that do not change expression levels across the life cycle stages. Thus, feature selection would allow us to extract genes whose expression could have a more significant effect on the life cycle changes, while also reducing the dimensionality of the dataset. In order to select useful features, a genetic algorithm (GA) based pipeline was implemented (details in the Materials and Methods section). The GA pipeline removed redundant features and yielded the most optimal features. Table 2 depicts the number of features before and after selection. Out of 5066 initial features, a subset of size 378 was selected by the GA, reducing the dataset by 92.5%.
|
Number of Features |
|
|
Full Dataset |
5066 |
|
Features Selected after GA pipeline |
378 |
Table 2: Numbers of features selected.
2.4 Classification with feature selection:
In this section, we present the results of classification using the features selected by the GA pipeline, for each of the three ML models used. Figure 3 shows the accuracy of SVM, LR, and RF, after feature selection. RF performed best with classification accuracy measured this 92%. SVM and LR achieved 91% and 88% accuracy respectively. The coming sections show the test results of the SVM, LR, and RF models respectively.
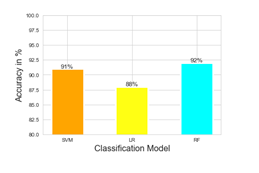
Figure 3: Classification accuracy of different models with feature selection. The classification accuracy is shown for different machine learning protocols namely SVM, LR, and RF after the selection of the 378 features following the genetic algorithm.
2.5 Using multiclass Support Vector Machine:
Table 3 presents the precision, recall, and f1 scores of the SVM model for the four different classes. For late troph and ring, we have achieved an f1 score of 0.93 and 0.96, respectively. We got a f1 score for early troph at 0.85. Schizont was the worst, at 0.79.
|
Metric (%) |
precision |
recall |
F1-score |
|
Malaria life cycle stage |
|||
|
early troph |
0.91 |
0.79 |
0.85 |
|
late troph |
0.89 |
0.97 |
0.93 |
|
ring |
0.94 |
0.97 |
0.96 |
|
schizont |
0.91 |
0.7 |
0.79 |
Table 3: Test results of SVM model with Feature selection.
2.6 Using Logistic Regression:
Table 4 presents the precision, recall, and f1 scores of the LR model for the four different classes. For late troph and ring, we have achieved an f1 score of 0.90 and 0.95, respectively. We got a f1 score for early troph at 0.83. Schizont was the worst, at 0.68.
|
Metric (%) |
precision |
recall |
F1-score |
|
Malaria Life Cycle Stage |
|||
|
early troph |
0.86 |
0.79 |
0.83 |
|
late troph |
0.88 |
0.92 |
0.9 |
|
ring |
0.94 |
0.96 |
0.95 |
|
schizont |
0.74 |
0.63 |
0.68 |
Table 4: Test results of LR model with Feature Selection.
2.7 Using Random Forest:
Table 5 presents the precision, recall, and f1 scores of the RF model for the four different classes. For late troph and ring, we have achieved an f1 score of 0.94 and 0.96, respectively. We got a f1 score for early troph at 0.87. Schizont was the worst at, 0.79.
|
Metric (%) |
precision |
recall |
F1-score |
|
Malaria life cycle stage |
|||
|
early troph |
0.93 |
0.82 |
0.87 |
|
late troph |
0.9 |
0.97 |
0.94 |
|
ring |
0.95 |
0.97 |
0.96 |
|
schizont |
0.91 |
0.7 |
0.79 |
Table 5: Test results of RF model with feature selection.
2.8 Confusion matrix and mutual information between predicted and true labels for three models:
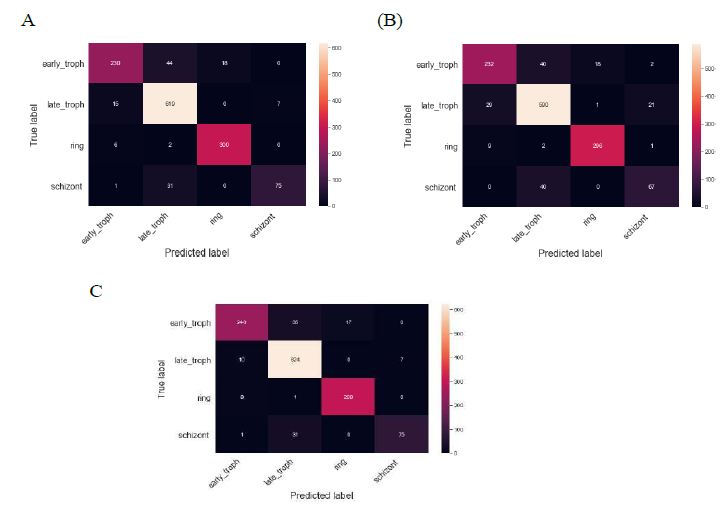
Figure 4: Confusion matrix of different models shows the prediction accuracy for different stages. The heatmaps display the confusion matrix in predicting the four different stages as indicated after feature selection for three different models (A) SVM (B) LR (C) RF models.
Figure 4 shows the confusion matrix of the three models. The confusion matrix for the SVM model shows that 44 samples were predicted as late troph which should have been labeled as early troph. Similarly, 31 samples were predicted as late troph which were otherwise labeled as schizont. For late troph class, 15 samples were misclassified as early troph. For ring class, 6 samples were misclassified as early troph.
The confusion matrix for the LR model shows that 40 samples were predicted as late troph which should have been labeled as early troph. Similarly, 40 samples were predicted as late troph which were otherwise labeled as schizont. For late troph class, 29 samples were misclassified as early troph. For ring class, 9 samples were misclassified as early troph.
The confusion matrix for the RF model shows that 35 samples were predicted as late troph which should have been labeled as early troph. Similarly, 31 samples were predicted as late troph which were otherwise labeled as schizont. For late troph class,
10 samples were misclassified as early troph. For ring class, 8 samples were misclassified as early troph. These were some of the common misclassifications in all three models.
2.9 A comparison of classification without vs with feature selection:
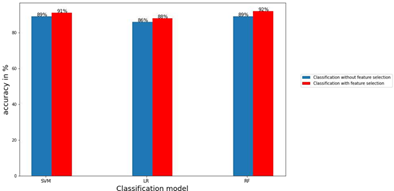
Figure 5: Classification accuracy with feature selection vs without feature selection demonstrate the legitimacy of the selected features. The bar graphs display a comparison between the values of accuracy for the three models and for classification with feature selection and without feature selection as indicated.
Figure 5 shows the accuracy of classification without feature selection vs. classification with feature selection. We have reduced our feature set from 5066 to 378, using which we achieved an improved accuracy of 91% in the SVM model, 88% in the LR model, and 92% in the RF model. For the SVM model, without feature selection, we got a f1 score of 0.83, 0.91, 0.95, and 0.74, whereas, with feature selection, we got a f1 score of 0.85, 0.93, 0.96, and 0.79 for early troph, late troph, ring, and schizont, respectively. For the LR model, without feature selection, we got a f1 score of 0.78, 0.88, 0.94, and 0.68, whereas, with feature selection, we got a f1 score of 0.83, 0.90, 0.95, and 0.68 for early troph, late troph, ring, and schizont, respectively. For the RF model, without feature selection, we got a f1 score of 0.82, 0.91, 0.95, and 0.72, whereas, with feature selection, we got a f1 score of 0.87, 0.94, 0.96, and 0.79 for early troph, late troph, ring, and schizont, respectively. Using the selected features, we achieved similar or better f1 scores across all four classes, in all three models. This proves the robustness of the features selected from the GA pipeline. For the early troph class, we achieved the best f1 score of 0.87 from the RF model. For the late troph class, we achieved the best f1 score of 0.94 from the RF model. For the ring class, we have achieved the best f1 score of 0.96 from both the SVM and RF models. For schizont class, we have achieved the best f1 score of 0.79 from the SVM and RF model. The schizont class has seen lesser f1 scores than the others, this could be because of the lesser number of schizont cells in the dataset.
We also calculated the mutual information (MI) between the predicted labels and the true labels of the three models using the joint probabilities from the confusion matrix (see Materials and Methods section). For instance, C(1,1) of the confusion matrix represents the joint probability P(X, Y) where X= true label of early troph and Y corresponds to correctly predicted early troph. Similarly, C(1,2) would reflect the joint probability P(X, Y) where X= true label of early troph while Y= incorrectly predicted to be late troph. Figure 6 shows the comparison of MI with and without feature selection. One of the advantages of displaying accuracy using mutual information is that the upper limit of the mutual information is exactly known. So, the accuracy of the model can be compared with the ideal case. In our case, since the number of labels is four, the maximum possible mutual information for an error-free case is 2 bits, however, maximum information acquired by the models is 1.28 bits here.
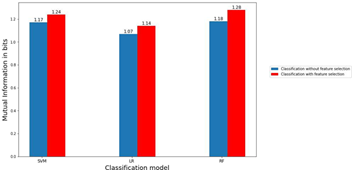
Figure 6: Mutual information with and without feature selection. The bar graphs display a comparison between the values of mutual information in bits between predicted and actual labels for the three models and for classification with feature selection and without feature selection as indicated.
2.10 Classification with randomly selecting 378 features:
In order to test whether the GA-based feature selection algorithm is able to select the features appropriately, we randomly chose 378 features from our dataset and evaluated the prediction accuracy using the SVM, LR, and RF models. We achieved an accuracy of 0.81, 0.79, and 0.80 for the models. Table 6 shows the f1 scores of the different classes for the three models.
|
F1 scores |
SVM |
LR |
RF |
|
Malaria Life Cycle Stage |
|||
|
early troph |
0.63 |
0.61 |
0.6 |
|
late troph |
0.86 |
0.85 |
0.86 |
|
ring |
0.87 |
0.84 |
0.86 |
|
schizont |
0.72 |
0.69 |
0.71 |
Table 6: F1 scores of different models of the different classes with randomly selecting 378 features.
The accuracy and the f1 scores of this experiment were lower compared to the classification results with feature selection using the GA pipeline. These results demonstrate the legitimacy of the feature selection method.
2.11 Construction and analysis of protein-protein interaction network:
Understanding protein-protein interactions (PPIs) is critical for cell physiology in normal and pathological states because they are required for practically every process in a cell [16]. Protein-protein interaction networks (PPIN) are graphs of the interactions between proteins in a cell. Protein-protein interaction happens in specified binding areas and serves a specific function. The feature selection method provided us with 378 proteins in Plasmodium falciparum. We used the Search Tool for the Retrieval of Interacting Genes/Proteins database (STRING 11.0b) [17] to construct the PPI network associated with these proteins. STRING can then construct a PPI network containing all of these proteins and their connections. Their interactions were generated with high confidence from high-throughput lab experiments and prior information in curated databases (sources: experiments, databases; Scores ≥ 0.90). The network construction shows a set of highly connected modules (Figure 7).
2.12 The topological analysis of the PPI network:
Various topological measures are generally used to evaluate both the global and node characteristics in the PPI networks, including degree (k), between centrality (BC), eccentricity, closeness centrality (CC), eigenvector centrality (EC), and clustering coefficient [18]. Here, the highest degree nodes are identified using degree distribution. Additionally, we have used Markov Clustering Algorithm (MCL) to find clusters in the network (Figure 7).
This PPIN is composed of 378 nodes with the number of edges: 600, average node degree: 3.17, average local clustering coefficient: 0.309, expected number of edges: 621, PPI enrichment p-value: 0.807. We can see that proteins in the red cluster (designated as 1st cluster) have the highest degree and high betweenness centrality. So, we can consider the red cluster as disease module. We analysed other topological properties like degree, BC, eccentricity, CC, EC, clustering coefficient, etc of this Red cluster using Gephi [19].
|
Proteins name |
Degree |
betweeness centrality |
Description |
|
C6KSW6 |
29 |
116.68 |
Leucine-rich repeat protein |
|
C6KSY0 |
29 |
83.89 |
AP2 domain transcription factor, putative |
|
Q8I2V4 |
25 |
31.35 |
Regulator of chromosome condensation-PP1- |
|
interacting protein |
|||
|
Q8IAM1 |
25 |
26.76 |
AP2 domain transcription factor, putative |
|
Q8I4R5 |
23 |
41.62 |
Rhoptry neck protein 3 |
Table 7: Topological analysis of the PPI network of the selected proteins.
The proteins in Table 7 from red cluster have high degree and betweenness centrality (BC). In this cluster, the number of nodes: 36, number of edges: 252, average node degree: 14, average local clustering coefficient: 0.83, expected number of edges: 127, PPI enrichment p-value < 10^-6. We can see that this cluster has lesser nodes with high interaction and high clustering coefficient. So, this is a small world network. We can see from the above table that C6KSW6 and C6KSY0 have the highest degree with high BC. We considered these two proteins as the hubs or bottlenecks as these nodes have high degree (k) and BC. We have chosen 3 more proteins that have high degree and BC to consider as the backbone of the PPIN. These proteins are Q8I2V4, Q8IAM1, and Q8I4R5. These 5 proteins are highly connected in PPIN and have control over the network. In order to delineate the role of the PPN clusters, gene ontology (GO) enrichment analysis were performed separately for different proteins belonging to the 6 clusters as designated in the Figure 7 and GO terms having enrichment p-values less than 0.05 are selected. The 1st cluster is found to be enriched for the Rhoptry protein family which is known to play crucial role in the virulence of the parasite inside the host [20]. The 2nd cluster proteins predominately belong to the apical complex family which mediate host penetration and invasion [21].
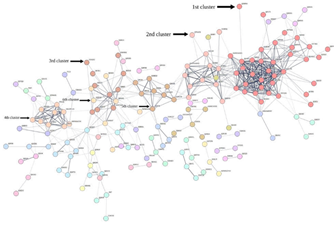
Figure 7: Protein-protein interaction network exhibits different clusters. The graph shows the protein protein interaction network of the 378 proteins selected by the feature selection method. The different colors indicate different identified clusters.
The 4th cluster is enriched with ribosomal protein plausibly to regulate translation during the IE life cycle stages [22-23]. The fifth cluster is composed of proteins belonging to symbiont containing vacuole membrane which is likely central to nutrient acquisition, host cell remodeling, waste disposal, environmental sensing, and protection from innate defense etc [24]. One of the components of 6th cluster is found to be the proteins in the nucleolus which are important for regulation of ribosomal biogenesis [25].
Out of the 5 proteins with high degree and betweeness in the PPI network, Q8I4R5 (from the red cluster) showed p-value less than 0.05 in the GO enrichment analysis. We see that Q8I4R5 is a rhoptry protein (UniProt ID: RON3) [26]. As RON3 affects the functional translocation of exported proteins and glucose uptake, it could be a potential target for drug design.
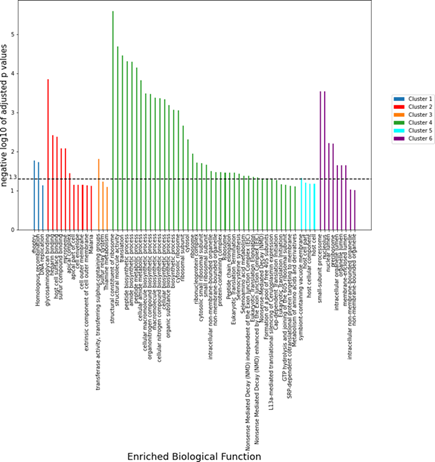
Figure 8: Different enriched biological functions for the first six protein-protein interaction clusters. The p-values of the enrichment of different gene ontologies for the six clusters of the PPI network as indicated by the color code. The horizontal dashed line represents a threshold of 0.05.
The function of a membrane protein complex called the Plasmodium translocon of exported proteins (PTEX), which exports specific parasite proteins across the parasitophorous vacuolar membrane (PVM) that encases the parasite in the host RBC cytoplasm, is essential for Plasmodium spp. survival within the host red blood cell (RBC). The core of PTEX has three proteins: EXP2, PTEX150, and the HSP101 ATPase. Only EXP2 is a membrane protein out of these three proteins. Studying the PTEX-dependent transport of members of the exportome, we found that when the parasite rhoptry protein RON3 was conditionally disrupted, exported proteins such as the ring infected erythrocyte surface antigen (RESA) were unable to move in parasites. Additionally, RON3-deficient parasites did not progress through the ring stage, and their intake of glucose was drastically reduced. The results show that RON3 affects two translocation processes, including the movement of the parasite exportome through PTEX and the movement of glucose from the RBC cytoplasm to the parasitophorous vacuolar (PV) space, where it can enter the parasite via the hexose transporter (HT) in the parasite plasma membrane [26]. (see figure 8).
2.13 Expression profile of the selected features:
The analysis above provides us with a set of proteins that are associated with the progression of the malaria pathogen through different stages of the blood cycle. Thus, the expression pattern of these proteins would elicit the identity of the stages. In order to investigate the overall expression pattern of the genes across the different stages, we extracted the selected 378 features from the dataset. For each feature, we find the average RNA-seq read counts for all four classes (early troph, late troph, schizont, and ring). The average values are then transformed into log scale. We observed that genes fall into different clusters according to the expression patterns (Figure 9) and also the expression patterns vary among the stages. For instance, the genes at the bottom have a very low expression in ring phase. Similarly, genes at the top cluster are displaying low expression for all stages. These expression patterns may be harnessed to look for specific markers for different stages. Additionally, we visualised the clustering behaviour of cells after feature selection by GA, using the 378 features via the Seurat package. As done previously, the normalized counts were subjected to linear and non-linear dimensionality reduction using PCA and UMAP respectively. Figure 13 shows clear clusters of all the four blood cycle stages - ring, early troph, late troph, and schizont, which supports that the selected features can serve as markers for the respective stages.
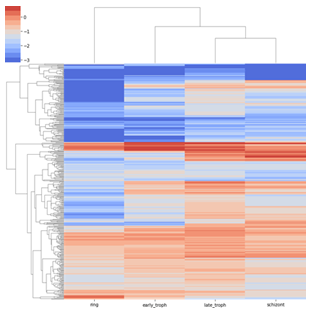
Figure 9: The expression profiles are distinct among the stages. Expression profile of the selected genes across the different stages. The heat map shows the average RNA count of the selected 378 genes across the different stages as indicated. A hierarchical clustering is performed on the expression levels in order to group genes with similar expression patterns indicated by the dendrogram.
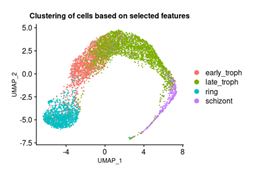
Figure 10: Three dimensional visualization of the cells based on selected features. UMAP of cells using 378 features. The cell clusters are colored based on the blood cycle stages of Plasmodium falciparum.
3. Discussion
In the last decade, numerous machine learning (ML) approaches have been proposed to yield more accurate results for various diseases. Karthik and Sudha, [27] reviewed ML methods for classifying gene expression models or computational analytical structures for complicated diseases, by identifying several differentially expressed gene techniques. Authors in [28] used Convolutional Neural Networks (CNNs) based deep learning models for attribute extraction and categorization. For achieving higher categorization accuracy, they selected certain dominating features including size, color, shape, and cell count from the images. Similarly, a more effective two-stage approach based on CNNs on a larger dataset was also proposed by [29]. It remains an especially challenging task to distinguish the multiple growth stages of parasites. Seng et al. [30] developed a deep-learning approach for the recognition of multi-stage malaria parasites in blood smeared images using a novel deep transfer graph convolutional network (DTGCN). They reported higher accuracy and effectiveness compared to a wide range of state-of-the-art approaches.
Numerous ML approaches have been proposed in the literature to enhance gene expression data classification such as clustering, classification, and dimensional reduction, among others [31]. Training of ML models using initial high-dimensional features performs unsatisfactorily in practice and may result in network overfitting and increased redundant information. This problem was addressed using random forests classifier in [32, 33]. Hossain et al. [34] designed an effective variational quantum circuit (VQC-based) approach to recognize the existence of malaria from RBC images through the classification of an optimized feature set extracted from them. Murad et al [35]. used algorithms based on multifilter and hybrid approaches to feature selection leading to an accuracy of more than 90%. Mei et al. [36] suggested a dimensionality reduction method for classifying tumor gene expression data. Arowolo et al [37]. and Li et al.[38] proposed a dimensionality reduction approach for classifying gene expression.
To overcome the dimensionality problem, Rokach et al. devised a genetic algorithm-based feature selection method. They evaluated the fitness function of several, obvious tree classifiers using a new encoding approach [39]. Zhang et al. proposed a classifier ensemble with feature selection based on GA. The authors of this work created a new hybrid method that combines a multi-objective genetic algorithm with an ensemble of classifiers. The GA- ensemble approach was tested on a variety of datasets and its performance was compared using a variety of classifiers [40]. Cheng-Lung Huang [41] suggested a feature selection method based on GA and SVM optimization. The ultimate goal was to improve the SVM classification accuracy while optimising the feature subset and parameters. Chaung et al. [42] employed a hybrid technique that began with a genetic algorithm with a dynamic variable to pick a sample of genes, which were then ranked using chi square analysis, and the level of accuracy of the selection was assessed using SVM. Shutao et al. [43] used Particle Swarm optimisation and GA to perform highly accurate classification. The authors in [44] achieved a classification accuracy of 90.32 % using GA for feature selection and a SVM Classifier.
In this paper, we used ML classifying techniques in conjunction with a GA-based feature selection algorithm on sc-RNAseq datasets. Single cell RNA-seq is a very recent technique to characterise gene expression at the single cell level. Till now no previous ML algorithm has been developed to be implemented on single cell data. Specifically, in malaria parasites single cell characterization of the life cycle stages would be critical in identifying markers for the stages that can be harnessed to develop new drug targets. Here, we used only one scRNA-seq data sets in order to present the general protocol. The study has proposed a two-stage model for feature selection and classification which has been shown to improve the classification of the different stages of the Malaria Life Cycle. This was achieved by removing the irrelevant features from the total data set considered for analysis. The study’s main finding is that using a feature selection procedure before applying a classification algorithm results in more accurate predictions. The use of GA as a feature selection process significantly reduced the number of features included in the dataset. The proteins and the corresponding PPI network identified through the method are found to be functionally important for the progression through life the cycle stage from previous studies [20-25]. However, the protocol must be employed and tested for other available similar data sets in order to strengthen the benchmark. Our work offers a general theoretical framework integrating ML techniques and network analysis for identifying protein targets for malaria parasites. The general framework can be implemented in other diseases as well. For further research, the hybrid methods for feature selection, the impact of parameter fine tuning on various algorithms’ levels and the use of other methods including Ensemble Learning may be attempted.
4. Material and Methods
4.1 System Design:
The proposed classification technique comprises two stages, namely:
- Dimensionality Reduction with Feature Selection
- Classification
A. Dimensionality Reduction with Feature Selection:
The dimensionality of the gene expression dataset is high. The dataset has redundant features which act as noise while training a model. This results in poor classification performance and high computational time. Dimensionality reduction is a technique that removes redundant features that hinder performance. We have used the feature selection [45] dimensionality reduction technique.
Let X be the initial m dimensional set of features, defined by the equation X = x (i) | i = 1, 2,...m where x(i) are the defined features and m are the genes. The process of feature selection generates Y (i) | i = 1, 2,...,p where Y(i) represents the new subset of features and p is now the number of features in the subset with p ≤ m. There are three types of feature selection methods - Filter, Wrapper, and Embedded approaches [46-47].
Figure 11 shows the proposed computational model framework. The feature selection stage uses GA for dimensionality reduction. Genetic Algorithm (GA) is a metaheuristic, evolutionary, stochastic optimization algorithm inspired by the process of natural selection. GAs are commonly used to generate optimum solutions to problems employing three biologically inspired operators selection, crossover, and mutation.
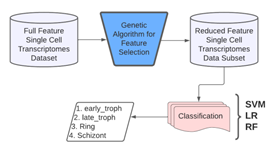
Figure 11: Proposed computational model framework.
B. Classification
Classification is the process of identification of which of a set of categories or sub-populations an observation belongs to. Usually, the individual observations are grouped into a set of quantifiable properties called features. These features may either be categorical or ordinal or integer or real-valued. In the field of machine learning, the observations are called instances, the variables termed as features are grouped to form a feature vector, and the to-be-predicted categories are called classes. Figure 12 shows the pseudo-code of the entire pipeline. We have used three classification algorithms in our research viz. Support Vector Machines, Logistic Regression and Random Forest.
Support vector machines (SVM) are one of the most popular, robust, non-probabilistic, binary, linear and non-linear classifier, supervised learning algorithms that analyze data for classification or regression analysis in machine learning. Based on a set of categorized training data, an SVM training model assigns new unseen examples to either of the trained categories, creating the decision boundaries (or hyperplanes) that can segregate n-dimensional space into classes.
Logistic regression (LR) is another powerful supervised ML algorithm used for binary classification problems that can be generalized to multiclass classification. A logistic function is used to model the probability of a discrete outcome based on an input variable. LR is an extensively employed algorithm for classification problems in industry owing to its high simplicity and efficiency particularly for linearly separable classes.
Random forests (RF) are an ensemble learning classification method and work by constructing a multitude of decision trees at training time. For classification jobs, the RF output is the class selected by most trees. Ensemble learning combines many classifiers to provide solutions to complex problems. In Machine learning RFs also assist in reducing the training set overfitting by decision trees and also increases precision.

Figure 12: Pseudocode of the proposed method.
4.2. Experimentation:
The following sections will introduce each of the followed steps in detail. A summary of the implementation of the entire pipeline is depicted in Figure 13.
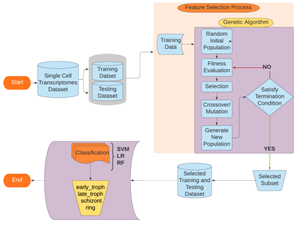
Figure 13: Flowchart of entire pipeline.
A. Data Preparation:
In order to create an independent test set and improve the classification validity and accuracy, the input data was divided into the training and testing sets in a ratio of 80% and 20% respectively. The training set was created to validate the feature selection while the test set served a similar validation role in the classification process. The training set is then processed through the GA pipeline.
B. Genetic Algorithm:
Genetic Algorithm (GA) is a stochastic evolutionary optimization technique. It starts with an initial randomized set of the population of features (500 here) and then creates another population using subsets of the available features whose individuals are evaluated using the Random Forest predictive model for the target task. The tournament selection technique is used to pick the higher fitness subsets to be carried forward into the next generation for applying the cross-over (updating the winning feature sets with features from the other winners) and mutation (probabilistically introducing or removing some features) genetic operators. The individuals of this subset are stored in the Hall of Fame which is continuously sorted so as to have the first element with the maximum fitness value so far. This process is iterated to yield the optimum features for the set termination criteria (maximum generations= 100, if no change in the best-fitted individual for 20 generations). Few other GA modelling parameters used in our research are - uniform crossover probability of 0.5 and flip-bit-mutation probability of 0.2.
C. Classification Process:
After the GA has selected the optimal features, these features are then subjected to different classification algorithms (SVM, Random Forest, Logistic Regression) to measure the classification accuracy of the selected feature set. This yields us the classification accuracy of the four different classes viz early troph, late troph, schizont, and ring.
4.3 Mutual Information:
Mutual Information (MI) is a measure of how much one variable’s uncertainty is reduced when the other variable’s value is known. It is given by the formula [48] :

where P (X1, X2) is the joint distribution of the two variables. P (X1) and P (X2) is the marginal distribution of the two variables. It’s a dimensionless quantity that’s measured in bits. Each element of the confusion matrix represents the conditional probability of predicting a class y’ given the true category y - p(y′|y). The joint probability of P (y, y′) is equal to the multiplication of the probability of true label P (y) and conditional probability P (y′|y). P (y′) is
given by the sum of joint probability over true label y. We have used this to find the I(y; y′).
4.4 Data and Software Availability:
The data are freely accessible as a processed dataset through a user-friendly web interface (www.sanger.ac.uk/science/tools/mca/mca/)[13]. Our dataset has 5066 rows and 6737 columns. Each row corresponds to a single cell and each column corresponds to a gene. We have 5066 features in our dataset. We have four different malaria life cycle stages (early troph, late troph, ring, and schizont).
Ada, the High-Performance Computing Data Center of International Institute of Information Technology Hyderabad, India was utilized for the computation. It consists of 92 nodes, each equipped with dual Intel Xeon E5-2640 v4 processor, 128 GB RAM, two scratch disks (2 TB SATA and 960 GB SSD SATA) and four Nvidia GTX 1080 Ti / RTX 2080 Ti GPUs. The cluster has a total of 1472512 GPU cores, 3680 CPU cores and 11776 GB RAM. For our experiment, we have used 40 cores with maximum memory per CPU of 2 GB on a Linux Ubuntu operating system. The proposed model is implemented using Python with the genetic selection library for the Genetic Algorithm implementation and the sklearn library for the classification algorithms. The relevant data and python scripts can be found in this GitHub code
We used the R-based Seurat (v4.1.0) package developed by Satija lab [14] for visualisation and dimensionality reduction of single cell RNA-seq data. This was implemented in R (v4.1.3), run on RStudio environment (v1.3.1093). We followed the standard pre-processing workflow, normalisation, linear and non-linear dimensionality reduction recommended by Seurat developers with default parameters unless otherwise mentioned in the results section. The feature selection method provided us with 378 proteins in Plasmodium falciparum. We have used the Search Tool for the Retrieval of Interacting Genes/Proteins database (STRING 11.0b)[17] to construct the PPI network associated with these proteins. STRING software https://string-db.org/ can then construct a PPI network containing all of these proteins and their connections. Their interactions were generated with high confidence from high-throughput lab experiments and prior information in curated databases (sources: experiments, databases; Scores ≥0.90). Various topological measures are generally used to evaluate the both global and node characteristics in the PPI networks, including degree (k), between centrality (BC), eccentricity, closeness centrality (CC), eigenvector centrality (EC), and clustering coefficient[18]. Here, the highest degree nodes are identified using degree distribution. Additionally, we have used Markov Clustering Algorithm (MCL) (using STRING) to find clusters in the network. Among these clusters, we identified a red cluster which contains the node with the highest degree and high betweeness centrality. We have analysed topological properties like degree, BC, eccentricity, CC, EC, clustering coefficient, etc of the Red cluster using Gephi[19] software.
Acknowledgement
Authors thank the Department of Biotechnology (No. BT/RLF/Re-entry/32/2017), Government of India for funding.
References
- Abbas N, Saba T, Rehman A, et al. Plasmodium life cycle stage classification based quantification of malaria parasitaemia in thin blood smears. Microscopy research and technique 82(2019): 283-295.
- Chappell L, Ross P, Orchard L, et al. Refining the transcriptome of the human malaria parasite Plasmodium falciparum using amplification-free RNA-seq. BMC genomics 21 (2020): 1-19.
- Poostchi M, Silamut K, Maude RJ, et al. Image analysis and machine learning for detecting malaria. Translational Research 194 (2018): 36-55.
- Ngara M, Palmkvist M, Sagasser S, et al. Exploring parasite heterogeneity using single-cell RNA- seq reveals a gene signature among sexual stage Plasmodium falciparum parasites. Experimental cell research 371 (2018): 130-138.
- Sa JM, Cannon MV, Caleon RL, et al. Single-cell transcription analysis of Plasmodium vivax blood-stage parasites identifies stage-and species- specific profiles of expression. PLoS biology 18 (2020): e3000711.
- Reid AJ, Talman AM, Bennett HM, et al. Single-cell RNA-seq reveals hidden transcriptional variation in malaria parasites. elife 7 (2018): e33105.
- Walzer KA, Fradin H, Emerson LY, et al. Latent transcriptional variations of individual Plasmodium falciparum uncovered by single-cell RNA-seq and fluorescence imaging. PLoS genetics 15 (2019): e1008506.
- Poran A, No¨tzel C, Aly O, et al. Single-cell RNA sequencing reveals a signature of sexual commitment in malaria parasites. Nature 551 (2017): 95-99.
- Rawat M, Srivastava A, Johri S, et al. Single-Cell RNA Sequencing Reveals Cellular Heterogeneity and Stage Transition under Temperature Stress in Synchronized Plasmodium falciparum Cells. Microbiology spectrum 9 (2021): e00008-21.
- Pradhan M. Evolutionary computational algorithm by blending of PPCA and EP- Enhanced supervised classifier for microarray gene expression data. IAES International Journal of Artificial Intelligence 7 (2018): 95.
- Jain D, Singh V. An efficient hybrid feature selection model for dimensionality reduction. Procedia Computer Science 132 (2018): 333-341.
- Singh DAAG, Leavline EJ, Priyanka R, et al. Dimensionality reduc- tion using genetic algorithm for improving accuracy in medical diagnosis. International Journal of Intelligent Systems and Applications 8 (2016): 67.
- Howick VM, Russell AJ, Andrews T, et al. The Malaria Cell Atlas: Single parasite transcriptomes across the complete Plasmodium life cycle. Science 365 (2019): 2619.
- Butler A, Hoffman P, Smibert P, et al. Integrating single-cell transcriptomic data across different conditions, technologies, and species. Nature Biotechnology 36 (2018): 411-420.
- Booeshaghi A, Pachter L. Normalization of single-cell RNA-seq counts by log (x+ 1) or log (1+ x). Bioinformatics 37 (2021): 2223-2224.
- Silverbush R, Dana Sharan. A systematic approach to orient the human pro- tein-protein interaction network. Nature Communications 3015 (2019).
- Szklarczyk D, Gable AL, Nastou KC, et al. The STRING database in 2021: customizable protein-protein networks, and functional characterization of user- uploaded gene/measurement sets. Nucleic acids research 49 (2021): 605-612.
- Albert R, Barab´asi AL. Statistical mechanics of complex networks. Reviews of modern physics 74 (2002): 47.
- Bastian M, Heymann S, Jacomy M. Gephi: An Open Source Software for Exploring and Manipulating Networks 3 (2009): 361-362.
- Counihan NA, Kalanon M, Coppel RL, et al. Plasmodium rhoptry proteins: why order is important. Trends in parasitology 29 (2013): 228-236.
- Okamoto N, Keeling PJ. The 3D structure of the apical complex and association with the flagellar apparatus revealed by serial TEM tomography in Psammosa pacifica, a distant relative of the Apicomplexa. PloS one 9 (2014): e84653.
- Painter H J, Chung NC, Sebastian A, et al. Genome- wide real-time in vivo transcriptional dynamics during Plasmodium falciparum blood- stage development. Nature communications 9 (2018): 1-12.
- Erath J, Djuranovic S, Djuranovic SP. Adaptation of translational machinery in malaria parasites to accommodate translation of poly-adenosine stretches throughout its life cycle. Frontiers in Microbiology 10 (2019): 2823.
- Spielmann T, Montagna GN, Hecht L. Molecular make-up of the Plasmodium parasitophorous vacuolar membrane. International Journal of Medical Microbiology 318 (2012): 179-186.
- Briquet S, Ourimi A, Pionneau C, et al. Identification of Plasmodium falciparum nuclear proteins by mass spec- trometry and proposed protein annotation. PLoS One 13 (2018): e0205596.
- Low LM, Azasi Y, Sherling ES, et al. Deletion of Plasmodium falciparum protein RON3 affects the functional translocation of exported proteins and glucose uptake. MBio 10 (2019): e01460-19.
- Karthik S, Sudha M. A survey on machine learning approaches in gene expression classification in modelling computational diagnostic system for complex diseases. International Journal of Engineering and Advanced Technology 8 (2018): 182-191.
- Chima JS, Shah A, Shah K, et al. Malaria Cell Image Classification Using Deep Learning. International Journal of Recent Technology and Engineering 8 (2020): 5553-59.
- Arshad QA, Ali M, Hassan Su, et al. A dataset and benchmark for malaria life-cycle classification in thin blood smear images. Neural Computing and Applications 34 (2022) 4473-4485.
- Li S, Du Z, Meng X, et al. Multi-stage malaria parasite recognition by deep learning. Giga Science 10 (2021): giab040.
- AROWOLO MO, ADEBIYI MO, NNODIM CT, et al. An Adaptive Genetic Algorithm with Recursive Feature Elimination Ap- proach for Predicting Malaria Vector Gene Expression Data Classification using Sup- port Vector Machine Kernels. Walailak Journal of Science and Technology (WJST) 18 (2021) 9849-11.
- Li Q, Dong B, Wang D, et al. Identification of Secreted Proteins From Malaria Protozoa With Few Features. IEEE Access 8 (2020): 89793-89801.
- Mishra SK. Human Malaria Detection and Stage Classification using Random Forest Classifier. 6 (2021): 214-218.
- Hossain MM, Rahim MA, Bahar AN, et al. Automatic malaria dis-ease detection from blood cell images using the variational quantum circuit. Informatics in Medicine Unlocked 26 (2021): 100743.
- Al-Rajab M, Lu J, Xu Q. A framework model using multifilter feature selection to enhance colon cancer classification. Plos one 16 (2021): 0249094.
- Mei Q, Zhang H, Liang C. A discriminative feature extraction approach for tumor classification using gene expression data. Current Bioinformatics 11 (2016): 561-570.
- Arowolo MO, Adebiyi MO, Adebiyi AA, et al. A hybrid heuristic dimensionality reduction methods for classifying malaria vector gene expression data. IEEE Access 8 (2020): 182422-182430.
- Li J, Zhao Z, Zhou L, et al. Y-SPCR: A new dimensionality reduction method for gene expression data classification. 2019 IEEE International Conference on Bioinformatics and Biomedicine (BIBM) 5 (2019): 401-408.
- Rokach L. Genetic algorithm-based feature set partitioning for classification problems. Pattern Recognition 41 (2008): 1676-1700.
- Zhang Z, Yang P. An ensemble of classifiers with genetic algorithm based feature selection. The IEEE intelligent informatics bulletin 9 (2008): 18-24.
- Huang CL, Wang CJ. A GA-based feature selection and parameters optimization- for support vector machines. Expert Systems with applications 31 (2006): 231-240.
- Chuang LY, Ke CH, Chang HW, et al. A two-stage feature selection method for gene expression data. OMICS A journal of Integrative Biology 13 (2009): 127-137.
- Li S, Wu X, Tan M. Gene selection using hybrid particle swarm optimization and genetic algorithm. Soft Computing 12 (2008): 1039-1048.
- Mohamad MS, Deris S, Illias RM. A hybrid of genetic algorithm and support vector machine for features selection and classification of gene expression microarray. International Journal of Computational Intelligence and Applications 5 (2005): 91-107.
- Almugren N, Alshamlan H. A survey on hybrid feature selection methods in microar- ray gene expression data for cancer classification. IEEE access 7 (2019): 78533-78548.
- Jabeen A, Ahmad N, Raza K. Classification in BioApps; Springer 10 (2018): 133-172.
- Sahu B, Dehuri S, Jagadev A. A study on the relevance of feature selection methods in microarray data. The Open Bioinformatics Journal 11 (2018).
- Cover TM. Elements of information theory; John Wiley & Sons 7 (1999).
