Re-Energizing Suriname with Less Energy
Article Information
Daniel A. Lachman*
FHR Institute, Paramaribo, Suriname, United States
*Corresponding Author: Daniel A. Lachman, FHR Institute, Paramaribo, Suriname, United States, Tel: 597-888-3156;
Received: 22 April 2018; Accepted: 29 April 2018; Published: 30 April 2018
Citation: Daniel A. Lachman. Re-Energizing Suriname with Less Energy. Journal of Environmental Science and Public Health 2 (2018): 96-135.
Share at FacebookAbstract
Energy intensity can be dropped without harming the economy through energy reduction. Actually, the economy could grow while reducing energy use, if the economy’s base is transformed into knowledge-based industries (those with so-called increasing returns). Such a transition in itself provides opportunities for learning, skill and knowledge creation, network building, etc., and involves education and research institutes, small, medium and large business, industries and trade networks and proactive Government departments. Subsequently, businesses erected due to and during the transition towards an energy-efficient economy could export their products and services, thereby contributing further to the nation’s economy. This has been explored for Suriname using a top-down approach (ACEEE 2015 International Self-Scoring Tool) and bottom-up approaches to quantify reduction opportunities in each sector. Results show that reduced energy usage directly and indirectly amounts to US$ 194,188,398.10, with an investment of US$ 29.55 million. Furthermore, 274 jobs can be created by transitioning to an energy-efficient economy with an export market size of US$ 34 billion (based on gap analyses). However, this requires a dramatic shift in strategic direction, policy frameworks for energy and other fields. However, the investment can add to GDP and can transform the economy into one with increasing returns.
Keywords
Energy reduction, Economic growth, Economy
Energy reduction articles Energy reduction Research articles Energy reduction review articles Energy reduction PubMed articles Energy reduction PubMed Central articles Energy reduction 2023 articles Energy reduction 2024 articles Energy reduction Scopus articles Energy reduction impact factor journals Energy reduction Scopus journals Energy reduction PubMed journals Energy reduction medical journals Energy reduction free journals Energy reduction best journals Energy reduction top journals Energy reduction free medical journals Energy reduction famous journals Energy reduction Google Scholar indexed journals energy articles energy Research articles energy review articles energy PubMed articles energy PubMed Central articles energy 2023 articles energy 2024 articles energy Scopus articles energy impact factor journals energy Scopus journals energy PubMed journals energy medical journals energy free journals energy best journals energy top journals energy free medical journals energy famous journals energy Google Scholar indexed journals wildlife articles wildlife Research articles wildlife review articles wildlife PubMed articles wildlife PubMed Central articles wildlife 2023 articles wildlife 2024 articles wildlife Scopus articles wildlife impact factor journals wildlife Scopus journals wildlife PubMed journals wildlife medical journals wildlife free journals wildlife best journals wildlife top journals wildlife free medical journals wildlife famous journals wildlife Google Scholar indexed journals Pollution articles Pollution Research articles Pollution review articles Pollution PubMed articles Pollution PubMed Central articles Pollution 2023 articles Pollution 2024 articles Pollution Scopus articles Pollution impact factor journals Pollution Scopus journals Pollution PubMed journals Pollution medical journals Pollution free journals Pollution best journals Pollution top journals Pollution free medical journals Pollution famous journals Pollution Google Scholar indexed journals water articles water Research articles water review articles water PubMed articles water PubMed Central articles water 2023 articles water 2024 articles water Scopus articles water impact factor journals water Scopus journals water PubMed journals water medical journals water free journals water best journals water top journals water free medical journals water famous journals water Google Scholar indexed journals energy conservation articles energy conservation Research articles energy conservation review articles energy conservation PubMed articles energy conservation PubMed Central articles energy conservation 2023 articles energy conservation 2024 articles energy conservation Scopus articles energy conservation impact factor journals energy conservation Scopus journals energy conservation PubMed journals energy conservation medical journals energy conservation free journals energy conservation best journals energy conservation top journals energy conservation free medical journals energy conservation famous journals energy conservation Google Scholar indexed journals soil articles soil Research articles soil review articles soil PubMed articles soil PubMed Central articles soil 2023 articles soil 2024 articles soil Scopus articles soil impact factor journals soil Scopus journals soil PubMed journals soil medical journals soil free journals soil best journals soil top journals soil free medical journals soil famous journals soil Google Scholar indexed journals land disposal of wastes articles land disposal of wastes Research articles land disposal of wastes review articles land disposal of wastes PubMed articles land disposal of wastes PubMed Central articles land disposal of wastes 2023 articles land disposal of wastes 2024 articles land disposal of wastes Scopus articles land disposal of wastes impact factor journals land disposal of wastes Scopus journals land disposal of wastes PubMed journals land disposal of wastes medical journals land disposal of wastes free journals land disposal of wastes best journals land disposal of wastes top journals land disposal of wastes free medical journals land disposal of wastes famous journals land disposal of wastes Google Scholar indexed journals
Article Details
Untitled Document
1. Introduction
The transition towards sustainable energy systems has been contested, especially from proponents of the thought that there is a strong positive link between economic growth and energy use. This has been displayed in several statistical exercises in various studies [1], which inadvertently imply that increases in energy intensity (the amount of energy used per unit Gross Domestic Product) should be a necessary condition for economic growth and development. This has been the main logic why some countries were extremely reluctant to ratify and commit themselves to energy / carbon dioxide output reduction schemes, since they were afraid that economic growth would be hampered.
These studies are not without controversy, and the last years increasing evidence is brought forward by scholars who contest this ruling notion. The claim with respect to the positive relationship can be countered with the simple observation that many countries, such as the U.S., China, and the former Soviet Union, have been experiencing declining energy intensities for years on end; the driving factor for the decline lies in the transition away from energy-intensive industries towards more service oriented economies [2, 3].
Another contesting notion can be found in the scrutiny of transitions towards high degrees of energy efficiency and energy savings. Energy systems are socio-technical systems, since they encompass legal frameworks, behavioural patterns, infrastructure, technology, education, etc., which co-evolve [4-6]. Therefore, energy efficiency and conservation efforts by definition tap on behavioural aspects of energy consumers and producers, institutional and legal aspects, system and technology research, development and deployment, etc. In all these realms, transitions towards energy efficiency and conservation harbour in them the potential to develop and diffuse knowledge, ignite and diffuse innovation, spur small and medium enterprises, accelerate and diffuse research and development, etc. [2, 7, 8]. In effect, this contributes to a transition towards a less energy intensive economy ? and even sets the steps towards a knowledge economy [9, 10] which lowers energy intensity, and even can increase economic output if the knowhow associated with implementation of energy efficiency and conservation research, development and deployment is exported. Such exports would be relatively easy to generate since its basic constituent is knowhow rather than material input, thereby effectively being an asset with increasing returns [11, 12]. Another avenue where economic output is increased is the very fact that a reduction in energy use effectively lowers the cost associated with externalities resulting from energy generation, conversion and transport, such as land and water use, air pollution, effects on wildlife and the environment, etc. [13].
In the field of energy efficiency and conservation such feats have been observed. Lovins [14] described the creation of an industry with increasing returns in the case of Cuba during 2006 and 2007 when the island underwent the transition towards energy efficiency and savings. Amory Lovins [15] has even argued that the introduction of energy efficiency and energy savings measures (at a cost of $ 0.5 trillion) in the Unites States will save $ 1.9 trillion up to 2050, while it can simultaneously grow the economy by 158%.
Surname’s energy intensity stands at 65.67 million BTU/cap in 2010 [16]. This is relative high compared to other Caribbean and Latin American countries and even some advanced nations IEA, 2015 [17]. The reasons for this can be found in early (infrastructural) designs, strategies and policies, strong economic growth in the early 21st century, unlocking energy previously pegged to the currently closed aluminium smelter, and behavioural aspects. In fact, in Suriname the dominant thought is that the utilization of more energy is a necessary condition to grow the economy. This forms the blueprint on which economic and energy policies are based on, as can be seen in Chin A Lin, et al. [18, 19]. Countering this thought, the objective of the paper is to unravel the potential for energy efficiency and energy savings in the major energy-consuming sectors in Suriname, and what size of industries with increasing returns the transition towards this potential can establish.
This paper continues with a brief theoretical background, with thereafter detailing the methodology. The sections thereafter respectively display the data and analysis, and the discussion of the results. The last section provides concluding remarks.
2. Theoretical Background
2.1. The energy consumption ? economic growth nexus revisited
Over the years, many academics have attempted to make links between energy consumption and economic growth, the so-called energy consumption ? economic growth nexus [20-22]. These efforts have produced figures such as the one depicted in Figure 1, which displays Gross Domestic Product per capita as a function of energy use for different countries.
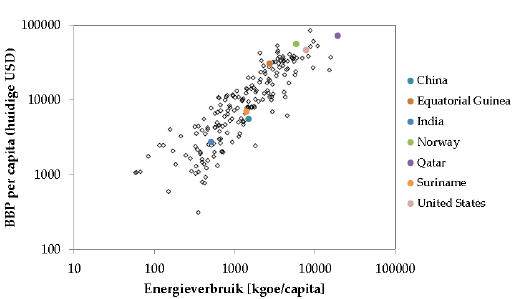
Figure 1: Gross Domestic Product (BBP in Dutch) per capita as a function of energy use for different countries (compiled using data from the United Nations Development Program and the World Bank).
Such figures support the thought that an increase in energy use leads to an increase in GDP. As such, many sources in literature point out that the advancement of society in the twentieth century was aligned with a rise in energy consumption [23] and that further advancement of these societies requires more energy [24]. Thus, decreases in energy consumption will endanger the attainment of sustainable development [25]. Even the demise of modern societies is predicted if energy consumption can’t continue its growth rate to keep up with the increasing energy metabolism of these societies [26].
This thought has gained further stronghold due to a myriad of research done on this nexus. These researches utilize various statistical methods and tools to identify the strength of the correlation between GDP and energy consumption [1, 27-31]. These studies encompass many different cases and periods, and describe the strength and direction of the causality between energy consumption and economic growth [1].
However, there is a growing body of critique on this body of research; a literature survey done by Ozturk [32] points out that there are quite some methodological reservations with respect to these studies. Chontanawat et al. states that there is no consensus on strength and direction of the causality between energy consumption and economic growth in cases scrutinized by different researchers. Chen et al. [33] goes even one-step further and highlights that the outcomes of these studies are significantly affected by the time spans, scope and models chosen. Other studies elaborate on this by claiming that the debates itself pose contradictory results, even when the scope, methods and variables are kept the same, but only the time period is changed [32, 34, 35]. For instance, in Apergis and Tang [36] it is stated that energy conservation policies should only be applied in low income countries since these will not hamper economic growth; this implies that higher income countries are not in need of energy conservation policies, a claim that can easily be refuted.
Furthermore, the studies that advocate the energy consumption-economic growth nexus often fall victim to their generalization. The models used barely reflect poor-rich and urban-rural divides differentiation between commercial and non-commercial energy commodities, informal economies, income distribution, etc.? [37, 38]. Notwithstanding the fact that the models don’t even reflect developing countries, since the models are biased towards industrialized countries, researcher still attempt to claim evidence for the growth nexus in these cases [39]. Another generalization in these studies comes in the form of the derived conclusions. The statistical analyses take a number of variables corresponding solely to energy consumption and economic growth into account. They then ascribe changes in economic growth solely to changes in energy consumption. Wolde-Rufael [40] has proven in the case of selective African countries that such claims are overrated and downplay several other significant factors that are at play with respect to economic growth. As a matter of fact, the author found that energy consumption was only a contributing factor to economic growth, and one that is no more significant than capital or labor. Another form of generalization is expanding scientific claims to other countries that haven’t been placed under scrutiny.
2.2. Knowledge inherent to energy efficiency and conservation measures
Energy systems consist of various aspects, which can be categorized into technological, social, economic, legislative, and environmental realms. Energy systems, regardless if this is the electricity, heat or transportation fuel supply infrastructure, are therefore so-called socio-technical system [41, 42]. These different elements co-evolve with each other, meaning that if one aspect is changed this will trigger an adjustment of other elements of the socio-technical system.
The research, development, deployment and actual utilization of energy efficiency and savings technologies require types of behaviours, skills, routines, and knowledge that coincide with these technologies [43]. Therefore introducing energy efficiency and energy conservation will by definition impact the elements of the socio-technical energy system in such a way that the elements of the system co-evolve in order to facilitate efficiency and conservation. The transition towards such a new set of behaviours, skills, routines, technologies and knowledge associated with the deployment of new energy efficiency and savings technologies requires knowhow and skills with respect to strategy, policy, research and development, operationalisation and commercialization, business models and processes, education, and the technologies themselves? [44, 45]. This is an important notion that is frequently underplayed since the majority of the focus for customers, policymakers, researchers, etc. is biased towards the technology involved with energy efficiency and energy conservation.
Through the transition towards energy efficiency and conservation, both suppliers and customers gain knowledge in each aspect of the socio-technical system through several sources of learning, namely learning-by-searching, learning-by-doing, learning-by-using, and learning-by interacting [43]. The latter form of learning gains prominence especially where suppliers of products and services enter in partnerships and “coopetition” (where they simultaneously cooperate and compete and share knowledge and learn from each other). This can reinforce and speed up the other forms of learning, cluster related technologies, create technology spillover, and even result in radical innovation [45-47]. “Knowledge” refers therefore to much more than “technological innovation” alone which is something that has been advocated by the main economic theories [48] and can in this research best be described by “the discovery of complexity inherent in the natural and social reality” [49].
As indicated by Pasqualetti et al. deploying energy efficiency and energy conservation to reduce the amount of energy used goes much further than just the purchase of a gadget that uses less energy. Rather, it is a synthesis of incremental knowledge gaining through various forms of learnings by all stakeholders in the socio-technical energy system, which ultimately culminates in a national innovation system able to produce radical innovations. An important notion here is that the process must be continuous in nature since there is a time lag between expenditures on research, development, demonstration and deployment on one hand, and gaining knowledge on the hand, which is found to be between two to five years [50-52]. Such a deployment is beneficial on all levels, since it involves technology that has proven to be a solid enabler of progress [9, 53]. Furthermore, it uplifts education and skills which play a crucial role in the innovation system [10], and lowers prices of products and services [54]. Also, it enables people to make informed decisions and take responsible action with respect to energy consumption [55].
The transition can thus yield a competitive edge that is not based on just a natural comparative advantage [44]. Furthermore, the competitive edge has a degree of sustainability since it’s built on the continuously accumulated knowledge gained through the forms of learning during the transition, which is something that can’t easily be replicated. When policymakers, consumers, small, medium and large enterprises, non-governmental organizations, financial institutions, etc., participate in such a transition, this irrevocably implies that society as a whole has competitive advantage, since it has built this competitive capability [56-58].
2.3. Potential to create industries with increasing returns
The input factors information and knowledge are associated with industries with increasing returns, where scaling output up requires input increasing less proportionally, see Figure 2 [59]. The differences between decreasing and increasing returns point to inherent differences between the input factor capital and labor on one hand, and information and knowledge on the other hand. The latter can serve different entities simultaneously, can’t be depleted, can increase in value the more they are used, and have the ability to yield new information and knowledge in the wake of their use through the different forms of learning [43, 60, 61].
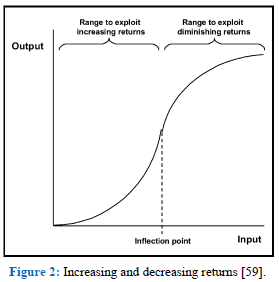
Figure 2: Increasing and decreasing returns [59].
Industries with increasing returns can be established if policy is present that creates the conditions for such industries, and shape behavioral patterns and the institutional landscape in such a way that these returns can actually be achieved [58]. These are then conditions for the formulation of energy policy, since the transition to sustainable energy systems and with them the inherent energy efficiency and energy conservation coincides with the accumulation, development and deployment of information and knowledge (as discussed in the previous section). This harbors within it the potential to create industries with increasing returns [62]. Knowledge acquisition also facilitates effort to decline costs, further enhancing the increasingly returning mechanism. This positively affects job creation, in the sense that energy efficiency and conservation spending create direct, indirect and induced jobs. Direct jobs are the immediate result of spending, whereas indirect jobs are created along the supply chain of direct impacts. Induced jobs are creation through the expenditures of direct and indirect jobs [63, 64]. Furthermore, this also positively affects tax revenues, national innovation systems, exports, etc., implying that the switch towards energy efficiency and energy conservation can be regarded as a developmental strategic choice [62, 65-67].
3. Methodology
3.1. Conceptual model
There is a large body of work in academic literature that clearly points towards a positive link between energy consumption and economic growth; from a macroeconomic perspective. Studies that point in the opposite direction, viz. decreasing energy use while simultaneously growing the economy, contest this positive link. According to this point of view the effects of the transition towards energy efficiency and savings result in the acquirement of knowledge through various form of learning in the social, legal, environmental, political, economic and technological realm, which offers the possibility to create knowledge industries with increasing returns [14, 15]. These two views are shown in the conceptual models in Figure 3.
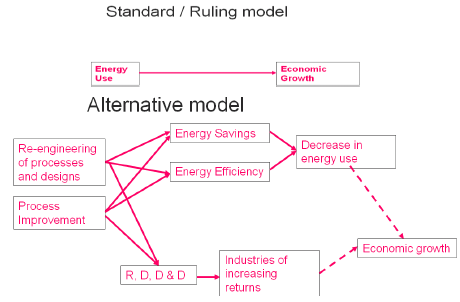
Figure 3: Two contesting conceptual models with respect to the energy consumption ? economic growth nexus.
3.2. Methods
3.2.1. Energy Efficiency and Conservation Potential: The energy efficiency and energy conservation potential will be determined from both a top-down (macro-economic) and bottom-up (sectoral or microeconomic) approach, in order to facilitate triangulation to strengthen any claims that will come forward in the analysis.
3.2.1.1 Top-down approach: The top-down approach will be executed by using the ACEEE 2014 international energy efficiency scorecard which uses a set of macroeconomic indicators and some sector-specific information to guesstimate the rough potential for energy efficiency and energy conservation.
3.2.1.2 Bottom-up approach: Energy consumption in Suriname can primarily be broken down into the transportation sector (using fossil fuels), the electricity market, and the cooking gas market (Liquid Petroleum Gas). The largest segments of the electricity market will be identified using data from utility companies [68, 69]. Thus far, the following areas for energy efficiency and saving potential calculation that will be addressed are:
- Transportation sector: using traffic intensity figures NEA, 2010 [70], the Paramaribo infrastructure scheme, and proposed solutions (as recent as 2010) will be used to calculate the amount of fuel saved. Also using data from other studies [15, 70] it will be assessed through empirical data how much fuel can be saved by introducing more fuel efficient cars, car sharing, etc.;
- Street lighting: using the amount and type of street lights currently in use, the amount of energy saved by switching to high efficiency lamps can be estimated using data from [71]. Apart from energy efficiency, empirical data from other studies will be used to assess the amount of energy can be reduced through conservation schemes like switching of light when there is nobody near the vicinity [72-74];
- High-voltage electricity infrastructure;
- Housing: using data on amounts and types of houses in Suriname [75], combined with the quantified benefits of efficiency saving measures, the amount of energy that can be saved is calculated;
- Appliances: using data on appliances in use [75], and the average gap between best performing appliances and these appliances in use [76, 77], the energy efficiency potential is estimated.
3.2.2. Estimating the size of energy efficiency and conservation sector
Using figures for energy efficiency and energy conservation potential in the region identified with IEA [17], market sizes for energy reduction measures export are identified, by calculating the potential for energy saving though the comparison of their energy intensity with benchmark figures. Next, empirical figures from other studies [63, 64] are used to determine how many jobs can be established by transitioning Suriname to an energy efficiency economy.
4. Analysis: Data and Calculations
4.1. Energy Intensity
The earlier criticism on the energy intensity concept notwithstanding, providing a historic trend of Suriname’s energy intensity is a good way to start scrutiny on energy efficiency and conservation potential in different sectors. To this end, Gross Domestic Product figures have been obtained from the World Bank [78] and predictions from the International Monetary Fund Article IV (IMF, 2014) [79] for the period covering 2007 till 2014. With respect to total primary energy supply (TPES), all forms of energy need to be taken into account, which imply electricity and liquid fuels such as propane (used for cooking), fuel oil, diesel, gasoline and kerosene. Figures for these energy carriers have been obtained from KEMA [68], the General Bureau of Statistics [80], the local utility company [69], Ministry of Finance [81] and Suralco [82]. Energy intensity has also been calculated on a per capita basis using population data from the General Bureau of Statistics [75] which needed to be extrapolated.
Not all figures were available for each year covering this period, so some assumptions needed to be made:
- 2014 figures for total electricity delivered by the local utility were extrapolated using figures from 2009 till 2013 [69, 80] applying a best fit curve to the data. A similar exercise was done for propane;
- Though marginal in the overall picture, electricity delivered in the interior was considered constant due to a lack of data which could provide some opportunity to extrapolate. The only data available thus far was from KEMA [68];
- A portion of the diesel is used for electricity generation [69, 81]. For the computations for energy intensity one should therefore be careful that no double counting is done by including both electricity and the diesel used to generate this electricity;
- The electricity used on a monthly basis by the Suralco alumina refinery was provided for 2015, during which subsequently 3, 2 and 1 processing units were in operation. Since differences in energy consumption between processing units are negligible, the energy usage from the years prior could be calculated; 5 units were in operation up till November 2009, and 4 from that moment in time till November 2011, after which 3 processing units were in use.
The culmination of these exercises is the graph below, which depicts the evolution of Suriname’s energy intensity between 2007 and 2014 (Figure 4).
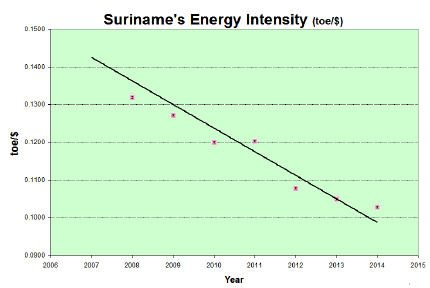
Figure 4: Suriname’s Annual Energy Intensity between 2007 and 2014 (researcher’s calculation using different sources).
4.2. Overview of Suriname’s energy sector
Though literature differs on this point to some (minor) extent, energy users are divided in Residential, Industrial and Transportation sectors [15, 83] Figure 5 displays the main energy and energy carrier flows in the case of Suriname.
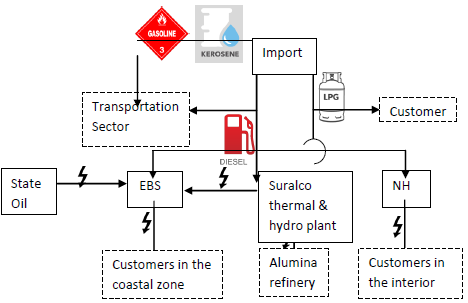
Figure 5: Overview of the main energy (carrier) streams in Suriname.
4.3. Sectors and systems under Scrutiny
The attempt is to provide the largest possible coverage of sectors in Suriname for this research. The coverage depends on the data available, the extent to which past data can be used to provide estimates of the present, data from academic and non-academic literature, statistical compendiums and business papers, and the methods used. Taking these aspects into account, the following sectors will be examined:
Electricity network: the EPAR network (Figure 5) will be of primary concern, including generation systems, the transmission and distribution system (including substations and transformers), and customers. This doesn’t imply that the other separate networks (Figure 6) don’t have any potential for energy savings and efficiency, but the lack of data and their small size relative to the EPAR network imply that these can be omitted since they will have a negligible effect on the research outcome;

Figure 6: The largest electricity system in Suriname.
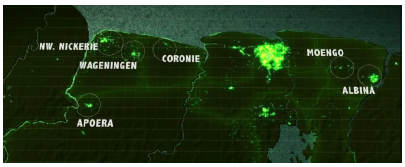
Figure 7: Locations in the coastal area with small and isolated electricity networks.
Total installed capacity equals 430.5 MW which however can’t be used in its entirety because of redundant equipment being maintained, repaired, etc. On average 175 MW is consumed (the amount of electricity delivered in 2014 expressed in kWh divided by the amount of hours in one year), with a peak demand of around 270 MW. Since redundant equipment usually encompasses around 30 ? 50 % supply has difficulty to keep up with demand.
The transmission and distribution network of the EPAR system has 26 substations, 3 for the connection of the generating units and transforming from 161 kV to 31.8 kV and 23 substations which further transform the electricity from 31.8 kV to 110V (used by the customers). In the transmission and distribution networks there are more than 6000 km of electricity lines and more than 16000 transformers. The EBS owns the transmission and distribution grids and sells electricity obtained from its own generating centre and bought from State Oil and Suralco to more than 148.000 residential and commercial customers (Figure 7).
In the interior there are 111 villages of which the majority receives electricity from the Ministry Natural Resources. The Ministry delivers diesel-fueled combustion engines with generators which feed electricity via distribution lines to the villages (Figure 5).? This electricity supply is very expensive due to high transportation costs and unreliable (electricity is only provided a few hours per day, fuel doesn’t always arrive on time, long lead times to repair broken equipment, etc.).
- Buildings: the residential, industrial, commercial and public services buildings will be assessed with respect to relative easy and affordable retrofits to reduce energy consumptions. Also, potential savings from improved appliance standards will be examined, particularly since segregate data on appliances is available from the Statistics Office;
- Industrial sector: the alumina industry has stopped as of end of November 2015, and no responses have been obtained from the State Oil company. However, using publicly available data and benchmarking analysis, the industrial gold and rice sector will be analysed.
- Transportation system: using the same logic behind the electricity system, in the case of the transportation system the roads in Greater Paramaribo will be placed under scrutiny.
The roads in Suriname total approximately 3890 km, of which the majority is in the Greater Paramaribo region (encompassing the districts Paramaribo, Wanica, Saramacca and Commewijne). These roads can be divided into asphalt, paved, sand and lateritic roads [16]. The main roads connecting the different regions in Suriname are depicted in Figure 8.
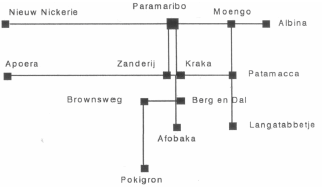
Figure 8: Main roads connecting the different regions in Suriname [84].
All these different regions and connections notwithstanding, Suriname’s administrative, commercial, residential, logistic, health care and educational centre is in and around Paramaribo. This has resulted in an expensive and overcrowded centre, people and developers have opted to move outward (Figure 9), a trend which is still continuing to this day. However, by far the majority of employment and service-providing centres are still located within close proximity of Paramaribo’s centre, which combined with poor public transportation and (hence) a heavily private vehicle ownership-centred culture has resulted in inefficient traffic.
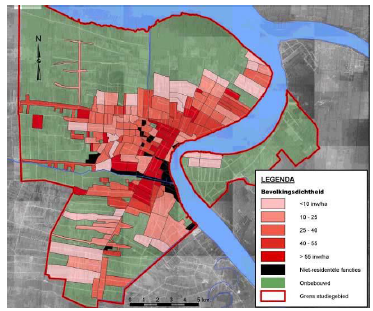
Figure 9: Population density (amount of people per hectare) of the Greater Paramaribo region [84].
Taking into account that the majority of the energy is used in the transportation, residential and industrial sectors, and the latter consists in Suriname of primarily rice cultivation and the petroleum and mining sectors, the sectors chosen will provide a reasonable estimation of countrywide energy efficiency and conservation benefits.
4.4. Top-down analysis
The International energy Efficiency Scorecard is a numerical program from the American Council for an Energy-Efficient Economy (ACEEE) that uses metrics for policy and performance in order to determine the extent an economy uses energy efficiently [85]. The tool has been used in the case of Suriname. The following provides an overview of the parameters that need to be addressed, and how the computations have been done to achieve the input for each of them:
- Total final energy consumption: use the heating values and the total amount of liquid fuels used (minus the amount that is used for energy generation) to get the amount of energy for the transportation sector (other than the EBS, other industries primarily use liquid fuels for the fleet);
- Primary energy consumed: using electricity generating plant efficiencies (typically around 35%), calculate the amount of primary energy (i.e. the fuels that provide the input to the generating plants) used. This is added to the transportation fuels to obtain total primary energy consumption;
- Transportation consumption: see first bullet;
- Residential, Industrial and Commercial and public services consumption: use is made of KEMA [68].
Where the amount of customers for each category is provided. This division of customers categories is assumed the same for 2014, and it is assumed that the amount of energy is split the same way, namely respectively 89.8%, 9.3% and 0.9%;
- GDP from 2000 in current USD is obtained from CBvS;
- Total final energy consumption is obtained by extrapolating data from Appendix C;
- The heat rate for power plants is the reverse of the efficiency factor (assumed to be 35%);
- Distribution losses are obtained from KEMA (2008) [68] and assumed to have stayed constant, namely 8.40%;
- Floor space of residential buildings: the average floor space of a residential building is 100 m2 [86, 87], which is multiplied with the total amount of residential buildings obtained from ABS [75]. The same is done for commercial buildings where the average floor space is 1000 m2 [86];
- It is assumed that the entire year use is made of air conditioning systems because of the tropical climate;
- The GDP of the industrial sector (excluding the agricultural sector) is assumed to consist of primarily gold, oil and bauxite. The rationale behind this is that these sectors are by far the largest in the country. Their contribution to GDP can be obtained from CBvS [88] and is respectively 11.5%, 13% and 3%;
- The share of combined heat and power (CHP) as a percentage of total power generation refers to those electricity generating systems which not only produce electricity but also steam. In Suriname, only the State Oil plants and the Suralco plant at Paranam are CHP units. To obtain the percentage their combined capacity needs to be divided by the total available capacity;
- There is hardly any spending on Research and Development by either research institutes or companies. It is therefore assumed that on an annual basis the spending is around USD 50,000;
- The energy intensity of agriculture is calculated by multiplying the heating value for diesel with the amounts of diesel used in the rice sector, obtained from Ganpat [81]. Though, there are other agricultural subsectors, the rice sector is by far the largest, and actually the only one for which reliable data is available;
- The average vehicle travels around 15,000 km annually [87], which can be converted into average distance per person with the amount of vehicles [16] and population [75]. A similar feat can be done for public transit, which averages 50,000 km per vehicle [87]. The fuel economy of light duty vehicles is assumed to be 29 miles per gallon [83], since the car fleet in Suriname is relatively older than those in Western countries, and there is a mix of European, Japanese, and American cars in use.
Table 1 provides the results obtained from the ACEEE International Energy Efficiency Scorecard Tool. Appendix D provides all the inputs and detailed results, including comparisons with other countries, detailed data per sector, etc.
|
Total Possible Points |
Suriname |
|
|
National Efforts |
25 |
6 |
|
Buildings |
25 |
4 |
|
Industry |
25 |
14 |
|
Transportation |
25 |
3 |
|
Total Score |
100 |
27 |
Table 1: Output for Suriname from the International Energy Efficiency Scorecard Tool.
4.5. Bottom-up analysis
The following subsections provide the bottom-up analysis for several sectors and systems.
4.5.1. Electricity system
4.5.1.1 Street lighting: There are currently approximately 70,000 street lights in Suriname, which in total use 8.5 MW. These lamps are all HPS (high-pressure sodium) lamps [71], which thus each use 8.5 MW / 70,000 = 0.121 kW. Assuming that these lamps need to provide light for 12 hours per day, this implies that all street lights have an annual energy consumption of 0.121*8760*1000 = 37.23 GWh. Switching to LED (Light Emitting Diode) lamps can easily save 50% of this consumption [71, 72, 74], and thus save 18.61 GWh.
Once the switch to LED lamps have been made, operational measures such as “dimming” and “switching” with minimal costs to further reduce energy consumption. “Dimming” is the measure where lights are dimmed if there are no people (with or without vehicles) in the vicinity in order to save energy. “Switching” refers to the measure where each other lamps is switched off if there are no people (with or without vehicles) in the vicinity. “Dimming” and “switching” can save at least respectively 10% and 18% [72-74] which (in the case of fully deployed LED lighting) would amount to 1.86 GWh and 6.70 GWh.
4.5.1.2 Transmission and distribution network: The amount of electricity consumed varies during the day. “Demand flexibility” refers to the phenomenon where (primarily) the utility provides incentives to shift demand [89]. This stimulates consumers to shift their activities in such a way that they make use of the availability of lower prices and shun the use of high-priced electricity, for example by doing the laundry (an energy-intensive activity) during the evening. This is depicted in Figure 10.
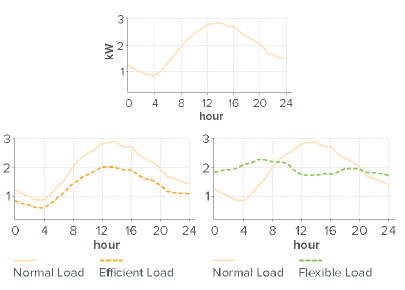
Figure 10: The impact of efficiency and demand flexibility of the daily load curve.
The figure depicts a business-as usual-case, while the second graph in the figure shows movement of the sinusoidal curve in the downward direction energy is used in a more efficient way. The third graph shows how the business-as-usual sinusoidal curve is flattened by shifting a portion of the peak demand to that time of day where demand (in the business-as-usual scenario) used to be low.
In the cases of both efficiency demand flexibility, the peak demand is lowered which implies that the utility company have to have less reserve capacity to meet that peak demand. Since that reserve capacity sits idle for most of the remainder of the day, the life cycle cost of the equipment is high, which explains why the electricity produced with this equipment (which happens during the peak demand period) is high. Initially, it seems that demand flexibility simply shifts demand without actually reducing the amount of energy used. However, the availability of real-time usage and price data triggers reduction of energy use, e.g. by switching of unnecessary lights. The energy savings have been estimated to be between 12 ? 40% [89, 90]. The conservative route is taken, and the lower figure is used for calculations. The total amount of electricity used in 2014 was 1,538 GWh, which means that 0.12*1,538 = 184.5 GWh could be saved with demand flexibility.
The EBS’ transmission and distribution networks have more than 16,000 transformers. Though efficiencies of transformers reach up into more than 80 and even 90%, the fact that they process large amounts of electricity and the fact that there are many transformers in the entire grid, imply that even a small efficiency improvement will save large amounts of electricity. The majority of the transformers within the EBS’ network are relatively old; replacing these with the newest standards for transformers could at least save 4% of energy demand [15, 91]. A typical roll-out would take a couple of years because of the capital involved, so it is advised that demand flexibility is implemented first. Therefore the amount saved with new transformers would be (1,538 GWh ? 184.5 GWh)*0.04 = 54.13 GWh.
4.5.1.3 Generation: The electricity generating plants at State Oil, EBS and Suralco (Paranam location) all use fossil fuels. In the case of Suralco (Paranam location) and State Oil, these fossil fuels are Heavy Fuel Oil (Bunker C type, no. 6) which is produced by the State Oil company. EBS, however, uses a combination of diesel and Heavy Fuel Oil (HFO). In the past they converted a number of their machines from being diesel-fed to HFO-fed, since HFO has a lower cost compared to diesel and HFO machines require less fuel to generate a particular amount of electricity compared to machines which run on diesel. However, there are still 7 combustion engines which run on diesel fuel. Table 2 shows the difference in consumption. Here it is assumed that the average capacity of 1 combustion engine with generator is 8MW (maximum output), which is typical for the machines at EBS [68, 69]. Another assumption is that equipment is not used the entirety of the time; a conservative figure of 60% for utilization is used to account for repair and maintenance and the fact that these equipment are relative expensive generators as opposed to Suralco’s hydroelectric facility which means that they will as far as possible be used to cover peak demand.
|
|
Usage per day |
Annual consumption with 60% utilization (MJ |
||||
|
Fuel Type |
L/KWh |
L/KWW |
L (max output) |
L for all 7 generators |
Fuel energy value (MJ |
|
|
Diesel |
0.28 |
6.72 |
53,760 |
376,320 |
13,964,182 |
3,058,115,749 |
|
HFO |
0.23 |
5.52 |
44,160 |
309,120 |
13,049,995 |
2,857,948,991 |
Table 2: Fuel usage per combustion engine type.
The amount of (primary) energy that can be saved by switching over to HFO fuel equals 200,206,758.5 MJ. The amount of money involved using the same assumptions as stipulated above and assuming a crude oil price of US$ 20 per barrel (1 barrel is 159 L) ? which is lower than the actual cost for diesel or HFO ? is US$ 1,851,169.81 per year. Once again these are conservative estimates, implying that there is more than sufficient rationale to execute the conversion or purchase HFO-fueled equipment, at a cost of roughly US$ 1 million per MW capacity [69].
4.5.2. Industrial sector: The Surinamese economy hinges on the mining, agriculture and services (tourism) sector. The services sector is less energy intensive and figures are not readily available with respect to energy usage in this sector. Therefore, the processes in services sector will not be scrutinized in this research. Agriculture consists of several subsectors, such as rice, banana, vegetables, fisheries, etc. However, only reliable energy data for the rice sectors (which constitutes a large portion within the agriculture sector) is available, implying this particular subsector will be examined.
With respect to mining, there are 3 large industries: gold, alumina and oil. The alumina industry has stopped its production activities as of mid-December 2015. With respect to State Oil, reliable energy input data and / or productivity data could not be obtained; despite many attempts, there was no response to the requests done. The gold industry could be apprehended, though, using publicly available data en benchmarking standards.
A gross estimate of the potential savings has been obtained by simply looking at the energy inputs versus the production outputs and comparing these with benchmark standards in the world. The approach is therefore not as meticulous as done in the case of buildings or the electricity network, i.e. by looking at different parts, elements and processes within the entire system, but still differs from the top-down approach.
4.5.2.1 Rice: The rice sector uses almost exclusively diesel as its energy input. Approximately 125 L/ha is used, which with a diesel heating value of 44.6 MJ/kg, and a density of 836 kg/m3 results in 4.655 GJ/ha. In the U.S., Japan, and Philippines the energy input is 11.251, 4.152, and 0.173 GJ/ha [83]. Both the U.S. and the Philippines are not fit to be used for comparison with the Surinamese rice sector, since they differ in the degree of mechanization. In the U.S., use is made of energy intensive machinery and the sector is heavily subsidized which is counterproductive towards energy saving [83]. In the Philippines, much of the rice cultivation is done by hand and with the use of caribous. Therefore, the figure for Japan will be used as the benchmark for the rice industry. Though the difference seems small (4.655 ? 4.152 = 0.503 GJ/ha), taking into account the amount of land in Suriname that is cultivated in the rice sector, namely 30.400 ha, the amount of savings that can be achieved by adopting Japanese practices, processes, equipment, organization, coordination and procedures equals 15,296.5 GJ.
4.5.2.2 Gold: In gold production, the ore is mined, milled, refined and ultimately smelted into bullions. Typical metrics for energy use here are the amount of energy used per amount of gold produced and the amount of energy used per tonne of ore milled. Such metrics are obtained for many plants and usually plotted in graphs such as the one in Figure 11.
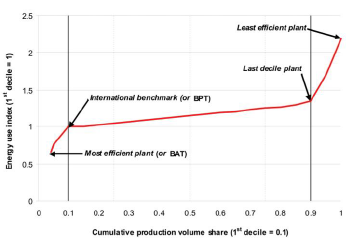
Figure 11: Benchmarking graph for energy efficiency for a hypothetical industry [92].
In the case of the Surinamese gold industry, the energy use is 0.22 GJ/t milled [93, 94]. The benchmark 0.0936 GJ / t milled. The extent to which the benchmark is achievable depends on the age of the plant, the degree of technological sophistication, and the gold availability in the ore. Since the industrial gold industry in Suriname is owned by a multinational with a plant that is relatively new, the benchmark figure will be adopted for the calculations. In 2013, 12 million tonnes of ore were milled [93, 94]. The potential savings therefore is (0.22 ? 0.0936)*12 million = 1.52 million GJ.
4.5.3. Buildings: Though usually a distinction is made between industrial, residential and the transportation sector, this research will go one step further and not just focus on the residential sector, but focus on all buildings. The main focal points here are escape routes for air, appliances and lighting (only the residential sector is taken here into account), boilers and glazing. Measures for energy efficiency associated with these items are fairly easy implemented. However, calculations will be done with respect to building more efficient homes, which can be included in energy consumption growth prognoses. Existing buildings can be retrofitted (e.g. wall insulation), but these are relatively difficult (as opposed to merely replacing windows or appliances), expensive and not always suitable for the manner in which buildings are constructed in Suriname, namely with literally brick and mortar. Therefore, the more intricate, complex, and expensive energy saving measures will be omitted for existing buildings, but will be taken into account for new buildings where the introduction of such measures is easier and far more affordable.
4.5.3.1 Air conditioning: There are a total of 134,329 residential buildings in Suriname, of which 33,743 have an installed and working air conditioning system, which amounts to 33.71% [75]. This percentage will be extrapolated to all buildings; it can be safely assumed that commercial, industrial and public buildings have a higher percentage of buildings equipped with air conditioning system, which means that the outcome of the computations won’t be overstated.
The majority of the electricity produced is used by the residential, commercial, public and industrial sector, thus implying that the total amount using the figures for 2014 electricity production and / or delivery by the Ministry of Natural Resources (DEV) and EBS equals 134.21 ktoe (Appendix C). Applying the same percentage, then the amount of buildings equipped with air conditioning system consume 33.71 ktoe. Approximately 40% of the energy consumption of a building is used for climate control [96]; this means in the case of Suriname, 40% of the energy consumption can be attributed to the use of air conditioning systems (there is no heating of buildings involved because of the local climate). This means that 13.49 ktoe is used for air conditioning systems. This figure will now be used to calculate the opportunity in the case of escape routes for air and glazing.
Using these air conditioning systems in conjunction with so-called smart thermostats can save 0.5% [95], or 0.06745 ktoe. Smart thermostats are able to learn the behaviour and preferences of the residents, and the different settings during the day. Such thermostats can therefore faster anticipate on required drops in air conditioning, can be programmed to achieve a particular energy saving, and even work within the time-of-use pricing concept (e.g. a smart thermostat has the ability to pre-cool a house before the arrival of the resident because the electricity is cheaper at that particular moment).
4.5.3.2 Escape routes for air: Escape routes for air (e.g. small opening under doors, crevices in the roof and walls, etc.) can use up to 25% of the energy used for climate control [83, 96, 97]. In Suriname it is hardly a practice to keep this in mind when constructing a building. Nevertheless, assuming that there is a normal distribution of buildings, ranging from losing 0% to 25% of the energy used for climate control, the average (12.5%) will account for 13.49*0.125 = 1.69 ktoe
4.5.3.3 Glazing: An approach, similar to the one used in the case of escape routes for air, can be applied to glazing. Around 10 to 25% of climate control energy is lost through windows, though this can be brought to a couple of percentage points [96, 97]; assuming the average (17.5%) can be re-engineered to the 5% (e.g. by installing low reflectivity glazing, neoprene glass, double windows, etc.), (0.175-0.05)*13.49 = 1.69 ktoe
4.5.3.4 Lighting: The average home has 10 lamps using 40 watts. It is assumed that all homes use at least compact fluorescent lamps (CFLs) and that no incandescent lamps (most inefficient lamps) are in use, and that not all lamps are powered at the same time (an estimated 50% of the lamps are actually switched on during the day) and that are in use for 4 hours on a daily basis [98] annual consumption in all residential buildings is: 134,329*10*40*4*0.5*365 = 39.22 GWh. A saving of 50% can be achieved when switching over to LED lamps; assuming again that 50% of the residential buildings have highly efficient lighting, the potential savings equal 0.5*0.5*39.22 GWh = 9.81 GWh (0.843 ktoe).
4.5.3.5 Boiler: There are 8657 boilers installed in buildings [75]. However, ABS doesn’t specify which of the boilers are fed with solar radiation and which ones are fed with electricity. Solar boilers have not yet really penetrated the Surinamese market, and it assumed that only 10% of the total amount of boilers is of the solar type. This means that approximately 90%*8657/134329 = 5.80% of all residential buildings have electric boilers. Extrapolating this for all buildings, assuming that electricity usage is evenly distributed over all buildings, and taking into account that electric boilers can account up to 20% of electricity usage (and using the average from a normalized distribution point of view), 5.8%*10%*134.21 ktoe = 0.78 ktoe can be saved if all electric boiler users switch over to solar boilers. An important note here is that this actually doesn’t exactly qualify under energy efficiency or energy conservation; however, whether of renewable energy analyses focus on the entire electricity supply or demand, this concerns a specific appliance, hence it has been taken here separately.
4.5.3.6 Appliances: Table 3 presents an overview of appliances, the amounts present in all residential buildings [80], the minimum and maximum energy use, the average use (assuming a normalized distribution for the different usages across the residential buildings) [76, 77], and the potential savings if either the appliance was eliminated or replaced with a more efficient model. In the case of wash dryers and dish washing machines, these can be considered eligible for complete elimination from the appliance roster, since these are energy intensive appliances [83] while suitable, easily realizable, low-cost and effective alternatives exist; respectively, drying clothes outside through natural convection and radiation and washing the dishes manually. In the case of these two appliances, the minimum amount of energy they consume it taken into account for conservative calculation purposes.
The amount of hours appliances are using is estimated with the help of [99]. The potential saving is obtained by multiplying the mean minus the minimum energy consumption with the hours in use and extrapolating the answer for the entire year. Applying this to all the appliances in the table results in an energy efficiency and conservation savings of 4.39 GWh.
Apart from the electricity that is drawn through regular use, these appliances also draw so-called standby power (i.e. they are not in use, but plugged in and can be switched on at any time, like for instance a television set). Households use approximately 0.75W of standby power per day, but with the appropriate appliance standards this can be reduced with at least 50%. For Suriname, with 140,367 households [75] this amounts to 140367*0.75*0.5*365 = 19.212,337.13 J or 5.34 kWh.
|
Appliance
|
Amount in use |
Energy consumption range (W) |
Average energy consumption range (W) |
Usage (hours per week) |
Energy saving (KWh) |
|
Radio set |
110,331 |
70-400 |
235 |
1 |
745837.56 |
|
Washing machine |
110,821 |
350-500 |
425 |
1 |
432201.9 |
|
Water pump |
50,893 |
250-1,100 |
675 |
0.25 |
1973694.2 |
|
DVD/Blue Ray player |
77,111 |
20-25 |
225 |
3 |
30073.49 |
|
Microwave oven |
67,879 |
750-1,100 |
925 |
0.5 |
308849.45 |
|
Wash dryer |
5,390 |
1,800-5,000 |
1,800 |
1 |
504,504 |
|
Dish washing machine |
2,019 |
1,200-2,400 |
1,200 |
1 |
391,435 |
Table 3: Energy saving per appliance.
4.5.3. Transportation sector
Table 4 provides an overview of the amount of vehicles, the distanced travelled per vehicle type and the total amount of distance covered per category. Other motorized vehicles have been left out of the scope for this research because of there low amount, relative low figure for the annual distance covered, and / or there low impact of energy consumption.
|
Vehicle Type |
Amount |
Avg. annual km driven |
Tot. annual km driven |
|
Passenger car |
144789 |
15,000 |
2,171,835,000 |
|
Truck/lorry |
35350 |
50,000 |
1,727,500,000 |
|
Bus |
3756 |
50,000 |
187,800,000 |
Table 4: Amount of kilometers driven per vehicle type.
Research has shown that through the following measures the amount of travel can be reduced:
- Eco-driving refers to anticipating traffic, traffic lights, speed bumps, roundabouts, crossings, etc. in such a way that minimal braking and accelerating is required. Such driving is able to reduce the fuel consumption equivalent to a reduction of 10 ? 15% of the total kilometres driven [15]. Applying this to the figures of Table 4 (where the total amount of kilometres driven is 4,127,135,000 km) and taking conservative stance, the potential for this behaviour is 412,713,500 km;
- Car-sharing is a scheme involving mobile communication where people offer their own personal car for transportation services of other people (usually within close proximity). This scheme actually results in fewer cars on the road simultaneously equivalent to 15% of the total kilometres driven [15]. In this case of Suriname this would amount to 325,775,250 km;
- Pay-as-you drive insurance can save 8% of the total kilometres driven [15] resulting in 1,737,468 fewer kilometres.
These reductions save 912,235,550 kilometres driven. Using the same fuel usage as in the top-down approaches, namely 29 miles per gallon (which equals 12.76 kilometres per litre), this is the equivalent of 74315740.93 L. Assuming an even split between diesel and gasoline consumption (there is no specific data available on this front) and using respective densities and heating values, 2585786479 MJ can be saved annually.
Another avenue where fuel (and thus energy) can be saved is the reduction of traffic queues. Figure 12 shows the daily amount of vehicles passing specific streets in Paramaribo, while Figure 13 shows the locations with daily traffic congestions. These traffic congestions last about 20 minutes on average [100] and involve about 8% of the daily traffic in that location. Using Figure 12 and overlaying it with the congestions displayed in Figure 13, the most important roads with intense traffic can be identified. Using 8% of the daily vehicle passing on those roads, the amount of vehicles involved in the traffic congestion can be calculated. Assuming that these vehicles are idling, i.e. they’re at a standstill while the engine is running, in combination with the fuel usage in such a mode, the amount of fuel used can be obtained. NEA (2011) has proposed a solution for the traffic congestion by turning certain roads into one-way roads, which would effectively reduce time spent in traffic from 20 to 5 minutes. This would save fuel, and assuming again an even split between diesel and gasoline vehicles, the amount of energy saved can be calculated (as done previously).
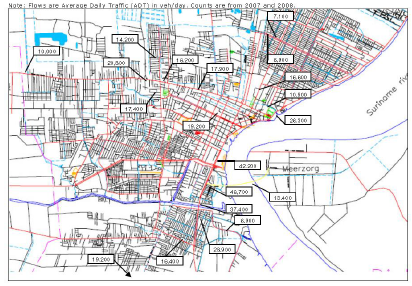
Figure 12: Daily vehicle count in the Greater Paramaribo area [73].
The proposed solutions consist of a number of small changes which are able to improve the traffic flow significantly, thereby reducing energy wasted in traffic lines. The solutions are [73]:
- Some roads will become priority roads with the right-of-way; these roads will be picked based on the condition that they form a mesh with a width of 2 -3 kilometers;
- Priority roads won’t have access to private properties;
- Public transportation is not allowed to stop on priority roads to let in / out passengers;
- Pedestrian crossings will be concentrated and strongly protected (speed bumps, plateaus, traffic lights, barriers, etc.);
- The design speed is increased;
- Parking is made impossible at the priority roads by means of obstacles;
- Intersections are designed to optimize traffic flow;
- Priority roads only connected with other connecting and access roads;
- The inner city of Paramaribo will have a city ring with clockwise one-way traffic (Figure 14);
- Parking on the city ring is prohibited;
Obviously, these aren’t the only proposed solutions, but give a proper overview of the change that is required to optimize traffic flow and thus reduce traffic congestions.
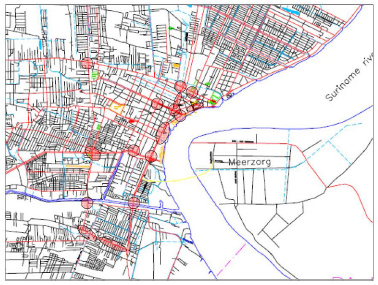
Figure 13: Traffic congestions in the Greater Paramaribo area [73].
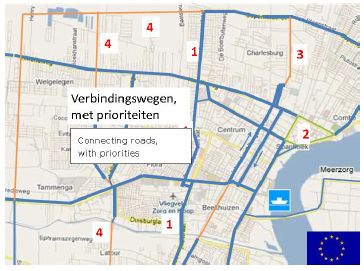
Figure 14: Proposed solution to reduce time in traffic congestions in the Greater Paramaribo area with 75% [73].
It is assumed that the traffic intensities displayed in Figure 12 have grown at the same rate as the amount of vehicles on the road. Hence, using the ratio of the amount of vehicles in 2014 (ABS, 2015) [16] and in 2007 / 2008 (when the data to compile Figure 12 was obtained), which is 1.3, the intensities in Figure 13 have been adjusted. Fuel usage when idling is set at 1.5 L per hour [101], and 5 days per week are taken into account. The number of weeks is set at 40 since on national holidays and during school breaks (totaling around 10 weeks) traffic congestion is significantly reduced and hardly an issue. Table 5 provides the results of the calculations. The amount of fuel reduced due to reduced traffic congestions is 943,800 L; assuming an even split between diesel and gasoline cars, and using the heating values and densities provided in Appendix B, the total energy savings is 32,839,143.48 MJ. Adding this to the previous amount of savings achieved through other measures the total amount of savings identified for the transportation sector stands at 2,618,625,623 MJ.
Road |
2007/2008 |
2015 |
8% |
20 min |
5 min |
|
Kwattaweg/ Kemkampweg |
2080 |
27040 |
2163.2 |
216320 |
54080 |
|
Latour |
16400 |
21320 |
1705.6 |
170560 |
42640 |
|
V't Hogerhuys straat |
46700 |
60710 |
4856.8 |
485680 |
121420 |
|
Henk Arrostraat |
17900 |
23270 |
1861.6 |
186160 |
46540 |
|
Indira Gandhiweg |
19200 |
24960 |
1996.8 |
199680 |
49920 |
|
Total |
|
|
|
1258400 |
314600 |
Table 5: Traffic reduction by implementing proposals from NEA [73].
4.6. Effects on the economy
The following subsections provide the effects of (the transition to) the reduced electricity and fuel consumption on the overall Surinamese economy.
4.6.1. Monetary savings: The amount of diesel saved using to Table 2 (the switch from diesel to HFO at the EBS generation stations) ? taking 60% of the annual difference in fuel consumption ? is 14,716,800 L. The savings in the rice sector also consist of primarily a reduction in diesel consumption. The savings amount is 15,296.5 GJ which equals (using Appendix B) 412,224.58 L. For the transportation sector it is identified that 943800 L + 74315740.93 L = 75,259,540.93 L can be saved. The total amount of fuel that can be saved is 90,388,565.51 L (568,481.54 barrels). Taking the conservative route and using US$ 20 per barrel crude oil, this amounts to US$ 11,369,630.88. The other savings opportunities amount to 269.93 GWh + 5.34 kWh + 1,52 million GJ + 5.07 ktoe. Using appendix A, this equals 269.93 GWh + 5.34 kWh + 422.22 GWh + 63.02 GWh = 755.43 GWh. With a production and transportation cost for electricity of US$ 0.24 / kWh [69], the amount of savings is US$ 182,818,767.20. The total amount of savings is therefore: US$ 11,369,630.88 + US$ 182,818,767.20 = US$ 194,188,398.10.
4.6.2. Job creation: The total electricity savings amount to 755.17 GWh. Converting the savings for the transport and rice sector and the savings from the switch from diesel to HFO (in the EBS generation stations) to GWh (using Appendix B), the figures are respectively 727.40, 4.25, and 55.61 GWh. The total amount of savings is therefore 1542.43 GWh. On average, an investment of US$ 0.021 per kWh is required to achieve energy savings [102]. The amount of expected expenditures for the identified savings in this research is therefore US$ 32.39 million.
A widely agreed upon and frequently used multiplier to identify the amount of jobs that can be created when engaging the transition to a energy efficient economy by implementing identified measures, is 9 people per US$ 1 million investment. These consist of 6.2 direct jobs and 2.3 indirect and induced jobs [63, 64]. With the identified investment of US$ 32.39 million to achieve 1542.43 GWh savings 200 direct and 74 indirect and induced jobs can be created, totalling 274 jobs. The 200 direct jobs are primarily in knowledge-based professions, such as engineers, designers, architects, auditors, policy formulators, project managers, etc.
4.6.3. Export potential: An estimate has been made of the market size in the region when it regards implementation of energy efficiency and conservation. Such as exercise is relevant since it provides export potential for the locally generated workforce resulting from the transition to an economy with low energy intensity. An approximation has been achieved by comparing the energy intensity of regional countries with a benchmark energy intensity figure. The difference is multiplied with the countries’ GDP to ascertain the amount of savings, which with Rumsey [102] can be equated to a particular amount of required investments to achieve those savings. It must be noted here that 1) not all countries within the immediate region have been included in this exercise because of a lack of data, and 2) the results should be approached with caution because of the criticism ousted against the use of energy intensity as a measure for the energy efficiency and conservation potential (see section 4.1). The data has been obtained from IEA [103] and used in Table 6 which also harbours the savings potential per country. As benchmark, the energy intensity figure for the EU-28 has been picked; its energy intensity is 0.10927 toe/000 2005 US$ which is much lower than the U.S., the World, and the OECD countries while its prosperity levels (a term picked loosely here to refer to the combination of HDI, GDP, transparency index, etc.) are regarded as one of the highest in the world.
The total potential market size is US$ 34.84 billion. It must be noted though that the high energy intensities of Trinidad and Tobago (accounting for 12.0% of the total) and Venezuela (accounting for 38.8%) skew the outcome; these two countries have abundant oil and gas reserves and have as a result energy-intensive industries, and subsidized gas and electricity prices which subsequently results in lack of attention to energy reduction measures. Taking these countries therefore out of the equation still results in a market potential of US 21.31 billion (without Venezuela) and US$ 17.21 billion (without Venezuela and Trinidad and Tobago).
|
Country |
GDP |
TPES with benchmark energy intensity |
Current TPES |
Energy Efficiency and Consevation Potential |
Market size/ Investments @ 0.021 US$/kWh |
|
|
|
billion 2005 US$ |
Mtoe |
Mtoe |
Mtoe |
GWh |
US$ |
|
Chili |
165.22 |
18.05432573 |
37.21 |
19.15567 |
222780.5 |
4678390327 |
|
Colombia |
203.27 |
22.21221881 |
31.59 |
9.377781 |
109063.6 |
2290335501 |
|
Costa Rica |
27.47 |
3.001769325 |
4.73 |
1.728231 |
20099.32 |
422085777.8 |
|
Cuba |
56.93 |
6.220994818 |
11.38 |
5.159005 |
59999.23 |
1259983836 |
|
Guatemala |
34.94 |
3.818049516 |
11.07 |
7.25195 |
84340.18 |
1771143867 |
|
Haiti |
4.68 |
0.511404457 |
4.07 |
3.558596 |
41386.47 |
869115789.4 |
|
Honduras |
12.45 |
1.360466986 |
5.08 |
3.719533 |
43258.17 |
908421548.1 |
|
Jamaica |
11.34 |
1.239172339 |
2.81 |
1.570828 |
18268.73 |
383643239.7 |
|
Netherlands Antilles |
2.7 |
0.295041033 |
2.06 |
1.764959 |
20526.47 |
431055928.5 |
|
Nicaragua |
8.09 |
0.884030354 |
3.31 |
2.42597 |
28214.03 |
592494566.5 |
|
Panama |
28.37 |
3.100116336 |
4.15 |
1.049884 |
12210.15 |
256413087.3 |
|
Paraguay |
11.49 |
1.255563507 |
5 |
3.744436 |
43547.8 |
914503724.7 |
|
Peru |
127.56 |
13.93904969 |
21.7 |
7.76095 |
90259.85 |
1895456894 |
|
Trinidad and Tobago |
18.97 |
2.072936443 |
19.23 |
17.15706 |
199536.6 |
4190269633 |
|
Uruguay |
25.46 |
2.782127667 |
4.63 |
1.847872 |
21490.76 |
451305859.9 |
|
Venezuela |
192.07 |
20.98834489 |
76.38 |
55.39166 |
644204.9 |
13528303937 |
Table 6: Potential market size in the region for energy efficiency and conservation.
4.6.4. Reduction of negative externalities: Reduction of fuel for transportation will automatically lead to a decrease in negative externalities *e.g. air pollution, traffic accidents), especially since traffic intensities in urban areas is relatively high [73]. The European Institute for Sustainable Transport [104] has monetized these effects and related them to vehicle-kilometres driven. Using that data and the figures from Table 4, Table 7 can be generated which provides the total amount of externalities associated with the transportation sector.
|
Vehicle Type |
External cost metric |
Total external cost |
|
?/ vehicle |
? |
|
|
Passenger car |
0.081 |
175918635 |
|
Truck/lorry |
0.285 |
492337500 |
|
Bus |
0.285 |
53523000 |
Table 7: External costs associated with the transportation sector.
The reduction potential in the sector consists of 912,235,550 kilometres resulting from several measures, and 943,800 L resulting from reduced traffic congestions. The latter is the equivalent of 11,635,046.71 kilometers, assuming again 29 miles-per-gallon vehicle fuel efficiency. The total amount of kilometers reduced is therefore 923,870,596 kilometers. From Table 6 it can be deduced that there is a split between the amount of kilometers driven between the vehicle categories of 52.62% for passenger cars and 47.38% for lorries / trucks and buses. These percentages are applied to the reduction in kilometers, which yields Table 8.
|
Vehicle Type
|
Share in total km driven |
Reduction |
External cost metric |
Total external cost |
|
% |
km |
?/ vehicle |
? |
|
|
Passenger car |
52.62 |
486,171,277.60 |
0.081 |
39,379,873.49 |
|
Truck/lorry |
47.38 |
427,699,318.40 |
0.285 |
124,744,305.70 |
|
Bus |
Table 8: External costs associated with the transportation sector.
The total reduction in negative externalities as a result of the energy savings (calculated in 4.5.3) in the transportation sector amount to ? 164,124,178. This figure is based on figures coming from the European context. They take into account typical costs for health care, labour, infrastructure, etc. that are applicable over there. Converting this to the Surinamese context by applying the Big Mac Index, which stands at 5.2597 between the Euro and the Surinamese Dollar, yields ? 32,596,120 or US$ 30,250,911 using the formal exchange rate figures.
5. Synthesis: Review of Results
5.1. Summary of results
5.1.1. Energy intensity: Figure 4 depicts a declining energy intensity which at first glance seems favorable. However, when looking at the energy used on a per capita base the regression line in Figure 15 is obtained. It is seen that annual increases in energy use are leveling off, which is likely the result of the production curtailment of the alumina refinery which started in 2009. Due to Suriname’s relative small spread, large industries, such as the alumina, large-scale gold and oil industry (which all happen to be energy intensive) have a significant impact on the country’s energy consumption. Furthermore, the declining trend in Figure 4 is explained by the increases in GDP. Also, notwithstanding the production curtailment in the energy-intensive alumina industry, energy use per capita is still on the rise (though annual increases are declining). Another noteworthy mention is that Suriname’s energy intensity is on par with that of the EU-28 though the latter enjoys more favorable (economic) development indicators. This implies that Suriname is indeed inefficient when it concerns energy use, since it is unable to convert the energy use into similar parameter values; the country has a sub-par performance in this regard.
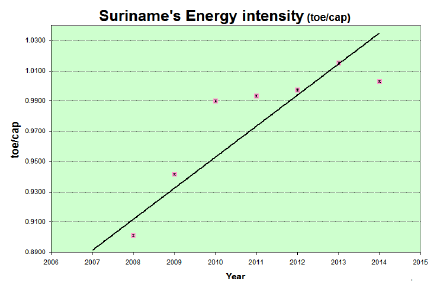
Figure 15: Suriname’s Annual Energy Intensity between 2007 and 2014, calculated on a per capita basis (researcher’s calculation using different sources).
5.1.2. Overview of savings opportunities: The Table 9 below provides an overview of the calculated savings that can be achieved. Figure 16 provides a distinction of the savings potential for electricity and liquid fuels.
|
|
Amount |
Unit |
Amount (GWh) |
Subtotal (GWh) |
Sector total (GWh) |
|
Electricity System |
|
|
|
|
321.41 |
|
Street lights |
|
|
|
27.17 |
|
|
Switch to LED lamps |
18.61 |
GWh |
18.61 |
|
|
|
Dimming |
1.86 |
GWh |
1.86 |
|
|
|
Switching |
6.7 |
GWh |
6.7 |
|
|
|
T&D network |
|
|
|
238.63 |
|
|
Demand flexibility |
184.5 |
GWh |
184.5 |
|
|
|
Improved transformers |
54.13 |
GWh |
54.13 |
55.61 |
|
|
Generation |
|
|
|
|
|
|
Switch to HFO |
200206758.5 |
MJ |
55.61 |
|
|
|
Industrial Sector |
|
|
|
|
426.47 |
|
Rice sector |
15296.5 |
Gj |
4.25 |
|
|
|
Industrial gold sector |
1520000 |
GJ |
422.22 |
|
|
|
Residential Sector |
|
|
|
|
67.41 |
|
Buildings |
|
|
|
53.33 |
|
|
Smart thermostats |
0.06745 |
ktoe |
0.8384035 |
|
|
|
Eliminate escape routes for air |
1.69 |
ktoe |
21.0067 |
|
|
|
Efficient glazing |
1.69 |
ktoe |
21.0067 |
|
|
|
Switch to LED lamps |
0.843 |
ktoe |
10.47849 |
|
|
|
Appliences |
|
|
|
14.08 |
|
|
Switch to solar boilers |
0.78 |
ktoe |
9.6954 |
|
|
|
Efficient radio set |
745837.56 |
kWh |
0.74583756 |
|
|
|
Efficient washing machine |
4322.1.9 |
kWh |
0.4322019 |
|
|
|
Efficient water pump |
1973694.16 |
kWh |
1.97369416 |
|
|
|
Efficient DVD/BlueRay player |
30073.49 |
kWh |
0.30884945 |
|
|
|
Efficient microwave oven |
308849.45 |
kWh |
0.30884945 |
|
|
|
Eliminate wash dryer |
504504 |
kWh |
0.504504 |
|
|
|
Eliminate dish washing machine |
391435.2 |
kWh |
0.3914352 |
|
|
|
Improved stand-by power |
5.34 |
kWh |
0.00000534 |
|
|
|
Transportation Sector |
|
|
|
|
591.96 |
|
Miscellaneous |
|
|
|
582.84 |
|
|
Eco-driving |
1169861214 |
MJ |
324.9614483 |
|
|
|
Car-sharing |
923429520.6 |
MJ |
256.5082002 |
|
|
|
Pay-as-you-drive insurance |
4924957.443 |
MJ |
1.368043734 |
|
|
|
Traffic reduction |
|
|
|
9.12 |
|
|
Optimize traffic flow |
32839143.48 |
MJ |
9.1219843 |
|
|
Table 9: Energy savings potential in different systems / sectors in Suriname.
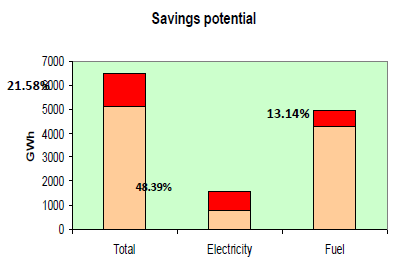
Figure 16: The energy saving potential for electricity and liquid fuels consumption.
The Figure 17 below provides on the left-hand side shows the share of energy saving potential for electricity and liquid fuels. The figure on the right depicts share of savings achieved through efficiency and conservation measures. The conservation measures identified consist of dimming and switching of street lights, the elimination of wash dryers and dish washing machines, and car sharing.
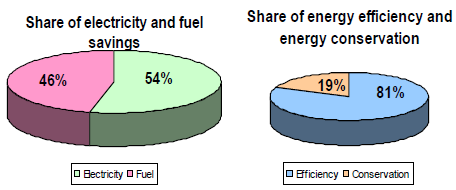
Figure 17: Shares of electricity and fuel consumption savings (left) and the distribution of savings over efficiency and conservation measures (right).
The Figure 18 below shows the distribution of the energy saving potential across the different sectors / systems. It is striking to see that the transportation sector has the largest share in the total amount of savings, even though the savings identified amount to 13.14% of the energy usage in the sector.
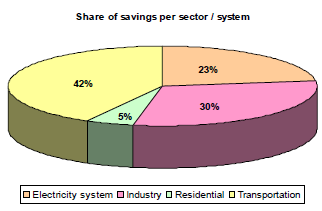
Figure 18: Distribution of energy saving potential per system / sector.
Figure 19 Contribution of each sector / system towards the reduction of energy use in a waterfall chart.
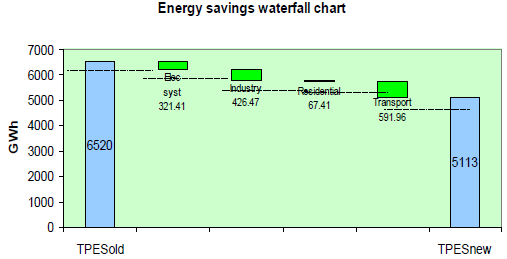
Figure 19: Waterfall chart displaying the savings contribution of the different sectors / systems.
5.2. Comparison of results
The results from the ACEEE’s 2015 International Self-Scoring Tool show that Suriname is the lowest ranking country when it concerns energy efficiency and conservation (Appendix A). However, only a handful of countries have been considered, and none of them have a profile similar to Suriname, which is relatively small-scale and depending on energy intensive extractive industries. However, the result does confirm to some extent the magnitude of the savings that were found using the bottom-up analyses. The transportation sector scored only 3 points which confirms the magnitude of savings found using the bottom-up analysis. On the other hand, the industrial sector scored the highest of all sectors, though the two industries examined in the bottom-up analysis combined showed an energy reduction potential of close to 50%. Also, the building sector scored low, but it appeared in Figure 18 that this sector has a small portion in the total amount of possible savings.
Furthermore, the bottom-up approach enables the determination of effects which are the result of a reduction in energy, such as direct and indirect jobs created, reduction in negative externalities, export potential, etc. The top-down approaches don’t have the ability to do this, nor do they provide the output from which the impact on these aspects can be deduced. The results for these spin-off effects also provide input for policy formulation in all branches of Government, which increases the likelihood of a comprehensive policy encompassing the different Governmental bodies.
5.3. Contribution to gross domestic product
In section 4 it is shown that the money directly saved through reduced energy usage amounts to US$ 194,188,398.10. Indirectly, the reduction of negative externalities is calculated to be US$ 30,250,911. Thus the total amount of annual savings equals US$ 224,439,309.10. On top of that 274 direct, indirect and induced jobs are created which have access to a market size which is worth at least US$ 34 billion. Though the amount of money saved seems paltry compared to GDP (which is more than US$ 5 billion) the savings are relatively a magnitude larger than in the case of the United States. Lovins [15] has shown that the U.S. is able to save 0.83% of their GDP through energy efficiency and conservation. In case of Suriname, this figure is 4.11% and doesn’t take into account fully fledged developed and commercially available efficiency and conservation measures as is done in Lovins [15].
According to Rumsey [102], US$ 0.021 per kWh saved is required for the implementation of efficiency and conservation measures. Multiplying this figure with the total amount of savings of 1407.25 GWh would amount to an investment of US$ 29.55 million. This would be a onetime investment equaling 13% of the savings, i.e. the returns are 759%.
The effects of the services export to the region on the local economy are difficult to determine, because the size of the foreign savings opportunity that can be capitalized upon depends on a myriad of factors (e.g. national policy, climate agreements, oil prices, vested interests). However, the relative size of the Surinamese economy implies that these created jobs in conjunction with the export potential might have a considerable impact on the local economy (Planning Office Suriname, 2016) [105], This could evolve into a strong service-oriented cluster [106, 107].
5.4. Timelines
Figure 20 shows the approximate timeline for each measure to have been completely deployed to full effect. These are based on the adoption curves and market penetration rates obtained from Lovins [15] and Riley et al. [108]. These timelines are aligned with the expected impacts of these measures on GDP growth, energy intensity, energy usage per capita, energy savings investment, and annual savings. The major determinant in this regard is the amount of savings that each measure can generate, from which job creation, negative externalities, investments required, etc. can be deducted (as is done in section 4). These impacted trends are qualitatively also depicted in Figure 20.
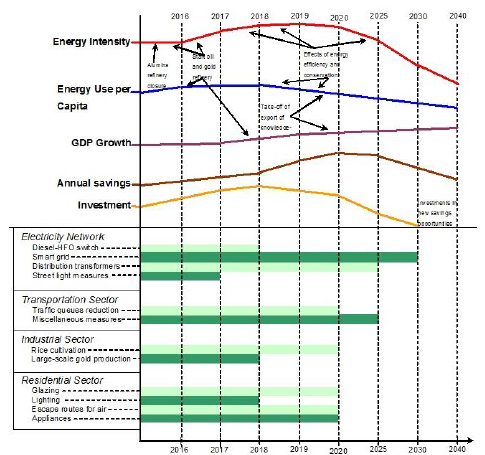
Figure 20: Timelines for the different energy savings measures [15, 108] and the resulting qualitative trends for several macro indicators.
6. Concluding Remarks
Any effort towards countrywide energy efficiency and conservation does not exist in a vacuum. It should be part of an overarching energy policy, which in itself is deduced from the choices made on a strategic level. Currently there is hardly any sound energy strategy and policy. The only goal currently in mind in the so-called energy sector reform (permitting more producing companies, dividing the sector in separate entities, removing most monopolies, etc.). Given the profoundness of changes required and the different sector and consumers affected, it suffices to say that such an approach will hardly reduce the energy input required for services. A drive towards energy reduction should be etched in the overall energy policy and strategy formulation with concrete measures (such as the implementation of time-of-use pricing) and targets.
A coherent policy is a must for the implementation of energy reduction measures, more so than in the case of implementing renewable energy technology, since the latter doesn’t have profound intrusions in all dimensions of the energy system with its producers and consumers. This coherence is especially important when the transition towards an energy-efficient economy is utilized as a stepping stone to create an industry of high-value service providers which are able to access a vast regional market. This coherence encompasses industrial, trade, education, foreign, urban development, environmental, technology and science, and finance (taxation) policy, amongst others.
Energy reduction policies also need to approach efficiency and conservation a holistic viewpoint. A notable example of this is the conception of the urban settlements in Suriname which would result in decreased traffic intensities and a reduction of the heat island effect in Paramaribo. Furthermore, it would transition the country towards a primarily service-based economy from a extractive-based economy, and from decreasing returning industries towards increasing returning industries. The latter would add to the job creation effect of the transition towards an energy-efficient economy [109].
Investing in energy efficiency and conservation measures in a well-thought through, planned and coordinated fashion is able to significantly add to GDP growth. It harbors the possibility to create a knowledge-based industry to can serve the region. As a result, such an investment has the ability to help the transformation of the economy from one that is based on industries with decreasing returns to one with increasing returns.
References
- Chiou-Wei SZ, ?Chenl C, Zhen Z. Economic growth and energy consumption revisited: Evidence from linear and non-linear Granger causality. Energy Economics 30 (2008): 3063-3076.
- Fisher-Vanden K, Jefferson GH, Lui H, et al. What is driving the decline in China’s energy intensity? Resource and Energy Economics 26 (2003): 77-97.
- Wing IS. Explaining the declining energy intensity of the US economy. Resource and Energy Economics 30 (2008): 21-49.
- Unruh GC. Escaping carbon lock-in. Energy Policy 30 (2002): 317-325.
- Smith A, Stirling A, Berkhout F. The governance of sustainable sociotechnical transitions. Research Policy 34 (2005): 1491-1510.
- Raven R. Co-evolution of waste and electricity regimes: Multi-regime dynamics in the Netherlands (1969-2003). Energy Policy 35 (2007): 2197-2208.
- Mulder P, de Groot HLF, Hofkes MW. Explaining slow diffusion of energy-saving technologies; a vintage model with returns to diversity and learning-by-using. Resource and Energy Economics 25 (2003): 105-126.
- Pan H, K?hler J. Technological change in energy systems: learning curves, logistic curves and input-output coefficients. Ecological Economics 63 (2007): 749-758.
- Pack H. Asian Successes vs. Middle Eastern Failures. The Role of Technology Transfer in Economic Development. Issues in Science and Technology (2008): 47-54.
- Weber AS. The role of education in knowledge economies in developing countries. Procedia Social and Behavioral Science 15 (2011): 2589-2594.
- Arthur WB. Increasing Returns and Path Dependence in the Economy. The University of Michigan Press, Michigan (1994).
- Arthur WB. Increasing returns and the world of business. Harvard Business Review July-August (1996): 100-109.
- Jacobson MZ. Review of solutions to global warming, air pollution, and energy security. Energy & Environmental Science 2 (2009): 148-173.
- Lovins A. Efficiency and Micropower for Reliable en Resilient Electricity Service: An Intriguing Case-Study from Cuba. Rocky Mountains Institute, Boulder (2010).
- Lovins A. Reinventing Fire. Bold business solutions for the new energy era. White River Junction: Chelsea Green Publishing (2011).
- ABS Traffic and Transport Statistics. Suriname in cijfers no 317 ? 2015/07. Algemeen Bureau voor de Statitiek, Paramaribo (2015).
- IEA 2014 Key World Energy Statistics. International Energy Agency, Paris (2015).
- Chin A Lin T. Meerjarenontwikkelingsplan 2006 ? 2011. Strategie voor duurzame ontwikkeling. Republiek Suriname. Paramaribo: Regering van de Republiek Suriname (2006).?
- Regering van de Republiek Suriname Ontwikkelingsplan 2012 -2016. Suriname in transformatie. Paramaribo: Regering van de Republiek Suriname (2012).
- Apergis N, Payne JE. The emissions, energy consumption and growth nexus: Evidence from the commonwealth of independent states. Energy Policy 38 (2010): 650-655.
- Kahsai MS, Nondo C, Schaeffer PV, et al. Income level and the energy consumption-GDP nexus: Evidence from Sub-Saharan Africa. Energy Economics 34 (2012): 739-746.
- Narayan PK, Popp S. The energy consumption-real GDP nexus revisited: Empirical evidence from 93 countries. Economic Modeling 29 (2012): 303-308.
- Smil V. Energy in the Twentieth Century: Resources, Conversions, Costs, Uses, and Consequences. Annual Review of Energy and Environment 25 (2000): 21-51.
- Crabtree G, Kocs E, Al?an T. Energy, society and science: The fifty year scenario. Futures 58 (2014): 53-65.
- Steckel JC, Brecha RJ, Jakob M, et al. ?Development without energy? Assessing future scenarios of energy consumption in developing countries. Ecological Economics 90 (2013): 53-67.
- Duncan RC. The Olduvai Theory. Energy, Population, and Industrial Civilization. The Social Contract, Winter 2005-2006 (2005): 1-12.
- Alam MJ, Begum IA, Buysse J, et al. ?Energy consumption, carbon emissions and economic growth nexus in Bangladesh: Cointegration and dynamic causality analysis. Energy Policy 45 (2012): 217-225.
- Chang C, Carballo CFS. Energy conservation and economic growth: The case of Latin America and the Caribbean. Energy Policy 39 (2011): 4215-4221.
- Duro JA, Padilla A. Inequality across countries in energy intensities: An analysis of energy transformation and final energy consumption. Energy Economics 33 (2011): 474-479.
- Dagher L, Yacoubian T. The causal relationship between energy consumption and economic growth in Lebanon. Energy Policy 50 (2012): 795-801.
- Yildirim E, Sukruoglu D, Aslan A. Energy consumption and economic growth in the next 11 countries: The bootstrapped autoregressive metric causality approach. Energy Economics 44 (2014): 14-21.
- Ozturk I. A literature survey on energy-growth nexus. Energy Policy 38 (2010): 340-349.
- Chen P, Chen S, Chen C. Energy consumption and economic growth: New evidence from meta-analysis. Energy Policy 44 (2012): 245-255
- Beaudreau BC. On the methodology of energy-GDP Granger causality tests. Energy 35 (2010): 3535-3539.
- Kalimeris P, Bithas K. Growth and natural resources: A meta-analysis to the Energy-GDP causality and energy scarcity dialogue. Challenges and Contributions for a Green Economy (2012).
- Apergis N, Tang CF. Is the energy-led growth hypothesis valid? New evidence from a sample of 85 countries. Energy Economics 38 (2013): 24-31.
- van Ruijven B, Urban F, Benders RMJ, et al. Modeling Energy and Development: An Evaluation of Models and Concepts. World Development 36 (2009): 2801-2821.
- Bhattacharyya SC, Timilsina GR. Modeling energy demand of developing countries: Are the specific features adequately captured? Energy Policy 38 (2010): 1979-1990.
- Urban F, Benders RMJ, Moll HC. Modeling energy system for developing countries. Energy Policy 35 (2007): 3473-3482.
- Wolde-Rufael Y. Energy consumption and economic growth:: the experience of African countries, revisited. Energy Economics 31 (2009): 217-224.
- Sovacool BK. Rejecting renewables: The socio-technical impediments to renewable electricity in the United States. Energy Policy 37 (2009): 4500-4513.
- Franssen M, Kroes P. Sociotechnical Systems. A Companion to the Philosophy of Technology, Berg Olsen J. K., Pedersen S. A., Hendricks V. F. (eds.), Wiley-Blackwell, Oxford (2009): 223-226.
- Kiss B, Neij L. The important of learning when supporting emergent technologies for energy efficiency ? A case study on policy intervention for learning for the development of energy efficient windows in Sweden. Energy Policy 39 (2011): 6514-6524.
- Furtado AT, Scandiffio MIG, Cortez LAB. The Brazilian sugarcane innovation system. Energy Policy 39 (2011): 156-166.
- Bointner R. Innovation in the energy sector: Lessons learnt from R&D expenditures and patents in selected IEA countries. Energy Policy 73 (2014): 733-747.
- Marra M. Knowledge partnerships for development: what challenges for evaluation? Evaluation and Program Planning 27 (2004): 151-160.
- Bouncken RB, Kraus S. Innovation in knowledge-intensive industries ? The double-edged sword of coopetition. Journal of Business research 66 (2013): 2060-2070.
- Sabau GL. Know, live, and let line: towards a redefinition of the knowledge-based economy ? sustainable development nexus. Ecological Economics 69 (2011): 1193-1201.
- Sabau G. Societatea cunoasterii. O perspectiva romaneasca. Editura Economica, Bucarest (2001).
- Miketa A, Schrattenholzer L. Experiments with a methodology to model the role of R&D expenditures in energy technology learning processes; first results. Energy Policy 32 (2004): 1679-1692.
- Klaassen G, Miketa A, Larsen K, et al. The impact of R&D on innovation for wind energy in Denmark, Germany and the United Kingdom. Ecology Economics 54 (2005): 227-240.
- Kobos PH, Erickson JD, Drennen TE. Technological learning and renewable energy costs: implications for US renewable energy policy. Energy Policy 34 (2006): 1645-1658.
- Dulleck U, Foster N. Imported Equipment, Human Capital, and Economic Growth in Developing Countries. Economic Analysis and Policy 38 (2008).
- Weiss M, Patel MK, Junginger M, et al. Analyzing price and efficiency dynamics of large appliances with the experience curve approach. Energy Policy 38 (2010): 770-783.
- Lee L, Lee Y, Altschuld JW, et al. Energy literacy: Evaluating knowledge, affect, and behavior of students in Taiwan. Energy Policy 76 (2015): 98-106.
- Mooney A. Core Competence, Distinctive Competence, and Competitive Advantage: What is the Difference? Journal of Education for Business November/December (2007): 110-115.
- M?kinen SJ, Kanniainen J, Dedehayir O. Adoption dynamics of increasing-returns technologies in systemic contexts. Technological Forecasting & Social Change 80 (2013): 1140-1146.
- Scazzieri R. A structural theory of increasing returns. Structural Change and Economic Dynamics 29 (2014): 75-88.
- den Hartigh E, Langerak F. Managing Increasing Returns. European Management Journal 19 (2001): 370-378.
- Arthur WB. Self-reinforcing mechanisms in economics. In The Economy as an Evolving Complex System, eds Ph.W. Anderson, K.J. Arrow and D. Pines, Addison-Wesley, Redwood City, CA. (1988): 9-31.
- Glazer R. Marketing in an information-intensive environment: strategic implications of knowledge as an asset. Journal of Marketing 55 (1991): 1-19.
- Mathews JA, Reinert AS. Renewable, manufacturing and green growth: Energy strategies based on capturing increasing returns. Futures 61 (2014): 13-22.
- ACEEE Energy Efficiency Program Job Creation Metric Review. American Council for an Energy-Efficient Economy, Washington D.C (2015).
- Bell CJ, Barrett J, McNerney M. Verifying Energy Efficiency Job Creation: Current Practices and Recommendations. Report F1501, American Council for an Energy-Efficient Economy, Washington D.C. (2015).
- Lehr U, Nitsch J, Kratzat M, et al. Renewable energy and employment in Germany. Energy Policy 36 (2008): 108-117.
- Wei M, Patadia S, Kammen DM. Putting renewables and energy efficiency to work: How many jobs can the clean energy industry create in the US? Energy Policy 38 (2010): 919-931.
- Lehr U, Lutz C, Edler D. Green jobs? Economic impacts of renewable energy in Germany. Energy Policy 47 (2012): 358-364.
- KEMA. Suriname Power Sector Assessment and Alternatives for its Modernization. Preliminary Assessment Report. Final Version, Ministry of Natural Resources of Suriname, Paramaribo (2008).
- Badal A. De Waarde van Energie. A Royant / EBS Production, Paramaribo (2014).
- NEA Suriname: institutional strengthening of the transport sector. Traffic Management in Paramaribo. NEA Transport research and training, Paramaribo (2010).
- Vermeulen A. Energie besparen met LED-lampen. Suri-light, Paramaribo (2014).
- SEAI. Energy efficiency & public lighting overview report. Ref: 432-X0005, Sustainable Energy Authority of Ireland, Dublin (2011).
- G?mez-Lorente D, Rabazza O, Esp?n-Estrella A, et al. A new methodology for calculating roadway lighting design based on a multi-objective evolutionary algorithm. Expert Systems with Application 40 (2013): 2156-2164.
- GSEP. Powering innovation for a sustainable future. An Electric Industry’s Perspective. Global Sustainable Electricity Partnership (2014).
- ABS. Resultaten. Achtste (8e) Volks- en Woningtelling in Suriname (Volume III). Huishoudens, woonverblijven en Gezinnen, Milieu, Criminaliteit. Algemeen Bureau voor de Statitiek, Paramaribo (2014).
- Lu W. Potential energy savings and environmental impact by implementing energy efficiency standard for refrigerators in China. Energy Policy 34 (2006): 1583-1589.
- Mackay DJ. Sustainable Energy - Without the Hot Air. UIT Campbridge Ltd., Cambridge (2009).
- World Bank. GDP at market prices (current US$) (2015).
- IMF. Suriname. 2014 Article IV Consultation ? Staff Report; Press Release; And Statement By The Authorities Of Suriname. IMF Country Report No. 14/316, International Monetary Fund, Washington D.C. (2014).
- ABS. Milieu Statistieken. Suriname in Cijfers 309-2014 / 10. Algemeen Bureau voor de Statitiek, Paramaribo (2014).
- Ganpat R. Personal interview conducted on 3 December 2015, Ministry of Finance, Paramaribo (2015).
- Biharisingh R. Monthly Energy Report 2015. Suralco, Paranam Operations, District Para (2015).
- Pimentel D, Pimentel MH. Food, Energy and Society. Third edition, CRC Press, Taylor and Francis Group, LLC, New York (2008).
- Blufpand YF. Paramaribo op orde. Structuurvisie Groot-Paramaribo 2020. M.Sc.-thesis report, Technical University Delft, Delft (2006).
- Young R, Hayes S, Kelly M, et al. The 2014 International Energy Efficiency Scorecard. Report Number E1402, The American Council for an Energy-Efficient Economy, Washington D.C. (2014).
- del Prado B. Personal interview conducted on 24 December 2015. Sunecon, Paramaribo (2015).
- Ferrier DJH. Personal Interview conducted on 12 December 2015. Centre for Economic and Social Scientific Research, Paramaribo (2015).
- CBvS Leading Sectors of Suriname: The Impact of Agriculture, Mining and Tourism Activities on the Economy 1970-2012. Centrale Bank van Suriname, Paramaribo (2014).
- RMI. The Economics of Demand Flexibility. How “Flexiwatts” create quantifiable value for customers and the grid. Rocky Mountains Institute, Boulder (2015).
- DOE. The Smart Grid: An Estimation of the Energy and CO2 Benefits. U.S. Department of Energy, Oak Ridge (2010).
- ABB. Energy Efficiency in the Power Grid. ABB, Norwalk (2007).
- UNIDO. Global Industrial Energy Efficiency Benchmarking. An Energy Policy Tool. United Nations Industrial Development Organization (2010).
- IAMGOLD. IAMGOLD Investor Presentation. (2015).
- Letwin SJJ. Changing the Game. (2015).
- Nadel S. Smart thermostat initiatives reveal new exciting new horizons for energy efficiency programs. (2015).
- DOE. Energy Savers booklet. Tips on Saving energy & Money at Home. U.S. Department of Energy, Washington D.C. (2008).
- Energy Center. Energy Management Handbook for Homeowners. Missouri Department of Natural Resources (2006).
- DNV KEMA. Residential Lighting End-Use Consumption Study: Estimation Frameworks and Initial Estimates. U.S. Department of Energy, Washington D.C (2012).
- RMI. Building and Climbing the Solar Energy Ladder (2015).
- Kishoenmisier S. Personal Interview, conducted on 6 January 2016. University of Suriname, Civil Engineering discipline (2016).
- Sperling D, Gordon D. Two Billion Cars. Driving toward sustainability. Oxford university press, New York (2009).
- Rumsey P. In an Age of Cheap Solar Does Efficiency Still Matter? (2015).
- IEA. Redrawing the Energy-Climate Map. World Energy Outlook Special Report. International Energy Agency, Paris (2014).
- European Institute for Sustainable Transport. Achieving sustainability in urban transport in developping and transition countries. Federal Environment Agency, Dessau-Ro?lau (2011).
- Planning Office Suriname. Update technische baseline Surya model januari 2016. (2016).
- S?lvell ?, Lindqvist G, Ketels C. The Cluster Initiative Greenbook. Ivory Tower AB, Stockholm (2003).
- Ffowcs-Williams I. Cluster Development Manual. Building competitiveness through smart specialization. Cluster Navigators Ltd., Nelson (2012).
- Riley J, Hulme J. Characterisation of dwellings in the UK ? determining the potential for enhanced energy efficiency. Presentation held at TABULA European Building Typologies on 29 February 2012, BRE (2012).
- Lachman DA, Panday MRJ, Ferrier DJH. Context-driven Transition Management as a necessary Vehicle for sustainable urban futures in Suriname. In: Co-Creating Sustainable Urban Futures. A primer on applying transition management in cities. Eds.: Frantzeskaki N, H?lscher K, Bach M, et al. Springer, Dordrecht (2016).
Citation: Daniel A. Lachman. Re-Energizing Suriname with Less Energy. Journal of Environmental Science and Public Health 2 (2018): 77-95.
