Microalbuminuria in Type 2 Diabetes Mellitus and Glycemic Control
Article Information
Asad Ullah1, Rozi Khan2, Jaffar Khan3, Muhammad Saleem Panezai4, Asad Khan Kakar5, Muhammad Samsoor Zarak5*
1Department of Pathology, Medical College of Georgia at Augusta University, Georgia, USA
2Department of Medicine, Medstar Union Memorial Hospital, Baltimore, Maryland, USA
3Department of Pathology, Indiana University, Indiana, USA
4Pak Emirates Military Hospital, Rawalpindi, Pakistan
5Bolan Medical College, Quetta, Pakistan
*Corresponding Author: Dr. Muhammad Samsoor Zarak, Bolan Medical College, Quetta, Pakistan
Received: 18 March 2020; Accepted: 30 March 2020; Published: 31 March 2020
Citation: Asad Ullah, Rozi Khan, Jaffar Khan, Muhammad Saleem Panezai, Asad Khan Kakar, Muhammad Samsoor Zarak. Microalbuminuria in Type 2 Diabetes Mellitus and Glycemic Control. Archives of Nephrology and Urology 3 (2020): 005-016.
Share at FacebookAbstract
Objective: To determine the frequency of microalbuminuria in Type 2 Diabetes Mellitus with good glycemic control.
Introduction: Diabetes Mellitus is a chronic illness, frequently not diagnosed until complications appear. Microalbuminuria is a renal marker of generalized vascular endothelial damage and early atherosclerosis. Patients with microalbuminuria are at increased risk of microvascular and macrovascular complications of Diabetes Mellitus like myocardial infarction, stroke, and nephropathy. Poor glycemic control increases the risk of microalbuminuria.
Methodology: A cross-sectional study is conducted at the Department of Medicine, Bolan Medical College/ Sandeman Provincial Hospital Quetta, Pakistan. The duration of the study is six months from September 2016 to March 2017. A total of 140 Type 2 DM patients with good glycemic control is included in this study. 63 (45%) were female, and 77 (55%) were male with a mean age of 44.47 ± 4.99 years. The mean duration of DM is found to be 4.21 ± 0.94 years. The mean HbA1c level was found to be 6.74 ± 0.17. 21 patients (15%) were found to have microalbuminuria.
Conclusion: There is an association of microalbuminuria in diabetic patients with good glycemic control; however, the prevalence is low, but it is still positive. Uncontrolled DM is strongly associated with the prevalence of microalbuminuria. Screening for microalbuminuria and HbA1c test should be done both in new and already diagnosed type 2 diabetic patients as an early marker of renal dysfunction and glycemic control.
Keywords
Microalbuminuria; Type 2 Diabetes Mellitus; Glycemic control
Microalbuminuria articles, Type 2 Diabetes Mellitus articles, Glycemic control articles
Microalbuminuria articles Microalbuminuria Research articles Microalbuminuria review articles Microalbuminuria PubMed articles Microalbuminuria PubMed Central articles Microalbuminuria 2023 articles Microalbuminuria 2024 articles Microalbuminuria Scopus articles Microalbuminuria impact factor journals Microalbuminuria Scopus journals Microalbuminuria PubMed journals Microalbuminuria medical journals Microalbuminuria free journals Microalbuminuria best journals Microalbuminuria top journals Microalbuminuria free medical journals Microalbuminuria famous journals Microalbuminuria Google Scholar indexed journals Type 2 Diabetes Mellitus articles Type 2 Diabetes Mellitus Research articles Type 2 Diabetes Mellitus review articles Type 2 Diabetes Mellitus PubMed articles Type 2 Diabetes Mellitus PubMed Central articles Type 2 Diabetes Mellitus 2023 articles Type 2 Diabetes Mellitus 2024 articles Type 2 Diabetes Mellitus Scopus articles Type 2 Diabetes Mellitus impact factor journals Type 2 Diabetes Mellitus Scopus journals Type 2 Diabetes Mellitus PubMed journals Type 2 Diabetes Mellitus medical journals Type 2 Diabetes Mellitus free journals Type 2 Diabetes Mellitus best journals Type 2 Diabetes Mellitus top journals Type 2 Diabetes Mellitus free medical journals Type 2 Diabetes Mellitus famous journals Type 2 Diabetes Mellitus Google Scholar indexed journals Glycemic control articles Glycemic control Research articles Glycemic control review articles Glycemic control PubMed articles Glycemic control PubMed Central articles Glycemic control 2023 articles Glycemic control 2024 articles Glycemic control Scopus articles Glycemic control impact factor journals Glycemic control Scopus journals Glycemic control PubMed journals Glycemic control medical journals Glycemic control free journals Glycemic control best journals Glycemic control top journals Glycemic control free medical journals Glycemic control famous journals Glycemic control Google Scholar indexed journals nephropathy articles nephropathy Research articles nephropathy review articles nephropathy PubMed articles nephropathy PubMed Central articles nephropathy 2023 articles nephropathy 2024 articles nephropathy Scopus articles nephropathy impact factor journals nephropathy Scopus journals nephropathy PubMed journals nephropathy medical journals nephropathy free journals nephropathy best journals nephropathy top journals nephropathy free medical journals nephropathy famous journals nephropathy Google Scholar indexed journals Mellitus articles Mellitus Research articles Mellitus review articles Mellitus PubMed articles Mellitus PubMed Central articles Mellitus 2023 articles Mellitus 2024 articles Mellitus Scopus articles Mellitus impact factor journals Mellitus Scopus journals Mellitus PubMed journals Mellitus medical journals Mellitus free journals Mellitus best journals Mellitus top journals Mellitus free medical journals Mellitus famous journals Mellitus Google Scholar indexed journals Diabetic Nephropathy articles Diabetic Nephropathy Research articles Diabetic Nephropathy review articles Diabetic Nephropathy PubMed articles Diabetic Nephropathy PubMed Central articles Diabetic Nephropathy 2023 articles Diabetic Nephropathy 2024 articles Diabetic Nephropathy Scopus articles Diabetic Nephropathy impact factor journals Diabetic Nephropathy Scopus journals Diabetic Nephropathy PubMed journals Diabetic Nephropathy medical journals Diabetic Nephropathy free journals Diabetic Nephropathy best journals Diabetic Nephropathy top journals Diabetic Nephropathy free medical journals Diabetic Nephropathy famous journals Diabetic Nephropathy Google Scholar indexed journals High-Performance Liquid Chromatography articles High-Performance Liquid Chromatography Research articles High-Performance Liquid Chromatography review articles High-Performance Liquid Chromatography PubMed articles High-Performance Liquid Chromatography PubMed Central articles High-Performance Liquid Chromatography 2023 articles High-Performance Liquid Chromatography 2024 articles High-Performance Liquid Chromatography Scopus articles High-Performance Liquid Chromatography impact factor journals High-Performance Liquid Chromatography Scopus journals High-Performance Liquid Chromatography PubMed journals High-Performance Liquid Chromatography medical journals High-Performance Liquid Chromatography free journals High-Performance Liquid Chromatography best journals High-Performance Liquid Chromatography top journals High-Performance Liquid Chromatography free medical journals High-Performance Liquid Chromatography famous journals High-Performance Liquid Chromatography Google Scholar indexed journals ethylene diamine tetraacetic acid ( articles ethylene diamine tetraacetic acid ( Research articles ethylene diamine tetraacetic acid ( review articles ethylene diamine tetraacetic acid ( PubMed articles ethylene diamine tetraacetic acid ( PubMed Central articles ethylene diamine tetraacetic acid ( 2023 articles ethylene diamine tetraacetic acid ( 2024 articles ethylene diamine tetraacetic acid ( Scopus articles ethylene diamine tetraacetic acid ( impact factor journals ethylene diamine tetraacetic acid ( Scopus journals ethylene diamine tetraacetic acid ( PubMed journals ethylene diamine tetraacetic acid ( medical journals ethylene diamine tetraacetic acid ( free journals ethylene diamine tetraacetic acid ( best journals ethylene diamine tetraacetic acid ( top journals ethylene diamine tetraacetic acid ( free medical journals ethylene diamine tetraacetic acid ( famous journals ethylene diamine tetraacetic acid ( Google Scholar indexed journals Diabetes Mellitus articles Diabetes Mellitus Research articles Diabetes Mellitus review articles Diabetes Mellitus PubMed articles Diabetes Mellitus PubMed Central articles Diabetes Mellitus 2023 articles Diabetes Mellitus 2024 articles Diabetes Mellitus Scopus articles Diabetes Mellitus impact factor journals Diabetes Mellitus Scopus journals Diabetes Mellitus PubMed journals Diabetes Mellitus medical journals Diabetes Mellitus free journals Diabetes Mellitus best journals Diabetes Mellitus top journals Diabetes Mellitus free medical journals Diabetes Mellitus famous journals Diabetes Mellitus Google Scholar indexed journals
Article Details
1. Introduction
Diabetes Mellitus (DM) is a chronic illness characterized by hyperglycemia, insulin resistance, or relative insulin deficiency [1]. DM is a worldwide public health problem and puts a substantial burden on health care resources. The prevalence of diabetes for all age-groups worldwide was estimated to be 2.8% in 2000 and 4.4% in 2030. The total number of people with diabetes is projected to rise from 171 million in 2000 to 366 million in 2030. The urban population in developing countries is projected to double between 2000 and 2030 [2]. DM is a significant problem in Pakistan, having a prevalence of ranging from 3-14%, which varies in the Urban and Rural areas [3]. The screening for DM type 2 may either be in the form of a 2-hour oral glucose tolerance test or via HbA1c testing, as per the recommendations of the American Diabetes Association (ADA) [1].
Type 2 DM (formerly known as non-insulin dependent DM) is the most common form of DM, and its prevalence is continuously increasing [4]. People having type 2 DM are more vulnerable to various forms of both short- and long-term complications, which often lead to their premature death. The chronic hyperglycemia of DM type 2 is associated with end-organ damage, dysfunction, and failure, including the retina, kidney, nervous system, heart, and blood vessels [1]. This tendency of increased morbidity and mortality is seen because of its insidious onset and late recognition [4]. Diabetic Nephropathy (DN) is the leading cause of premature deaths in diabetic patients due to renal failure [5]. Older age, male gender, long duration of DM, smoking, obesity, and elevated blood pressure are risk factors. Mortality due to kidney failure in a diabetic patient is 20-40 times more than those without DM. An early sign of impending nephropathy is microalbuminuria (MA). The study shows that the overall prevalence of microalbuminuria was 29.5% [6]. Diabetic patients with poor glycemic control and good glycemic control have the frequency of microalbuminuria of 35.9% and 10%, respectively. A study done in Pakistan shows a prevalence of microalbuminuria 72.72% in patients with type 2 DM [7]. To prevent acute complications and to reduce the risk of long-term complications, to continue medical care, and to educate patients for self-management is needed [4].
Since no such study had been done in Balochistan to assess the frequency of microalbuminuria in DM 2 patients in association with good glycemic control, therefore, it will be a novel study in the area mentioned above.
2. Methodology
A cross-sectional study is conducted at the Department of Medicine, Sandeman Provincial hospital Quetta Pakistan. The duration of the study was from 25th Sept 2016 to 25th Mar 2017. A sample size of a total of 140 patients of type 2 DM was selected with a 95% confidence interval. Diabetic patients (Type 2 DM) with good glycemic control, with either gender having age in the range of 30 -50 years, were enrolled in the study. Patients with Urinary Tract Infection, previous cardiac disease, Hypertension, Hematuria, any Urinary tract tumor, or had plasma creatinine of >1.2 mg/dl were excluded from the study.
A total of 140 patients fulfilling selection criteria was included by their consent in the study. Venous blood was collected after 12 hours of fasting in a test tube with ethylene diamine tetraacetic acid (EDTA) anticoagulant for HbA1c. 24-hour urine was collected for the estimation of MA. HbA1c is estimated by boronate affinity chromatography via High-Performance Liquid Chromatography (HPLC), which separately totals glycated hemoglobin by binding to solid-phase dehydroxylation using Nycocard immunoassay kit (USA). After the exclusion of infection and hematuria, urine samples were examined for microalbuminuria. Urinary albumin was measured with an autoanalyzer (analyzer medical system, Italy) using Randox kits (urinary albumin measured with the immunoturbidimetry method, United Kingdom). A second 24-hour urine sample was obtained and examined for microalbuminuria if the first measurement exceeded 30 mg of albumin. The diagnosis of microalbuminuria was confirmed when >30 mg/dl albumin was found in the second sample. 24-hours urinary albumin concentration of <30 mg were considered as normal (Normoalbuminuria), 30-300 mg as microalbuminuria and > 300 mg as microalbuminuria (Overt proteinuria).
Data were analyzed using SPSS version 20.
3. Results
A total of 140 patients having Type 2 DM were included in the study. Mean, and the standard deviation was computed for quantitative variables like age, duration of type II DM, HbA1c level. Frequency and percentages were calculated for qualitative variables like gender, microalbuminuria. Effect modifier like age, gender, and duration of DM was controlled through stratifications. Post-stratification Chi-square test was applied to see the effect of these on outcomes (i.e., microalbuminuria) by taking P-Value ≤0.05 was considered significant.
The mean age of patients is 44.47 ± 4.99 years. The distribution of age is presented in Graph 2. The descriptive statistics of age are presented in Table 1. The age was stratified into two groups. The frequency and percentages are presented in Graph 3. 63 (45%) were female, and 77 (55%) were male, as mentioned in Graph 1. The mean duration of DM was found to be 4.21 ± 0.94 years. The distribution of the duration of DM is presented in Graph 4. The descriptive statistics of the duration of dyspepsia are presented in Table 2. The duration of DM was stratified into two groups. The frequency and percentages are presented in Graph 5.
The mean HbA1c level was found to be 6.74 ± 0.17. The distribution of the HbA1c level is presented in Graph 6. The descriptive statistics of HbA1c is presented in Table 3. The HbA1c level was stratified into two groups. The frequency and percentages are presented in Graph 7. 21 (15%) type 2 DM patients with good glycemic control were found to have microalbuminuria. The frequency distribution of microalbuminuria is presented in Table 4.
The frequencies of age groups, gender were calculated according to the duration of DM. The results are presented in Table 5 and Table 6, respectively. The frequencies of age groups, gender, and duration of DM were calculated according to the HbA1c level. The results are presented in Table 7 and Table 8 and Table 9, respectively. The frequencies of age groups, gender, duration of DM, HbA1c were calculated according to microalbuminuria. The results are presented in Table 10, Table 11, Table 12, and Table 13, respectively. The stratification according to age, gender duration of DM, HbA1c was done to observe the effect of these modifiers on microalbuminuria.
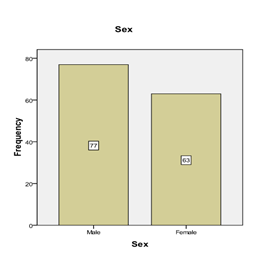
Graph 1: Frequency distribution of gender.
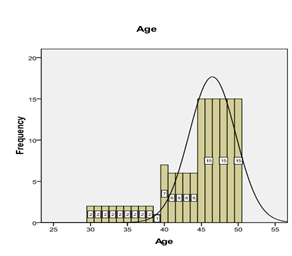
Graph 2: Frequency distribution of age.
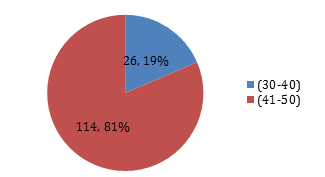
Graph 3: Percentage of patients according to age groups.
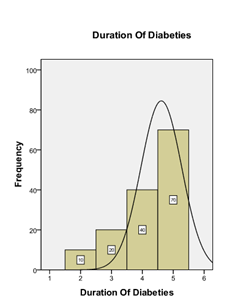
Graph 4: Frequency distribution of duration of DM.
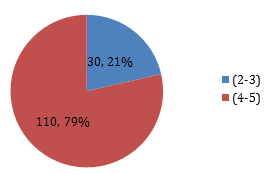
Graph 5: Percentage of patients according to the duration of Diabetes groups.
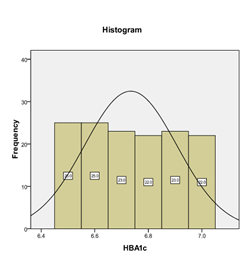
Graph 6: Frequency distribution of HbA1c.
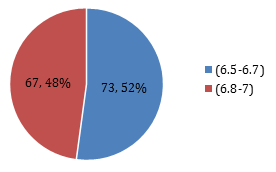
Graph 7: Percentage of patients according to HBA1c.
|
Mean ± SD |
44.47 ± 4.99 |
|
95%CI (LB – UB) |
43.63 -45.30 |
|
Median (IQR) |
46 (45) |
|
Range |
20 |
|
Minimum |
30 |
|
Maximum |
50 |
Table 1: Descriptive statistics of age Years) (n=140).
|
Mean ± SD |
4.21 ± 0.94 |
|
95% C.I. (LB – UB) |
4.05-4.37 |
|
Median (IQR) |
4.5 (5) |
|
Range |
3 |
|
Minimum |
2 |
|
Maximum |
5 |
Table 2: Descriptive statistics of the duration of DM (years) (n=140).
|
Mean ± SD |
6.74 ± 0.17 |
|
95%CI (LB – UB) |
7.71-6.77 |
|
Median (IQR) |
6.7 (6.5) |
|
Range |
0.5 |
|
Minimum |
6.5 |
|
Maximum |
7 |
Table 3: Descriptive statistics of HbA1C (n=140).
|
Microalbuminuria |
Frequency n=(140) |
Percentage (%) |
|
NO |
119 |
85% |
|
Yes |
21 |
15% |
|
Total |
140 |
100% |
Table 4: Frequency of distribution of Microalbuminuria. (n=140).
|
Age |
Duration of DM |
Total |
P-value |
|
30-40 |
2-3 (0) 4-5(26) |
26 |
0.042 |
|
41-50 |
2-3(30) 4-5(84) |
114 |
|
|
Total |
140 |
140 |
Chi-Square test was applied. P-value ≤ 0.05 is considered as significant, therefore the results were statistically significant.
Table 5: Duration of DM according to age. (n=140).
|
Gender |
Duration of DM |
Total |
P- Value |
|
Male |
2-3 (20) 4-5(57) |
77 |
0.000 |
|
Female |
2-3(10) 4-5(53) |
63 |
|
|
Total |
140 |
140 |
A Chi-Square test was applied. P-value ≤ 0.05 considered significant; hence the results are statistically significant.
Table 6: Duration of DM according to gender (n=140).
|
Age |
HbA1c |
Total |
P-value |
|
30-40 Years |
6.5-6.7(14) 6.8-7(12) |
26 |
***1.000 |
|
41-50 Years |
6.5-6.7(59) 6.8-7(55) |
114 |
|
|
Total |
140 |
140 |
A Chi-Square test was applied. For statistically significant, the P-value ≤ 0.05, therefore, the results of this table were not significant.
Table 7: HbA1c, according to age (n=140).
|
Gender |
HbA1c |
Total |
P-value |
|
Male |
6.5-6.7(40) 6.8-7(37) |
77 |
***0.347 |
|
Female |
6.5-6.7(33) 6.8-7(30) |
63 |
|
|
Total |
140 |
140 |
Chi-Square test was run on the above table. The results are not statistically significant since the P-value is not ≤ 0.05.
Table 8: HbA1c, according to gender. (n=140).
|
Duration |
HbA1c |
Total |
P-value |
|
2-3 Years |
6.5-6.7(14) 6.8-7(16) |
30 |
***1.000 |
|
4-5 Years |
6.5-6.7(59) 6.8-7(51) |
110 |
|
|
Total |
140 |
140 |
A Chi-Square test was run, and the results were not statistically significant as the P-value is not ≤ 0.05.
Table 9: HBA1c, according to the duration of DM. (n=140).
|
Age |
Microalbuminuria |
P-value |
||
|
No (n =119) |
Yes (n=21) |
Total |
||
|
30-40 Years |
22 |
4 |
26 |
0.000 |
|
44-50 Years |
97 |
17 |
114 |
|
|
Total |
119 |
21 |
140 |
|
A Chi-Square test was applied where the results were statistically significant in the above table.
Table 10: Microalbuminuria according to age. (n=140).
|
Gender |
Microalbuminuria |
P-value |
||
|
No (n =119) |
Yes (n=21) |
Total |
||
|
Male |
64 |
13 |
77 |
0.426 |
|
Female |
55 |
8 |
63 |
|
|
Total |
119 |
21 |
140 |
|
A Chi-Square test was applied. The results were not statistically significant as P –value was not ≤ 0.05.
Table 11: Microalbuminuria according to gender (n=140).
|
Duration of DM |
Microalbuminuria |
P-value |
||
|
No (n =119) |
Yes (n=21) |
Total |
||
|
2-3 Years |
23 |
7 |
30 |
0.000 |
|
4-5 Years |
96 |
14 |
110 |
|
|
Total |
119 |
21 |
140 |
|
A Chi-Square test was applied. But the results turn out to be statistically significant as the P-value was ≤ 0.05.
Table 12: Microalbuminuria according to the duration of DM. (n=140).
|
HbA1c |
Microalbuminuria |
P-value |
||
|
No (n =119) |
Yes (n=21) |
Total |
||
|
6.5-6.7 |
73 |
0 |
73 |
0.000 |
|
6.8-7 |
46 |
21 |
67 |
|
|
Total |
119 |
21 |
140 |
|
A Chi-Square test was applied. The results were statistically significant as the P-value was ≤ 0.05.
Table 13: Microalbuminuria according to HbA1c (n=140).
4. Discussion
DM is a global health problem. The majority of patients are in the young or middle age group [2]. The prevalence of DM is high in Pakistan, ranging from 3-14%, which varies in the Urban and Rural areas and is a major health problem in Pakistan [8]. Microalbuminuria, which is an early marker of diabetic nephropathy, may be present at diagnosis of type 2 DM. It progresses to overt nephropathy and eventually leads to a decline in glomerular filtration rate and, ultimately, to end-stage renal disease or premature cardiovascular mortality [9]. The frequency of microalbuminuria in our study in type 2 DM with good glycemic control was 15% as compared to the frequency of Microalbuminuria in Khan et al. study was 29.5% [7]. Similar results have also been shown by other studies with slight variations in the frequency of microalbuminuria ranging from 24-34% [10]. This slight variation in the frequency may be due to different factors like the variation in the definition of DM, stage of the disease, method of assessment, and ethnic susceptibility to develop nephropathy. Another finding in Khan et al., the study was that females were major sufferers with 23 cases while males were 13 [7]. Female dominance has also been noted by other studies. A high frequency of DM was found in patients between 40–50 years of age. Similar results were also reported by another study.
According to Yokoyama et al., the nation-wide large-population study revealed that the prevalence of microalbuminuria in Japanese type 2 diabetic patients was 32% [11]. The DEMAND (Developing Education on Microalbuminuria for Awareness of Renal and Cardiovascular Risk in DM) study stated that the overall global prevalence of microalbuminuria among 24, 151 patients with type 2 DM was 39% [12] and the Microalbuminuria Prevalence (MAP) study reported the prevalence at 40% among 5, 549 Asian patients [13]. These findings indicate that microalbuminuria is common. The study of Yokoyama et al. is the second-largest study in terms of the number of subjects investigated and achieved high data availability, with 60% of multiple quantitative measurements for United Arab Emirates (UAE), while other large-population studies performed single measurements by dipstick with 20–40% of data-missing rates for A1C and blood pressure levels [11-13].
Increased level of microalbuminuria is associated with an increased rate of progression of kidney damage, ultimately leading to end-stage renal disease. Microalbuminuria also increases cardiovascular morbidity and mortality [14]; therefore, screening of people with type 2 diabetes for microalbuminuria should begin at the time of diagnosis to retard the progression and perhaps a reversion to normal albumin at an early stage of the disease. Once sustained microalbuminuria develops, then urinary albumin excretion rate increases by 10-20% per year to overt nephropathy over 10-15 years. The rate of fall of glomerular filtration rate in patients of DM with overt nephropathy in type 2 DM is variable ranging from 2–20 ml/min/year [15]. Therapeutic and non-therapeutic intervention can reverse the process at this stage, but if untreated, then it will lead to end-stage renal disease and cardiovascular mortality. During the first five years of DM, microalbuminuria rarely found suggesting that it is a marker of early glomerular damage. The duration of DM is an important factor that strongly correlates with the increased frequency of microalbuminuria. Khan et al., studied 31 diabetic patients having microalbuminuria even when the duration of DM was less than 11 years. These are the patients who can benefit from the screening program for microalbuminuria to prevent or delay nephropathy as well as other complications. The results of Khan et al. study have shown a positive correlation between the duration of DM and the frequency of microalbuminuria [7]. A significant correlation between microalbuminuria and duration of DM had also been shown by other studies [16].
Early detection of diabetic nephropathy is essential so that strategies could be made to prevent progression to end-stage renal disease. HbA1c, which is a measure of erythrocyte hemoglobin glycation and reflects mean glycemic value for the previous three recent months [17]: has also been measured in this study. The results of Khan et al. study have shown a positive correlation between microalbuminuria and glycemic control as shown by the high frequency of microalbuminuria (33%) in poor glycemic control (HbA1c >7) group as compared to only 10% of microalbuminuria in good glycemic control (HbA1c <7) group [7]. A significant correlation between microalbuminuria and glycemic control has also been shown by other studies [16, 17]. Good glycemic control (HbA1c <7) reduces both the incidence and progression of microalbuminuria. Early diagnosis and treatment of Diabetic patients aiming for good glycemic control will prevent the development of nephropathy and could also produce financial saving as well as better patient outcomes [18].
5. Conclusion
There is an association of microalbuminuria in diabetic patients with good glycemic control; however, the prevalence is low, but it is still positive. Uncontrolled DM is strongly associated with the prevalence of microalbuminuria. Screening for microalbuminuria and HbA1c test should be done both in new and already diagnosed type 2 diabetic patients as an early marker of renal dysfunction and glycemic control.
Ethics and Consent
Institutional Review board allowed for the project, and informed consent was taken from each participant.
Acknowledgments
The team acknowledges the assistance of the hospital's administration.
Funding Information
There is no source of funding; the project has been run on its own.
Competing Interests
There are no competing interests.
Authors Contribution
All authors contributed to designing the project, Data collection, and interpretation, literature review, and gave the final evaluation.
References
- Alam U, Asghar O, Azmi S, et al. General aspects of diabetes mellitus. In Handbook of clinical neurology 126 (2014): 211-222).
- Wild S, Roglic G, Green A, et al. Global prevalence of diabetes: estimates for the year 2000 and projections for 2030. Diabetes care 27 (2004): 1047-1053.
- Shaukat A, Arian TM, Shahid A. Microalbuminuria: Incidence in patience of diabetes at Bhawalpur. Pak J Pathol 16 (2005): 17-21.
- Olokoba AB, Obateru OA, Olokoba LB. Type 2 diabetes mellitus: a review of current trends. Oman medical journal 27 (2012): 269.
- Coonrod BA, Ellis D, Becker DJ, et al. Predictors of microalbuminuria in individuals with IDDM: Pittsburgh Epidemiology of Diabetes Complications Study. Diabetes care 16 (1993): 1376-1383.
- Pan CY, Ho LT, Soegondo S, et al. Prevalence of albuminuria and cardiovascular risk profile in a referred cohort of patients with type 2 diabetes: an Asian perspective. Diabetes technology and therapeutics 10 (2008): 397-403.
- Khan P, Khan M, Ahmad A, et al. Relationship of glycemic control with the prevalence of microalbuminuria in diabetic patients. Gomal Journal of Medical Sciences 10 (2012).
- Shera AS, Jawad F, Maqsood A. Prevalence of diabetes in Pakistan. Diabetes research and clinical practice 76 (2007): 219-222.
- Diabetic Nephropathy. Diabetes Care 26 (2003): S94-S98.
- Gerstein HC, Mann JF, Pogue J, et al. Prevalence and determinants of microalbuminuria in high-risk diabetic and nondiabetic patients in the Heart Outcomes Prevention Evaluation Study. Diabetes care 23 (2000): B35-B35.
- Yokoyama H, Kawai K, Kobayashi M. Microalbuminuria is common in Japanese type 2 diabetic patients: a nationwide survey from the Japan Diabetes Clinical Data Management Study Group (JDDM 10). Diabetes care 30 (2007): 989-992.
- Parving HH, Lewis JB, Ravid M, et al. Prevalence and risk factors for microalbuminuria in a referred cohort of type II diabetic patients: a global perspective. Kidney international 69 (2006): 2057-2063.
- Wu AYT, Kong NCT, De Leon FA, et al. An alarmingly high prevalence of diabetic nephropathy in Asian type 2 diabetic patients: the MicroAlbuminuria Prevalence (MAP) Study. Diabetologia 48 (2005): 17-26.
- Young BA, Katon WJ, Von Korff M, et al. Racial and ethnic differences in microalbuminuria prevalence in a diabetes population: the pathways study. Journal of the American Society of Nephrology 16 (2005): 219-228.
- Sheikh SA, Baig JA, Iqbal T, et al. Prevalence of microalbuminuria with relation to glycemic control in type-2 diabetic patients in Karachi. Journal of Ayub Medical College Abbottabad 21 (2009): 83-86.
- Saudek CD, Kalyani RR, Derr RL. Assessment of Glycemia in Diabetes Mellitus: Hemoglobin A. JAPI (2005): 53.
- Jerums G, Maclsaac RJ. Treatment of microalbuminuria in patients with type 2 diabetes mellitus. Treatments in endocrinology 1 (2002): 163-173.
- Vora JP, Ibrahim HAA, Bakris GL. Responding to the challenge of diabetic nephropathy: the historic evolution of detection, prevention and management. Journal of human hypertension 14 (2000): 667.
