Machine Learning Analysis of Virus based on Transmission Electron Microscopy Images: Application to SARS-CoV-2
Article Information
Y Dabiri1, 2, and GS Kassab2, *
13DT Holdings LLC, San Diego, CA 92121, USA
2California Medical Innovations Institute, San Diego, CA 92121, USA
*Corresponding author: GS Kassab, California Medical Innovations Institute, San Diego, CA 92121, USA
Received: 16 October 2023 Accepted: 26 October 2023 Published: 10 November 2023
Citation: Y Dabiri, and GS Kassab. Machine Learning Analysis of Virus based on Transmission Electron Microscopy Images: Application to SARSCoV- 2. Archives of Microbiology and Immunology. 7 (2023): 281-289.
Share at FacebookAbstract
The goal of this paper was to develop a machine learning (ML) platform for categorization of viruses using transmission electron microscopy (TEM) images. More efficient pathogenesis, treatment and vaccine development strategies become possible once the virus family is identified. We used three deep learning (DL) pretrained models namely AlexNet, VGG16 and SquezzeNet. The classifier portion of the models was modified and trained for the available virus dataset. We used 20% of the images (320) for testing the DL models. The dataset included TEM images from 16 virus families including novel corona virus (SARS-CoV-2). We also used two unsupervised methods to analyze image clusters: principal component analysis (PCA) and t-distributed stochastic neighbor embedding (t-SNE). The results from PCA and t-SNE were visualized based on two components. The AlexNet, VGG16 and SqueezeNet models were able to predict the categorization of test images with accuracy 77.8±4.5%, 75.3±4.7% and 77.8±4.5%, respectively. The receiver operating characteristic (ROC) curves had area under curve (AUC) greater than 0.9. Our PCA and t-STE results suggested SARS-CoV-2 is closest to Influenza family of viruses. Using DL models, TEM images can be classified into virus families. This ML approach may lead to more accurate and faster virus TEM image classification tools, which is particularly important for pandemic situations such as with the current SARS-CoV-2 crisis.
Keywords
Deep Learning, Transfer Learning, Computer Vision, Pandemic, Corona
Deep Learning articles, Transfer Learning articles, Computer Vision articles, Pandemic articles, Corona articles
Article Details
1. Introduction
Currently, the world is fighting against novel coronavirus disease (Covid-19) pandemic caused by the novel corona virus (SARS-CoV-2). This pandemic has paralyzed economy, social activities, recreational activities, and many aspects of human life. Many people have died and there is an estimation of large number of deaths in the coming months. As of today (30 April 2020), there are 1,069,826 confirmed cases of SARS-CoV-2 patients, in the US alone, and 3,257,520 confirmed cases worldwide; and there are 63,006 deaths in US alone, and 233,416 deaths worldwide [1]. This pandemic will continue to take lives, if not treated. Research centers are racing against time to find a solution for this deadly virus in susceptible patients.
One important tool to study a virus is transmission electron microscopy (TEM) which has been reported for “diagnostic modality” of all type of viruses [2], and “catch all method” in virology for identifying all pathogens [3]. A virus TEM image includes the nucleocapsid of the virus, the envelop, and the envelop proteins. The nucleocapsid contains the virus genetic material; the envelop is a membrane that encloses the nucleocapsid; and the envelop proteins are projections outside the envelop. These projections are used for virus identification [4]. Classification of viruses is based on size and shape, chemical composition and structure of the genome, and mode of replication [5]. TEM images are also used to categorize viruses based on morphological patterns [3]. In fact, the morphological pattern is a powerful criterion to categorize viruses [3]. For example, Marburg appears shorter than Ebola virus with spikes different in shape [4]. Although these two criteria are not sufficient to distinguish the two viruses, virus texture has been reported to do so [6]. Since images obtained from TEM include all pathogens in the sample scanned including viruses and debris [4, 7], analysis of TEM images requires high level of expertise to decipher and interpret [8]. TEM images are low-resolution, need expertise, and their analysis is time-consuming [8]. Manual analysis of TEM images is prone to error. Human analysis can fail to detect a virus particle, and the virus specifications may not be detected thoroughly. On the other hand, a non-virus particle can be mistakenly categorized as virus, or a virus may be mistakenly categorized into a non-virus family. This false positive and false negative diagnosis may put high burden on the subject as he/she will spend time and money to visit clinicians and even undertake costly/harmful interventions/medication. Also, false positive and false negative may mislead scientist for developing solutions for novel viruses including the novel corona virus.
Although machine learning (ML) has been extensively used for classification of images, there are few studies that used ML to analyze TEM virus images [4, 7]. In particular, in many applications deep learning (DL) has been used to classify images. DL has been successfully used for computer vision applications in self-driving cars [9] and medical imaging [10] such as diabetic retinopathy [11], mammography [12] and other applications. There are large DL models that have been trained using large image sets, and they can be modified to categorize new images. This approach, known as transfer learning, is particularly important when the available dataset is limited [13]. The pretrained models eliminate the time required to train large DL models, which is important given the long runtime and hardware limitations for training these models.
The goals of this project were two folds. First, to develop a classifier for a dataset of viruses that includes SARS-CoV-2, based on TEM images using pre-trained DL models. To the best of our knowledge, pretrained DL models have not been used for classification of TEM virus images. Second, we aimed to analyze virus TEM images by feature reduction methods namely principal component analysis (PCA) and a relatively new technique, t-distributed stochastic neighbor embedding (t-SNE) [14]. For classification of TEM images, we use three pretrained models including VGG [15], AlexNet [16] and SqueezeNet [17]. We will compare SARS-CoV-2 with other viruses based on the available 15 virus families.
2. Methods
We used a dataset including negative staining TEM images from 15 virus types available from Center for Image Analysis, Uppsala University [6]. We also used TEM images from SARS-CoV-2 available from National Institute of Allergy and Infectious Diseases Rocky Mountain Laboratories (NIAID-RML) [18]; created 25 images from this resource, and using image augmentation methods, generated 100 images (rotation, flip and noise). The 15 virus families include: Adenovirus, Astrovirus, Crimean-Congo hemorrhagic fever (CCHF), Cowpox, Dengue, Ebola, Influenza, Lassa, Marburg, Norovirus, Norovirus, Orf, Papilloma, Rift Valley, Rotavirus, West Nile. In total there were 1,600 images. All images were processed to have the same mode (grey scale) and size (41´41). We used Python to develop models. DL computations were performed on Google Collaboratory GPU processors whereas PCA and t-SNE computations were performed on CPU processors.
2.1 ML models
We used VGG [15], AlexNet [16] and SqueezeNet [18] models to classify virus TEM images, and compare SARS-CoV-2 based on available classified TEM images. All images were standardized based on each model requirements (PyTorch documentation [19] ). Each of these models has two parts. One part basically learns the features in an image database, and the other part, classifies and learns the classification of images for a new dataset. Both parts can be trained for a new dataset, depending on the application specifications and new datasets. In our implementations, only the classifier part of the model was trained using the available virus datasets, and the pre-trained weights for the feature extraction part of the model. We used negative log likelihood loss (NLLoss) and Adam optimizer for the DL models (PyTorch documentation [19]).
AlexNet [16] is composed of 2-dimensional convolutional layers (Conv2d), max-pooling (MaxPool), rectification (ReLU) non-linearity. The outputs of the pretrained network were 9,216 features. We modified the classifier network composed of a fully connected (FC) layer following a ReLU layer, a FC layer and a logarithmic softmax layer. The classification network input layer had 512 neurons, and the last layer corresponded to 16 virus images in the dataset. The feature extraction part weights were from the pretrained model based on ImageNet dataset [20]. The classifier was trained using the virus dataset. There are different versions of VGG families [15]. The feature recognition part of the model is from the pretrained model wrights using ImageNet dataset [20]. In this project, we used VGG16 (PyTorch documentation [15, 19]). The feature recognition part of this model is composed of Conv2d, MaxPool, and ReLU layers. The 25,088 outputs form the first part were connected to 4,096 neurons in the input of the second part, the classifier. We modified the classifier to have FC layers, ReLU and logarithmic softmax layers (one FC layer followed by ReLU, followed by a FC layer followed by a softmax layer). The final softmax layer corresponded to 16 virus family TEM images. In the feature learning part, SqueezeNet is composed of Conv2d, MaxPool and ReLU layers. The classifier part of the model is composed of Conv2d, ReLU and adaptive average pooing. We also added a logarithmic softmax layer for inference purposes. Number of output classes were adjusted to match 16 virus types in the dataset which was connected to 512 channels from previous layer using a conv2d operator.
2.2 PCA and t-SNE
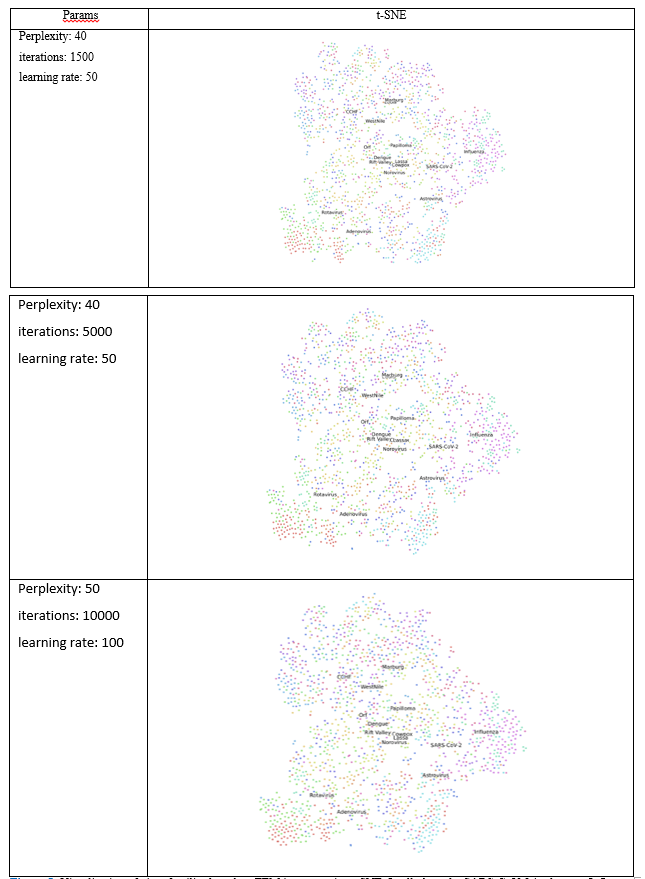
We used PCA and t-SNE to assess the clustering of viruses based on the TEM images. For this purpose, we used PCA class in sklearn library [21]. This feature reduction method finds the orthogonal components of maximum variance in the data [22]. This method is used in this paper to visualize different virus types based on TEM images. We use the pixel values of images as the features of each image. The top PCs and the variance ration by each PC were computed. To visualize image proximity, we used the top two principal components (PCs) that were associated with the largest variability in images. The images were transformed into directions of the PCs, and the results were plotted. We also used t-SNE to visualize the clustering of images [14]. This method aims to map the images into two dimensions in such a way that it preserves proximity of points [23]. In regard to manifest algorithms, number of nearest points can be adjusted using a parameter called “perplexity” [23]. Also, number of iterations and learning rate can be adjusted. We tried different numbers as indicated in Table (1).
Table 1: Parameters used in t-SNE in sklearn
|
Perplexity |
Number of iterations |
Learning rate |
|
30 |
1000 |
10 |
|
40 |
5000 |
50 |
|
50 |
10000 |
100 |
2.3 Statistical Analysis
To assess the performance of each DL model, confusion matrix and Receiver Operating Characteristic (ROC) curve were used. The ROC curve was created by two parameters as follows [24]:
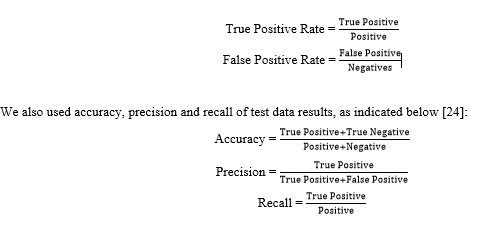
To determine the performance of our DL models for a TEM virus image population, we computed the confidence interval (CI) of the accuracy provided by each model with 95% probability. For this purpose, we used the equation below [25]:

where is the accuracy of DL models for TEM images population, is the DL accuracy for the test images sample considered in our study, and is sample number which is equal to 320 in our study. It should be noted that the term population here refers to the population of virus families considered in this the present study.
3. Results
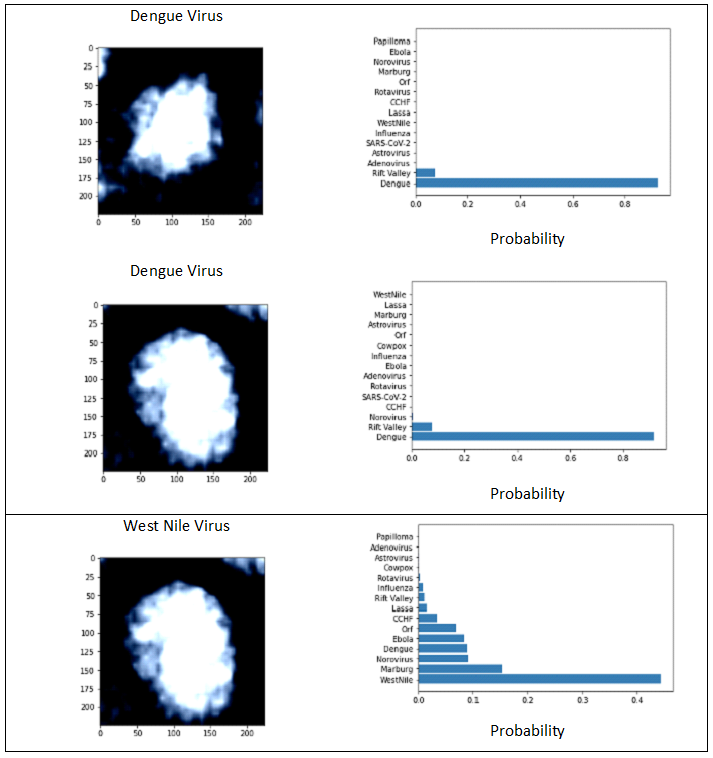
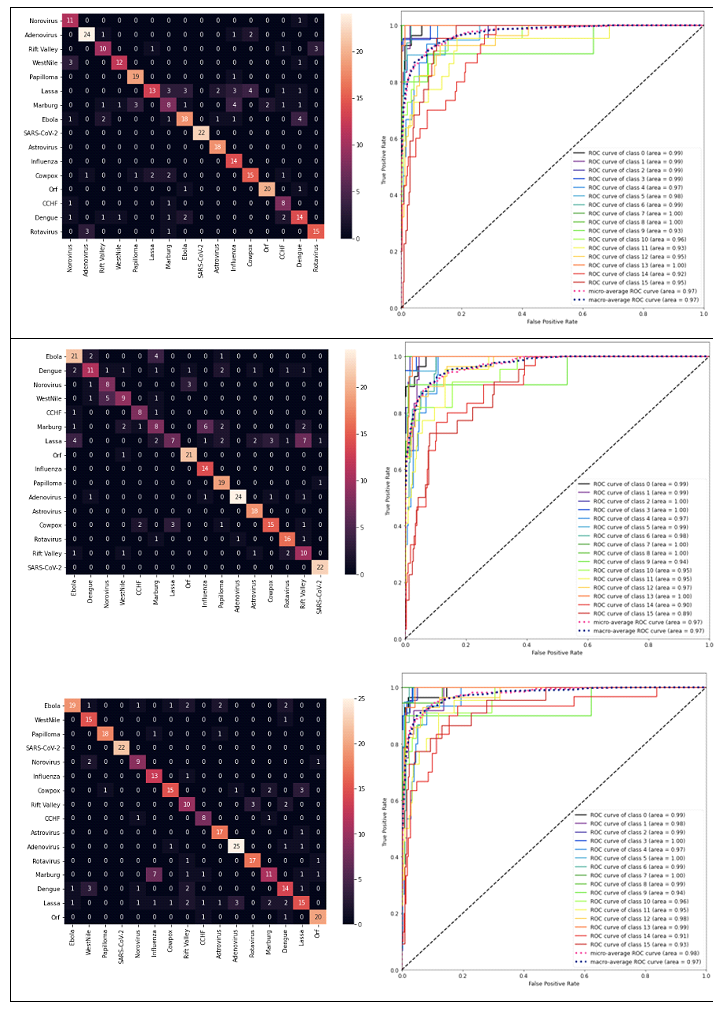
DL models produced results for the 16 virus types (Figs. 1 and 3), for which the performance was evaluated by test set results, confusion matrix and ROC curve. The training loss consistently decreased as number of epochs increased whereas, generally, test loss initially decreased but then increased. The results were used for the epoch where test loss was minimized (Fig. 2). The prediction accuracy by all models was larger than 0.7 (for the 2000 epochs considered). The confusion matrixes showed relatively high values of correct predictions for each virus family. The ROC curve for all DL models showed area under curve (AUC) larger than 0.9 for all virus families (Fig. 3). The Squeeze Net provided highest accuracy (Table 2). When randomly selected test images were fed into the DL models, they provided correct predictions with relatively high probabilities (Fig. 1). For example, we input one image from West Nile group to the SqueezeNet model. The model predicted that the image belongs to West Nile group with a probability greater than other families (Fig. 1).
|
Dengue Virus |
Probability |
|
Dengue Virus |
Probability |
|
West Nile Virus |
Probability |
For all viruses, confusion matrixes were visualized with heat maps (Fig. 3). The prediction performance for the SARS-CoV-2 image was better than other virus families for AlexNet and SqueezeNet. Although there were virus families from 15 other groups that were misclassified as a SARS-CoV-2 virus, all SARS-CoV-2 viruses were correctly identified (confusion matrixes in Fig. 3, AlexNet and SqueezeNet). The AlexNet and SqueezeNet models false positive (misclassification of a virus as SARS-CoV-2) and false negative (misclassification of a SARS-CoV-2 to another virus family) were both 0. The VGG model false positive and false negative were 2 and 0, respectively. The SqueezeNet model false positive and false negative were both 0. In terms of precision and recall, AlexNet and SqueezeNet both had precision = 1 and recall = 1. For VGG, precision and recall were 1, and 0.92, respectively. For all models and virus families, the AUC was greater than 0.9 for all models (Fig. 3).
Table 2: Training and test loss and accuracy (based on test data) for classification of 16 virus families using TEM images.
|
Classification Algorithm |
Accuracy (%) |
95% CI |
|
AlexNet |
77.8 |
±4.5% |
|
VGG16 |
75.3 |
±4.7% |
|
SqueezNet |
77.8 |
±4.5% |
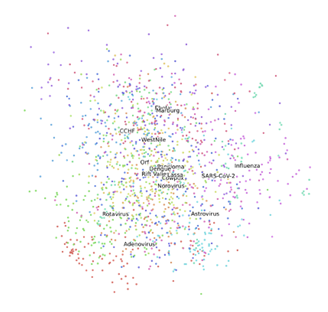
According to PCA analysis, the first 5 PCs contributed to 68.2% of total variance. The ratios of variance provided by the first 5 PCs were as follows: 24.7%, 14.3%, 11.5%, 10.9%, 4.1%. With using only two PCs, the SARS-CoV-2 was relatively closer to Influenza than other virus families (Fig. 4). Moreover, among the other 15 viruses, it was noticed that some virus families were relatively closer to others. For example, Marburg and Ebola were closer to each other than other virus families (Fig. 4).
Figure 3: The heat map and ROC for prediction by AlexNet (top), VGG (middle) and SqueezeNet (bottom). The AUC was larger than 0.9 for all cases. For the heat maps, the vertical and horizontal axes are actual and predicted values. The dashed diagonal line shows the random guess [24]. The class numbers are related to virus names as follows: Adenovirus: 0, Norovirus: 1, Orf: 2, Papilloma: 3, Rift Valley: 4, Rotavirus: 5, West Nile: 6, SARS-CoV-2: 7, Astrovirus: 8, CCHF: 9, Cowpox: 10, Dengue: 11, Ebola: 12, Influenza: 13, Lassa: 14, Marburg: 15, SARS-CoV-2: 16.
The results from t-SNE analysis did not noticeably change after the parameters were altered (Table 1, Fig. 5). The results from t-SNT analysis showed that the SARS-CoV-2 is more closely to Influenza virus among 15 viruses families considered, as it can be seen in three t-SNE plots (Fig. 5). The t-SNE plot also showed proximity of the virus families. For example, Marburg and Ebola were close to each other, and the Orf virus was closer to Dengue virus.
3. Discussion
Since the COVID-19 pandemic is currently threatening many human lives, there is an immediate need for better tools to identify novel viruses for pathogenesis, treatment and vaccine development for current pandemic and potential pandemics in future. We used DL for classification of SARS-CoV-2 virus and 15 other types of viruses. We also showed that PCA and t-SNE can provide information about the similarity of a novel virus to other virus families. Using TEM images PCA and t-SNE, clustering results showed SARS-CoV-2 is closest to Influenza among 15 virus families considered in our study. Our approach helps to provide more accurate identification of a virus from TEM images, given high level of expertise required for analysis of TEM images, and also high chances of false positive or false negative in manual analysis of TEM images. To the best of our knowledge, this is the first study that uses pretrained DL models for classification of viruses from TEM images.
The DL models used in this paper are relatively large models in terms of model parameters. Training of these models will need large datasets as well as time. Using pretrained models, we developed DL frameworks for identification of TEM images more efficiently in terms of time and data required to train the models. These models are pretrained using large datasets; i.e., the ImageNet dataset [20]. All the three DL models considered in this paper provided predictions with accuracy larger than 70.6% (at 95% CI, Table 2), and the ROC curve showed areas larger than 0.9 (Fig. 3). Therefore, these DL models can be suitable candidates to further improve identification of viruses from TEM images.
The results from PCA and t-SNT provided the closest family of SARS-CoV-2. According to PCA and t-SNT visualizations, the novel virus is close to Influenza family of viruses (Figs. 4 and 5). These results should be interpreted by caution, however, as more computational and experimental investigations are needed to assess the similarities between SARS-CoV-2 and Influenza. As observed from PCA and t-SNT results (Figs. 4 and 5), Marburg and Ebola are also similar to each other. Because Marburg and Ebola are from Filoviridae family virus families [26, 27], our PCA and t-SNE are in line with literature. Our results can provide insights in future novel viruses to enable more rapid treatment and vaccine development.
One future advancement may be using our methodology for TEM images without negative staining [28]. If ML algorithms can classify TEM images without staining, it could further reduce time for virus studies. The virus images used in our study were negative staining TEM images as the dataset we had was composed of this kind of images [6]. Application of our methodology to TEM images without negative staining could show the capability of ML in classifying them if the dataset without staining becomes available. One of the limitations of this study was the limited number of SARS-CoV-2 images (n=25 before image augmentation). We used image augmentation to generate more SARS-CoV-2 images from available TEM images. The results for prediction of SARS-CoV-2 family were relatively better than other families (AlexNet and SqueezeNet, Fig. 3). This result may be due to limited number of SARS-CoV-2 images, and using augmentation to produce more images. If we had more images, the images used for training would have more variability. Having more images can lead to more accurate predictions for future SARS-CoV-2 images. This limitation can be addressed as more image data from this novel virus become available.
Also, the dataset used in this study has limitations. The dataset can be larger in which case the DL classification predictions for the SARS-CoV-2 can be made more generalized. Moreover, there could be other virus families that were not considered in the dataset. Those virus families can be closer to the SARS-CoV-2 than 15 virus families considered in this study. As such, inclusion of more virus families would improve our SARS-CoV-2 clustering outcomes. Our results may be improved by adding more images from 15 viruses as well as by adding more virus families. The DL models predicted the family of each TEM image. In this study, we used three pretrained models namely AlexNet, VGG and SqueezeNet. Based on our approach, more pretrained models can be used to predict the virus families from TEM images. The final result can be based on the predictions by several DL models. Using this “ensemble approach”, the net outcome would classify a TEM image with higher accuracy than just using one model.
In this study, we used three DL models. As indicated above, by considering more DL models, the results can be improved. Also, other ML models such as decision three algorithms and support vector machine algorithms can be added to the models. The results obtained from single models or ensemble of models can be compared to develop better models for classification of viruses based on TEM images. Our approach can lead to faster, more convenient and more reliable automatic methods for classification of TEM images. These automatic methods can contribute to overt pandemics by early identification or speed up recovery by targeting the precise structure of the virus.
5. Conclusions
The present findings suggest that transfer learning can be used to develop DL models for classification of viruses from TEM images, including the SARS-CoV-2 virus. Also, our results suggest that SARS-CoV-2 virus belongs to Influenza family of viruses. This result needs further investigation. We used 16 virus families. Our approach can be improved once we have more TEM images from SARS-CoV-2, and 15 virus families as well as more family of viruses. The closeness of Ebola and Marburg in PCA and t-SNE visualizations in our results, was in agreement with literature. Our study showed pretrained DL models as well as clustering methods can provide reliable classification of virus from TEM images.
Author Contribution
Y Dabiri developed models. Y Dabiri and GS Kassab analyzed results. Both authors contributed to writing of the manuscript and interpretation of results.
Conflict of interest
Y Dabiri is an employee of Abbott (Alameda, CA, United States).
References
- COVID-19 Map - Johns Hopkins Coronavirus Resource Center.
- Goldsmith CS & Miller SE. Modern uses of electron microscopy for detection of viruses. Clinical Microbiology Reviews 22 (2009): 552-563.
- FF Vale, AC Correia, B Matos, JMN. and APA de M. Applications of transmission electron microscopy to virus detection and identification. Microsc. Sci. Technol. Appl. Educ. A. Méndez- (2010).
- dos Santos FLC, Paci M, Nanni L, Brahnam S & Hyttinen J. Computer vision for virus image classification. Biosyst. Eng 138 (2015): 11-22.
- Gelderblom HR. Structure and Classification of Viruses. Medical Microbiology (University of Texas Medical Branch at Galveston (1996).
- Kylberg G, Uppström M & Sintorn IM. Virus texture analysis using local binary patterns and radial density profiles. in Lecture Notes in Computer Science (including subseries Lecture Notes in Artificial Intelligence and Lecture Notes in Bioinformatics) 7042 (2011): 573-580.
- Sintorn IM & Kylberg G. Virus recognition based on local texture. in Proceedings - International Conference on Pattern Recognition (2014): 3227-3232.
- Biel SS. & Madeley D. Diagnostic virology - The need for electron microscopy: A discussion paper. J. Clin. Virol 22 (2001): 1-9.
- Lin T-Y, Goyal P, Girshick R, He K & Dollár P. Focal Loss for Dense Object Detection. IEEE Trans. Pattern Anal. Mach. Intell 42 (2017): 318-327.
- Sahiner B, et al. Deep learning in medical imaging and radiation therapy. Medical Physics 46 (2019): e1-e36.
- Chiu SJ, et al. Kernel regression based segmentation of optical coherence tomography images with diabetic macular edema. Biomed. Opt. Express 6 (2015): 1172.
- Shen L, et al. Deep Learning to Improve Breast Cancer Detection on Screening Mammography. Sci Rep 9 (2019): 1-12.
- Tan C. et al. A Survey on Deep Transfer Learning. Lect. Notes Comput. Sci. (including Subser. Lect. Notes Artif. Intell. Lect. Notes Bioinformatics) 11141 LNCS (2018): 270-279.
- Van Der Maaten L & Hinton G. Visualizing Data using t-SNE. Journal of Machine Learning Research vol 9 (2008).
- Simonyan K & Zisserman A. Very deep convolutional networks for large-scale image recognition. in 3rd International Conference on Learning Representations, ICLR 2015 - Conference Track Proceedings (International Conference on Learning Representations, ICLR (2015).
- Krizhevsky, A. One weird trick for parallelizing convolutional neural networks. CoRR, abs/ (2014).
- Iandola FN, et al. SQUEEZENET: ALEXNET-LEVEL ACCURACY WITH 50X FEWER PARAMETERS AND <0.5MB MODEL SIZE. https://github.com/DeepScale/SqueezeNet.
- https://www.niaid.nih.gov/news-events/novel-coronavirus-sarscov2-images.
- Paszke A, et al. Automatic differentiation in PyTorch (2017).
- Deng J, et al. ImageNet: A large-scale hierarchical image database. in 248-255 (Institute of Electrical and Electronics Engineers (IEEE) (2010).
- User guide: contents — scikit-learn 0.22.2 documentation.
- Jollife IT & Cadima J. Principal component analysis: A review and recent developments. Philosophical Transactions of the Royal Society A: Mathematical, Physical and Engineering Sciences vol 374 (2016).
- Kobak D & Berens P. The art of using t-SNE for single-cell transcriptomics. Nat. Commun 10 (2019): 1-14.
- Fawcett T. An introduction to ROC analysis. Pattern Recognit. Lett 27 (2006): 861-874.
- Mitchell T. Machine Learning (1997).
- Shifflett K & Marzi A. Marburg virus pathogenesis - Differences and similarities in humans and animal models. Virology Journal 16 (2019): 165.
- Bente D, Gren J, Strong JE & Feldmann H. Disease modeling for Ebola and Marburg viruses. DMM Disease Models and Mechanisms. 2 (2009): 12-17.
- Brenner S & Horne RW. A negative staining method for high resolution electron microscopy of viruses. BBA - Biochim. Biophys. Acta 34 (1959): 103-110.

