Immunity Reaction by Chemotherapy Drug with DNP or Penicillin Introtumoral Injection in Mice Bearing Tumor
Article Information
Baofa, Yu1,2,4,5*; Jian Zhang3; Yan Han2; Guoqin Zheng1; Feng Gao4; Peng Jing4; and Peicheng Zhang4; Shengjun Zhou41
1TaiMei Baofa Cancer hospital, Dongping, Shandong Province, China, 271500
2Jinan Baofa Cancer hospital, Jinan, Shandong Province, China, 250000
3Beijing Baofa Cancer Hospital, Beijing, China, 100010
4Huanan Hospital, Shenzhen University, Shenzhen, Guangdong, China, 518055
5Immune Oncology Systems, Inc, San Diego, CA, USA, 92102
*Corresponding author:Baofa Yu, TaiMeiBaofa Cancer hospital, Dongping, Shandong Province, China, 271500.
Received: December 13, 2023; Accepted: December 22, 2023;Published: January 08, 2024
Citation: Baofa, Yu, Jian Zhang, Yan Han, Guoqin Zheng, Feng Gao, Peng Jing, Peicheng Zhang, Shengjun Zhou. Immunity Reaction by Chemotherapy Drug with DNP or Penicillin Introtumoral Injection in Mice Bearing Tumor. Journal of Cancer Science and Clinical Therapeutics 8 (2024): 22-46.
Share at FacebookAbstract
Introduction: To observe the abscopal effect related to acute inflammation in tumors with immunity reactions induced by an intratumoral injection of a chemotherapy drug with DNP or penicillin.
Methods: The C57BL/6 mice melanoma injected by a difference drug with DNP or penicillin and dissected for qPCR assay of expression of immune genes. Results: It showed that drug induced inflammation with expression of the CoL1a1, CD4, IL12aÂ, TGFb1Â, Elastin, Elastin, Cox2, CD11b/c, CD8, TNFa was detected at different days. The different drug and hapten induced a different expression of these genes. Group B, with Adr and DNP or penicillin, induces high expression,at day 1. With DNP, CD 11bc, CD8 and TNFa is especially high, while with Penicillin, CD11b/c, CD4 and CD8 is high. Group C, with BLM and DNP or penicillin, induces gene expression. DNP does not have higher gene expression, but penicillin did for IL12aÂ, CD11b/c, TNFaÂ. Group D, with PYM and DNP or penicillin, induces the genes’ expression. DNP does not have higher expression, but penicillin has a special higher expression of IL12a at day 4.
Discussion: Use of penicillin alone can induce strong immunity expression of IL12aÂ, CD11b/c, TNFaÂ, DNP, Adr, BLM and PYM alone cannot induce same immunity. It is the most important of CD11b/c expression in acute inflammation for tumor antigen presenting cell in tumor immunity reaction which related to be abscopal effect. A drug with DNP or Penicillin intratumoral injection can induce an acute inflammation in tumor with immunity reaction.
Keywords
Abscopal effect, Hapten, DNP, Penicillin, Intratumoral injection of chemotherapy.
Abscopal effect articles; Hapten articles, DNP articles; Penicillin articles; Intratumoral articles injection of chemotherapy articles.
Abscopal effect articles Abscopal effect Research articles Abscopal effect review articles Abscopal effect PubMed articles Abscopal effect PubMed Central articles Abscopal effect 2023 articles Abscopal effect 2024 articles Abscopal effect Scopus articles Abscopal effect impact factor journals Abscopal effect Scopus journals Abscopal effect PubMed journals Abscopal effect medical journals Abscopal effect free journals Abscopal effect best journals Abscopal effect top journals Abscopal effect free medical journals Abscopal effect famous journals Abscopal effect Google Scholar indexed journals Hapten articles Hapten Research articles Hapten review articles Hapten PubMed articles Hapten PubMed Central articles Hapten 2023 articles Hapten 2024 articles Hapten Scopus articles Hapten impact factor journals Hapten Scopus journals Hapten PubMed journals Hapten medical journals Hapten free journals Hapten best journals Hapten top journals Hapten free medical journals Hapten famous journals Hapten Google Scholar indexed journals DNP articles DNP Research articles DNP review articles DNP PubMed articles DNP PubMed Central articles DNP 2023 articles DNP 2024 articles DNP Scopus articles DNP impact factor journals DNP Scopus journals DNP PubMed journals DNP medical journals DNP free journals DNP best journals DNP top journals DNP free medical journals DNP famous journals DNP Google Scholar indexed journals Penicillin articles Penicillin Research articles Penicillin review articles Penicillin PubMed articles Penicillin PubMed Central articles Penicillin 2023 articles Penicillin 2024 articles Penicillin Scopus articles Penicillin impact factor journals Penicillin Scopus journals Penicillin PubMed journals Penicillin medical journals Penicillin free journals Penicillin best journals Penicillin top journals Penicillin free medical journals Penicillin famous journals Penicillin Google Scholar indexed journals Intratumoral injection of chemotherapy articles Intratumoral injection of chemotherapy Research articles Intratumoral injection of chemotherapy review articles Intratumoral injection of chemotherapy PubMed articles Intratumoral injection of chemotherapy PubMed Central articles Intratumoral injection of chemotherapy 2023 articles Intratumoral injection of chemotherapy 2024 articles Intratumoral injection of chemotherapy Scopus articles Intratumoral injection of chemotherapy impact factor journals Intratumoral injection of chemotherapy Scopus journals Intratumoral injection of chemotherapy PubMed journals Intratumoral injection of chemotherapy medical journals Intratumoral injection of chemotherapy free journals Intratumoral injection of chemotherapy best journals Intratumoral injection of chemotherapy top journals Intratumoral injection of chemotherapy free medical journals Intratumoral injection of chemotherapy famous journals Intratumoral injection of chemotherapy Google Scholar indexed journals Drug delivery articles Drug delivery Research articles Drug delivery review articles Drug delivery PubMed articles Drug delivery PubMed Central articles Drug delivery 2023 articles Drug delivery 2024 articles Drug delivery Scopus articles Drug delivery impact factor journals Drug delivery Scopus journals Drug delivery PubMed journals Drug delivery medical journals Drug delivery free journals Drug delivery best journals Drug delivery top journals Drug delivery free medical journals Drug delivery famous journals Drug delivery Google Scholar indexed journals anticancer drugs articles anticancer drugs Research articles anticancer drugs review articles anticancer drugs PubMed articles anticancer drugs PubMed Central articles anticancer drugs 2023 articles anticancer drugs 2024 articles anticancer drugs Scopus articles anticancer drugs impact factor journals anticancer drugs Scopus journals anticancer drugs PubMed journals anticancer drugs medical journals anticancer drugs free journals anticancer drugs best journals anticancer drugs top journals anticancer drugs free medical journals anticancer drugs famous journals anticancer drugs Google Scholar indexed journals immune genes articles immune genes Research articles immune genes review articles immune genes PubMed articles immune genes PubMed Central articles immune genes 2023 articles immune genes 2024 articles immune genes Scopus articles immune genes impact factor journals immune genes Scopus journals immune genes PubMed journals immune genes medical journals immune genes free journals immune genes best journals immune genes top journals immune genes free medical journals immune genes famous journals immune genes Google Scholar indexed journals tumor antigen articles tumor antigen Research articles tumor antigen review articles tumor antigen PubMed articles tumor antigen PubMed Central articles tumor antigen 2023 articles tumor antigen 2024 articles tumor antigen Scopus articles tumor antigen impact factor journals tumor antigen Scopus journals tumor antigen PubMed journals tumor antigen medical journals tumor antigen free journals tumor antigen best journals tumor antigen top journals tumor antigen free medical journals tumor antigen famous journals tumor antigen Google Scholar indexed journals toxic effects articles toxic effects Research articles toxic effects review articles toxic effects PubMed articles toxic effects PubMed Central articles toxic effects 2023 articles toxic effects 2024 articles toxic effects Scopus articles toxic effects impact factor journals toxic effects Scopus journals toxic effects PubMed journals toxic effects medical journals toxic effects free journals toxic effects best journals toxic effects top journals toxic effects free medical journals toxic effects famous journals toxic effects Google Scholar indexed journals
Article Details
Introduction
Drug delivery, including intratumoral injection of anticancer drugs, is applied extensively in the drug development of various formulations for improving patient compliance and convenience [1]. Current technologies allow drugs to release delivery anywhere from days to years. Implantable systems, for example, can delivery drugs locally for months or years. Despite this innovative progress, substantial improvement in the advancement of cancer patients’ clinical care is required. Drug delivery technologies can target a specific area with drugs, including intratumoral injection or drug slow release to minimize drug-originated, systemically toxic effects [2]. Thirty years ago, researchers discovered how to deliver a drug to a tumor with water soluble drugs. By overcoming the challenges associated with the viscosity of injections, it reaches a better distribution within a tumor [2]. Therapies of increased complexity were inspired by the study of a local anticancer drug delivery, with reactive oxygen species (ROS), in an H2O2 solution for easier injection and even distribution within tumor for a prolonged release3. When the anticancer drug is injected intratumorally, this immunological therapy battles induced immunological reactions [3]. An Intratumoral injection with a single drug or combination of drugs is extensively researched [4, 5]. Limited research exists regarding how hapten enhances survival time when injected intratumorally with anticancer drugs. The findings of this research indicate that acute inflammation increases in tumors due to CD4 and CD8 increasing [6-9]. No reports explain the relationship between tumors’ inflammation, induced by intratumoral injection of dug and hapten, and induced acute inflammation. Animal model studies, detailing the investigation of multiple immune factors, are lacking. The mechanism of the abscopal effect in animal model is not understood. Therefore, we used quantitative polymerase chain reaction (PCR) assay and histoimmunological staining methods to compare the immunological reaction of animal tumors post-intratumoral injection chemotherapy drug with hapten. The hapten components tested were 2, 4-dinitrophenol (DNP) or penicillin.
Materials and Methods
Preparation of the Tumor Model:
C57BL/6 mouse was used for melanoma in the B16 tumor model. The tumor was dissected under aseptic conditions, placed in the plate, and cut into small pieces (<1mm3). The homogenate was filtered. Then, the filtrate was diluted into tumor cell suspension with 0.9% sodium chloride injection (2×10⁷/ml). To establish the subcutaneous solid tumor model of mouse, the C57 mouse was inoculated with the prepared tumor filtrate through subcutaneous injection on the underarm of the left foreleg under aseptic conditions. We selected the subcutaneous transplantation of the solid tumor in mouse to be the related tumor model. When tumor growth reached 5-8mm; the intratumoral injection dose is 0.1ml for 100mm3 tumor volume for mouse in each group of different combination of drugs at one time. all experimental protocols were approved by ethic committee of Taimei Baofahospital and all methods for experiments were performed in accordance with ARRIVE guidelines (https://arriveguidelines.org).
Preparation for Combination and Dosage of Drugs and Hapten:
There were a total of 108 model mice. Group A was a control with sperate injections of DNP (A1) and penicillin (A2). Group B included the injection of DNP and H2O2 with Doxorubicin hydrochloride (Adr) (B1) and penicillin and H2O2 with Adr (B2), and Adr and H2O2 (B3). Group C included the injection of DNP and H2O2 with Bleomycin hydrochloride injection (BLM) (C1) and Penicillin and H2O2 with BLM (C2), and BLM and H2O2 (C3). Group D included the injection of DNP and H2O2 with Pingyangmycin (PYM) (D1) and penicillin and H2O with PYM (D2), and PYM and H2O2 (D3) (Table 1).
Treatment Method:
When the diameter of the tumor reached 5-8mm on experiment day 0, after the inoculation of tumor cells, randomly grouped intratumoral injections were performed with a corresponding set of drug combinations (Table 1). Every 3 mice within each experimental group were
Table1: Intratumoral Injection Dose and Drugs with Hapten of DNP or Penicillin
|
Grouping |
Hapten component |
Preparation concentration |
Injection dose |
Animal number (mouse) |
|
(mg/ml) |
(μg/ mm3) |
|||
|
DNP |
DNP |
1 |
1 |
9 |
|
Penicillin |
Penicillin |
144 |
144 |
9 |
|
A1 Adr + DNP+H2O2 |
Adr +DNP+ H2O2 |
1.00+1.00+20 |
1.00+1.00+20 |
9 |
|
A2 Adr + Penicillin +H2O2 |
Adr + Penicillin + 2O2 |
1.00+144+20 |
1.00+144+20 |
9 |
|
Adr |
Adr+ H2O2 |
1 |
1 |
9 |
|
B1 BLM+DNP+H2O2 |
BLM+DNP+ H2O2 |
1.50+1.00+20 |
9 |
|
|
B2 BLM+Penicillin+H2O2 |
BLM+Penicillin+H2O2 |
1.50+144+20 |
1.50+1.00+20 |
9 |
|
BLM |
BLM+ H2O2 |
0.8 |
1.50+144+20 |
9 |
|
C1 PYM+DNP+H2O2 |
PYM+DNP+H2O2 |
1.50+1.00+20 |
1.50+1.00+20 |
9 |
|
C2 PYM+Penicillin+H2O2 |
PYM+Penicillin+H2O2 |
1.50+144+20 |
1.50+144+20 |
9 |
|
PYM |
PYM+ H2O2 |
1.5 |
9 |
Total number of model mice: 108,
DNP and penicillin as hapten alone for control group;
Adr (Doxorubicin hydrochloride injection), BLM (Bleomycin hydrochloride injection) and PYM (Pingyangmycin injection) each also as chemotherapy drug control group.
A1, Adr with DNP and H2O2; A2 Adr with penicillin and H2O2; B1, BLM with DNP and H2O2; B2 BLM with Penicillin and H2O2; C1, PYM with DNP and H2O2; C2, PYM with penicillin and H2O2, sacrificed on experiment day 1, day 4 and day 7, and then the tumor was dissected and submitted for a pathological immunohistochemical test and PCR quantitative assay.
DNP and penicillin as hapten alone for control group;
Adr (Doxorubicin hydrochloride injection), BLM (Bleomycin hydrochloride injection) and PYM (Pingyangmycin injection) each also as chemotherapy drug control group.
A1, Adr with DNP and H2O2; A2 Adr with penicillin and H2O2;
B1, BLM with DNP and H2O2; B2 BLM with Penicillin and H2O2;
C1, PYM with DNP and H2O2; C2, PYM with penicillin
and H2O2,
Pathological histochemical staining:
Various tissues were prepared for observation of morphological changes under the light microscope and pictures were taken as usual practice. Immunohistochemical staining of CD4, CD11, FOXp3, CD8 and CD86 was performed on day 1 and 7.
PCR quantitative assay:
Small parts of the tumor tissues were taken for the detection the expression of various proliferation. The genes were correlated with immunological reactions by the procedure listed as follows.
1 Primers:
Real qPCR primers of various proliferation and primers of various immune factor as well as immunity-related factors, were shown in Table 2.
RNA Isolation and Reverse transcription:
The cryopreserved, fresh tumor samples were rapidly transferred to the liquid nitrogen precooled mortar and were grinded with continuous add of liquid nitrogen until the tumor tissues turned into powder (without obvious visible particles; if the tumor tissues were not grinded completed, it might influence the yield and quality of RNA). Then lysate Buffer was made by adding 20ul of 50X DTT to every 1ul of Buffer RL. The grinded powder was added to a 1.5 ml sterilization tube containing 350 μl of Buffer with lysate. The tube was oscillated until there was no obvious sediment in the lysate [10, 11]. After abandoning the filtrate, 600 μl of Buffer RWB was slowly and evenly added to the RNA spin column for the second time. The mixed solution was put for centrifugation at 12000 rpm for 30 seconds and the filtrate was abandoned again. The RNA Spin Column was centrifugated at 12000 rpm for 2 minutes and was then put in the 1.5 ml RNASE- free Column Tube. 50 μl of RNASE-Free dH2O was added to the RNA Spin Column at the center of the membrane by pipette. After 5 minutes of standing still at room temperature, the solution was centrifugated for 2 minutes. Then elution of RNA was performed. In order to acquire a high concentration of RNA, the eluent of the 1.5 ml RNASE-Free Column Tube was put back in the RNA Spin Column. After standing still at room temperature for 5 minutes, 2 minutes of centrifugation at 12000 rpm, elution of RNA, and protein electrophoresis was performed [10, 11]. At a maximum volume of 6 μl, 4 μg of RNA were used for the reverse transcription. Reagents from the Superscript III First Strand Synthesis Super Mix Kit (Invitrogen, San Diego, Ca, USA) were added in the order described in Invitrogen’s manual12. The samples were then kept on –20°C until further use in RT-PCR.
Table 2: Primer of qPCR immunological genes
|
NFKB Forward |
ATG GCA GAC GAT GAT CCC TAC |
|
NFKB Reverse |
CGG AAT CGA AAT CCC CTC TGT T |
|
Elastin Forward |
TTG CTG ATC CTC TTG CTC AAC |
|
Elastin Reverse |
GCC CCT GGA TAA TAG ACT CCA C |
|
COX2 Forward |
TGC ACT ATG GTT ACA AAA GCT GG |
|
COX2 Reverse |
TCA GGA AGC TCC TTA TTT CCC TT |
|
TNFa Forward |
CTG AAC TTC GGG GTG ATC GG |
|
TNFa Reverse |
GGC TTG TCA CTC GAA TTT TGA GA |
|
TGFb1Â Forward |
GTT CTT CAA TAC GTC AGA CAT TCG |
|
TGFb1Â Reverse |
GTA ACG CCA GGA ATT GTT GCT A |
|
Col1a1 Forward |
CTG GCG GTT CAG GTC CAA T |
|
Col1a1 Reverse |
TTC CAG GCA ATC CAC GAG C |
|
Il12a Forward |
TGC CTT GGT AGC ATC TAT GAG G |
|
Il12a Reverse |
CGC AGA GTC TCG CCA TTA TGA T |
|
CD11b/c Forward |
CCA AGA CAT CGT GTT CCT GAT T |
|
CD11b/c Reverse |
ACA GCT TTA ACA AAG TCC AGC A |
|
CD4 Forward |
AGG TGA TGG GAC CTA CCT CTC |
|
CD4 Reverse |
GGG GCC ACC ACT TGA ACT AC |
|
CD8 Forward |
AAG AAA ATG GAC GCC GAA CTT |
|
CD8 Reverse |
AAG CCA TAT AGA CAA CGA AGG TG |
Note: Primers for those genes with forward and reverse sequence.
The preparation of the Electrophoresis liquid and Usage of the PCR Apparatus:
Related materials were added into 1.5ml EP tube according to Invitrogen’s manual. The 96-well plates were out, and 16.8 μl of PCR reaction liquid was added to each well of a 96- well plate. No. 10 primer was added to the first 3 wells and the remaining primers were added to the wells according to their serial numbers. The plates were then covered with micro–Amp PCR a compatible DNA/RNA/RNASE-FREE membrane and placed into 7500 Real Time PCR system. Then the after subjecting it to the 7500-software v 2.0.6., 20 μl of samples was reacted at 95°C for 5s and 60°C for 30s. It completed after approximately 92 minutes [10, 11]. After the software finished running, qPCR analysis was conducted.
Results
Pathological and Immunohistochemical Test of C57BL/6 Mice:
The immunohistochemical test was performed in experiment group C with CD4, CD11, FOXp3, CD8 and CD86 on day 1 and 7 resulted in positive staining, demonstrating that when an immunological reaction is induced by intratumoral injection with drug and hapten, it can induce the special expression of CD11 and CD86. This indicates that the activation of tumor antigen presentation, hapten of DNP, and hapten of penicillin can each induce an immunological response. Therefore, both DNP and penicillin can be used as a hapten to modify tumor antigens in order to increase their capability of antigenicity. The following staining are the different expression of CD4, CD11, FOXp3, CD8 and CD86 (Figure 1).
Fluorescent quantitative assay
The immunohistochemical stain is often used for assaying the protein expression of special T cell. It is very complicated and costly; therefore, the RNA quantitative PCR is executed for test the expression of CoL1a1, CD4, IL12aÂ, TGFb1Â, Elastin, Elastin, Cox2, CD11b/c, CD8, TNFaÂ, it is found that it is a more precise and very practical assay than the immunohistochemical staining. Experiment B1 was performed to compare the Adr and DNP. A comparison was
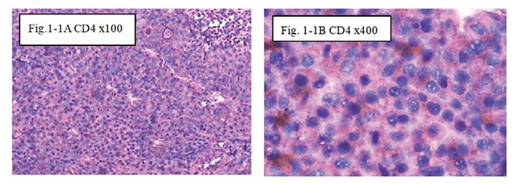
Figure 1-1 CD4: The immunohistochemical staining shows the CD4 positive at 100x (Fig.1-1A) and 400x (Fig.1-1B) in at day1, showed CD4 T Cell of special the immune reaction happened after injection intratumoral with drug and hapten day1.
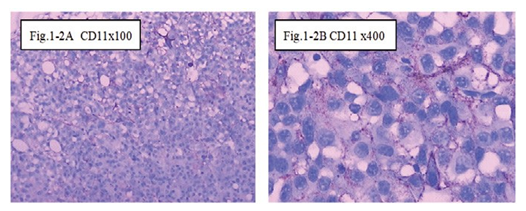
Figure 1-2 CD11: The immunohistochemical staining shows the CD11 positive at 100x (Fig.1-2A) and 400x (Fig.1-2B) at day1, showed CD11 cells activation of special the immune reaction happened after injection intratumoral with drug and hapten day 1.
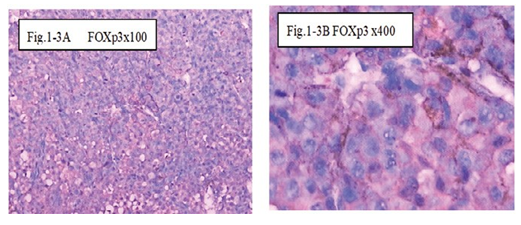
Figure 1-3 FOXp3: The immunohistochemical staining shows the FOXp3 positive at 100x (Fig.1-3A) and 400x (Fig.1-3B) in B1:BLM+DNP+H2O2 at day1, showed expression of FOXp3 for special the immune reaction happened after injection intratumoral with drug and hapten day 1 .
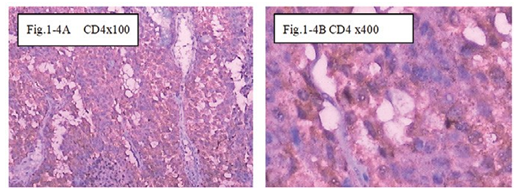
Figure 1-4 CD4: The immunohistochemical staining shows the CD4 positive at 100x (Fig.1-4A) and 400x (Fig.1-4B) in B1:BLM+DNP+H2O2 at day7, showed expression of CD4 for special the immune reaction happened after injection intratumoral with drug and hapten day 7.
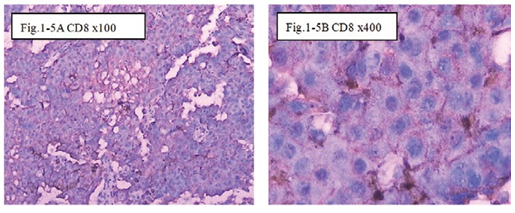
Figure 1-5 CD8: The immunohistochemical staining shows the CD8 positive at 100x (Fig.1-5A) and 400x Fig.1-5B) in B1:BLM+DNP+H2O2 at day7, showed expression of CD8 for special the immune reaction happened after injection intratumoral with drug and hapten day 7.
made between the genes expression on intratumoral injection day 1, 4 and 7. Results indicate that there was an increase in the expression of CoL1a1, CD4, IL12aÂ, TGFb1Â, Elastin, Elastin, Cox2, CD11b/c, CD8, TNFaÂ, compared with the expression on day 1, untreated samples. There was an especially heightened expression of CD 11c, CD8 and TNFa at day 1, followed by a drop on day 4 and 7. Therefore, the immunity is related with the TNFa expression. The immune response of CD11b/c, CD8 with new tumor antigens result in tumor antigens presentation and vaccination. The expression of CD4, CD8, and CD11 in the qPCR assay correlates with the immunohistochemical staining of CD4, CD8 and CD11. The qPCR assay expression of related genes proved to be an effective replacement of the immunohistochemical staining (Table 3.2 and Figure 2-1 B1). Experiment B2 compared Adr and penicillin. A comparison was made between the genes’ expression on intratumoral injection day 1, 4 and 7. Results demonstrate that there was an increase in the expression of CoL1a1, CD4, IL12aÂ, TGFb1Â, Elastin, Elastin, Cox2, CD11c, CD8, and TNFaÂ, compared with the day 1, untreated levels. After day 1, there was an immediately drop, yet the level of expression was still higher than DNP group on day 4 and 7. The especially heightened expression for CD11c, CD4, and CD8 on day 1 relates the inflammatory reaction to IL12a expression. The immune response of new tumor antigens with CD11c, CD4, and CD8, results in the
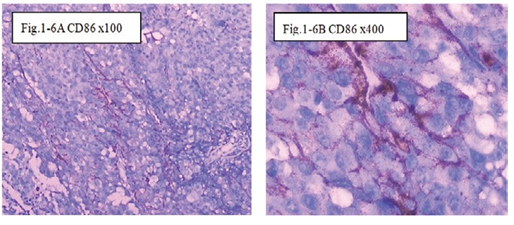
Figure 1-6 CD86: The immunohistochemical staining shows the CD86 positive at 100x (Fig.1-6A) and 400x (Fig.1-6B) in B1:BLM+DNP+H2O2 at day7, showed expression of CD86 for special the immune reaction happened after injection intratumoral with drug and hapten day 7.
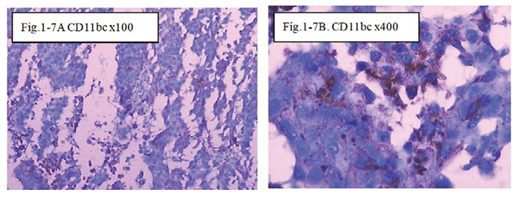
Figure 1-7 CD11b/c: The immunohistochemical staining shows the CD11b/c positive at 100x (Fig.1-7A) and 400x (Fig.1-7B) in B1:BLM+DNP+H2O2 at day7, showed expression of CD11bc for special the immune reaction happened after injection intratumoral with drug and hapten day 7.
presentation and vaccination of tumor antigens (Table 3.2 and Figure 2-1 B2). Experiment C1compared BLM and DNP. A comparison was made between the genes’ expression on intratumoral injection day 1, 4 and 7. Results demonstrate that there was an increase in the expression of CoL1a1, CD4, IL12aÂ, TGFb1Â, Elastin, Elastin, Cox2, CD11c, CD8, TNFa compared with the day 1, untreated levels. Still, this demonstrates that the inflammatory reaction was related with all the factors given the immune response of new tumor antigens for inducing the expression of CoL1a1, CD4, IL12aÂ, TGFb1Â, Elastin, Elastin, Cox2, CD11c, CD8 and TNFa in response to the tumor antigens presentation and vaccination with DNP (Table 3.3 and Figure 2-2 C1). Experiment C2 compared BLM and penicillin. A comparison was made between the genes’ expression on intratumoral injection day 1, 4 and 7 in C2 group. Results exhibited it a higher expression of CoL1a1, CD4, IL12aÂ, TGFb1Â, Elastin, Elastin, Cox2, CD11c, CD8, TNFa compared with the untreated, day 1 expression levels. This outlines a special heightened expression for IL12aÂ, CD11c, TNFaÂ. Additionally, the results lead to the conclusion that the inflammation reaction is related with all the factors because of the immune response of the new tumor antigens with the higher expression of IL12aÂ, CD11c, and TNFa by the tumor antigens presentation and vaccination with penicillin (Table and Figure 2-2 C2). The D1 experiment was performed with PYM and DNP. A comparison was made for the genes expressed after intratumoral injection day 1, 4 and 7. Results show that on day 1, 4 and 7, the expression of CoL1a1, CD4, IL12aÂ, TGFb1Â, Elastin, Elastin, Cox2, CD11c, CD8, TNFa increased when compared with the day 1, untreated expression levels. This evidenced the immune response of new tumor antigens with the expression of these genes (Table and Figure 1-3 D1). The D2 experiment was performed with PYM and DNP to compare the genes expressed after intratumoral injection on day 1, 4 and 7. Results showed that on day 1, 4 and 7, the expression of CoL1a1, CD4, IL12aÂ, TGFb1Â, Elastin, Elastin, Cox2, CD11c, CD8, and TNFa was higher in the day 1, untreated sample. There was an especially high expression of IL12a on day 4, showing the immune response of new tumor antigens to the expression of genes (Table 3.4 and Figure 2-3 D2).
Discussion
The concept of intratumoral drug delivery has been studied for several decades, simple intratumoral injection of a drug is a cancer therapy technique that started 100 years ago [4, 13]. Successful instances with significant reduction in both toxicity and tumor growth have shown the clinical feasibility of such treatment options [4, 13]. All current methods in clinic practice are only focused on the local damage of a tumor [4, 13]. They lack a designed strategy to stimulate body immunity against cancer cell while it kills the tumor
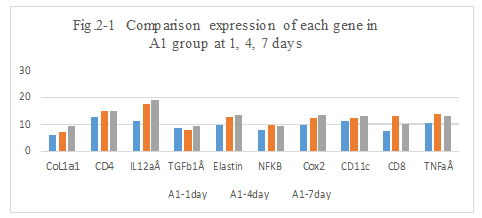
Figure 2-1: A1 experiment with Adr and DNP, comparison was performed for the expression of different genes after intratumoral injection day 1, 4 and 7, it showed that the higher expression of CoL1a1, CD4, IL12aÂ, TGFb1Â, Elastin, NFKB, Cox2, CD11b/c, CD8, than these untreated at day 1, special higher expression of CD11c, CD4, CD8 and TNFa at day 1, then it immediately drop to a lower leave at day 4 and day 7. It showed the immunity related with TNFaÂ, the immune response of new tumor antigens with CD11b/c,CD8, resulted in the tumor antigens presentation and vaccination with DNP. The expression of CD4, CD8 and CD11 by qPCR assay was correlated with immunohistochemical staining of CD4, CD8 and CD11, it was approved to have effective replacement of the immunohistochemical staining by qPCR assay to test the expression of related genes.
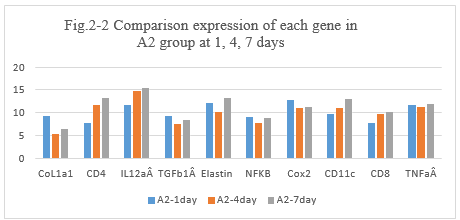
Figure 2-2: A2, experiment with Adr and penicillin, comparison was performed for the expression of different genes after intratumoral injection at day 1, 4 and 7, it showed that the higher expression of CoL1a1, CD4, IL12aÂ, TGFb1Â, Elastin, NFKB, Cox2, CD11c, CD8, TNFa than before these untreated day 1, then it immediately drop to a lower leave, but it is still higher than DNP group at day 4, day 7. The special higher expression for CD 11c,CD4 and CD8 at day 1, it showed the inflammation reaction happened and related with IL12aÂ, the immune response of new tumor antigens with CD11c, CD4 and CD8 resulted in the tumor antigens presentation and vaccination with Penicillin.
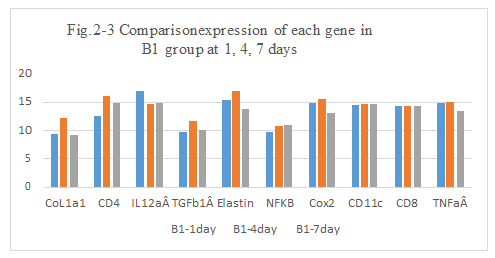
Figure 2-3: C1 experiment with BLM and DNP, comparison was performed for the expression of different genes after intratumoral injection day 1, 4 and 7, it showed that the a little higher expression of CoL1a1, CD4, IL12aÂ, TGFb1Â, Elastin, NFKB, Cox2, CD11c, CD8, TNFa than the previous these untreated, it still showed the inflammation reaction happened and related with all the factors, the immune response of new tumor antigens for inducing the expression of CoL1a1, CD4, IL12aÂ, TGFb1Â, Elastin, Cox2, CD11c, CD8 and TNFa by the tumor antigens presentation and vaccination with DNP.
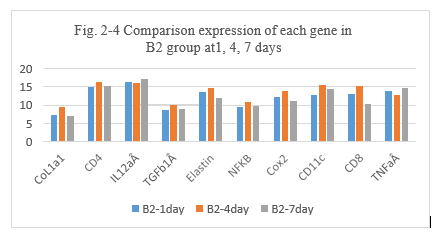
Figure 2-4: C2 experiment with BLM and penicillin, comparison was performed for the expression of different genes after intratumoral injection day 1, 4 and 7 in C2 group, it showed that the higher expression of CoL1a1, CD4, IL12aÂ, TGFb1Â, Elastin, NFKB, Cox2, CD11c, CD8, TNFa than the previous these untreated, at day 1, it showed a special higher of expression for IL12aÂ, CD11c, TNFaÂ. It showed the inflammation reaction related with all the factors, the immune response of new tumor antigens was induced with the higher expression of IL12aÂ, CD11c, TNFa by the tumor antigens presentation and vaccination with penicillin.
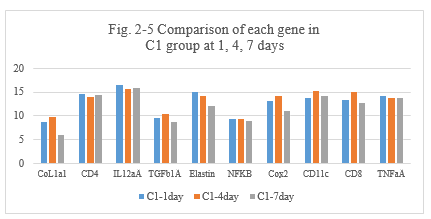
Figure 2-5: D1 experiment with PYM and DNP, comparison was performed for the expression of different genes after intratumoral injection day 1, 4 and 7, it showed that the higher expression of CoL1a1, CD4, IL12aÂ, TGFb1Â, Elastin, NFKB, Cox2, CD11c, CD8, TNFa than the previous these untreated, at day 1, 4 and 7. It showed the immune response of new tumor antigens was induced with the expression of genes by the tumor antigens presentation and vaccination with DNP.
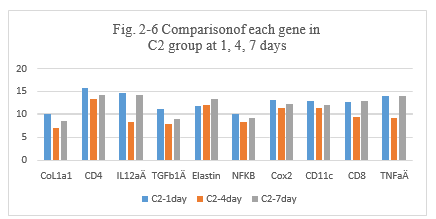
Figure 2-6: D2 experiment with PYM and DNP, comparison was performed for the expression of different genes after intratumoral injection day 1, 4 and 7, it showed that the higher expression of CoL1a1, CD4, IL12aÂ, TGFb1Â, Elastin, NFKB, Cox2, CD11c, CD8, TNFa than the previous these untreated, at day 1, 4 and 7. The special higher expression of IL12a at day 4. It showed the immune response of new tumor antigens was induced with the expression of genes by the tumor antigens presentation and vaccination with DNP.
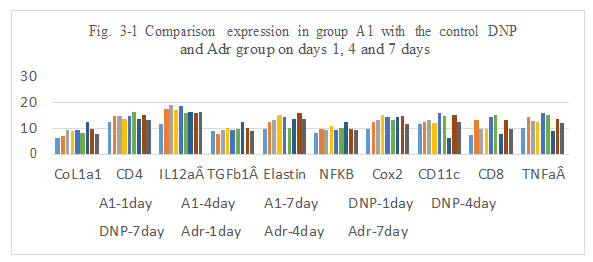
Figure 3-1: A1 experiment was compared with the control DNP and Adr group at day 1, 4 and 7 for all related genes expression, it was found that A1 combination has a similarity function compared to DNP and Adr in the inducing the immunity reaction of CoL1a1, CD4, IL12aÂ, TGFb1Â, Elastin, NFKB, Cox2, CD11c, CD8, TNFa at day 1, 4 and 7; at day 4 and 7 A1 has a higher expression for IL12aÂ, Cox2 and CD11, it indicated that A1 combination has a ability to induce the immunity reaction while they are killing the tumor cells after intratumoral injection.
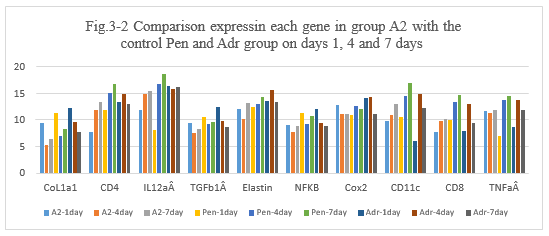
Figure 3-2: A2 experiment was compared with the control Penicillin and Adr group at day 1, 4 and 7 for all related genes expression, it was found that A2 combination has a similarity function compared to Penicillin and Adr in the inducing the immunity reaction of those related genes of CoL1a1, CD4, IL12aÂ, TGFb1Â, Elastin, NFKB, Cox2, CD11c, CD8, TNFa at day 1, 4 and 7; at day 4 and 7 A2 has a higher expression for CD4, IL12aÂ, Cox2, CD11 and CD8 which is similarity to penicillin, it indicated that A2 combination has a high ability to induce the immunity reaction while they are killing the tumor cells after intratumoral injection.
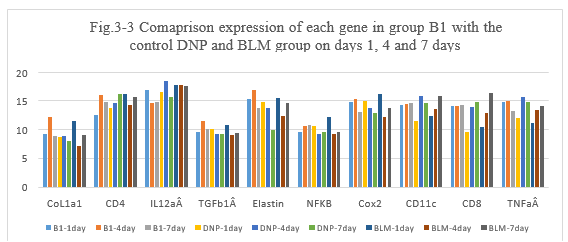
Figure 3-3: B1 experiment was compared with the control DNP and BLM group at day 1, 4 and 7 for all related genes expression, it was found that B1 combination has a similarity function compared to DNP and BLM in the inducing the immunity reaction of those related genes of CoL1a1, CD4, IL12aÂ, TGFb1Â, Elastin, NFKB, Cox2, CD11c, CD8, TNFa at day 1, 4 and 7; at day 4 and 7 B1 has a higher expression for CD4, IL12aÂ, Cox2, CD11 and CD8 which is similarity to DNP, it indicated that B1 combination has a high ability to induce the immunity reaction while they are killing the tumor cells after intratumoral injection.
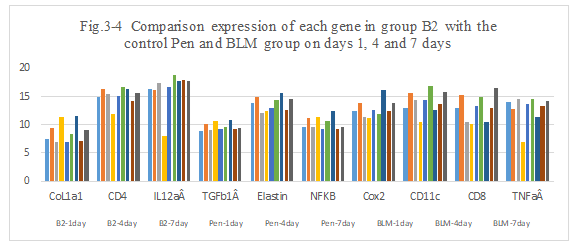
Figure 3-4: B2 experiment was compared with the control Penicillin and BLM group at day 1, 4 and 7 for all related genes expression, it was found that B2 combination has a similarity function compared to DNP and BLM in the inducing the immunity reaction of those related genes of CoL1a1, CD4, IL12aÂ, TGFb1Â, Elastin, NFKB, Cox2, CD11c, CD8, TNFa at day 1, 4 and 7; at day 4 and 7 B2 has a higher expression for CD4, IL12aÂ, Cox2, CD11 and CD8 which is similarity to DNP and BLM, it indicated that B2 combination has a high ability to induce the immunity reaction while they are killing the tumor cells after intratumoral injection.
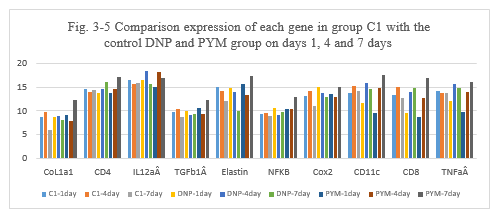
Figure 3-5: C1 experiment was compared with the control DNP and PYM group at day 1, 4 and 7 for all related genes expression, it was found that C1 combination has a similarity function compared to DNP and BLM in the inducing the immunity reaction of those related genes of CoL1a1, CD4, IL12aÂ, TGFb1Â, Elastin, NFKB, Cox2, CD11c, CD8, TNFa at day 1, 4 and 7; at day 4 and 7 C1 has a higher expression for CD4, IL12aÂ, Cox2, CD11 and CD8 which is similarity to DNP and PYM, it indicated that C1 combination also has a high ability to induce the immunity reaction while they are killing the tumor cells after intratumoral injection.
FIg.3-6 Comparison expression of each gene in group C2 with the
control Pen and PYM group on days 1, 4 and 7 days
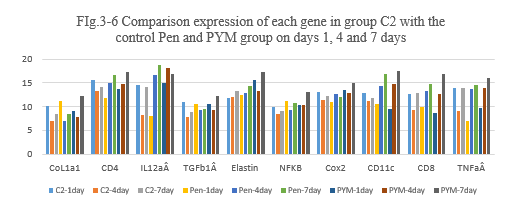
Figure 3-6: C2 experiment was compared with the control penicillin and PYM group at day 1, 4 and 7 for all related genes expression, it was found that C2 combination has a similarity function compared to Penicillin and BLM in the inducing the immunity reaction of those related genes of CoL1a1, CD4, IL12aÂ, TGFb1Â, Elastin, NFKB, Cox2, CD11c, CD8, TNFa at day 1, 4 and 7; at day 4 and 7 C2 has a higher expression for CD4, IL12aÂ, Cox2, CD11 and CD8 which is similarity to Penicillin and PYM, it indicated that C2 combination also has a high ability to induce the immunity reaction while they are killing the tumor cells after intratumoral injection.
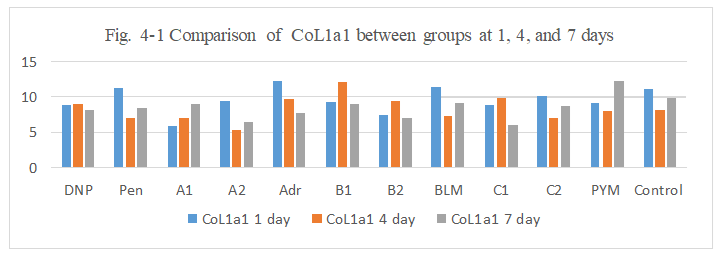
Figure 4-1: CoL1a1 expression was compared with each group, it was found that all group has similarity in the induce of CoL1a1 expression.
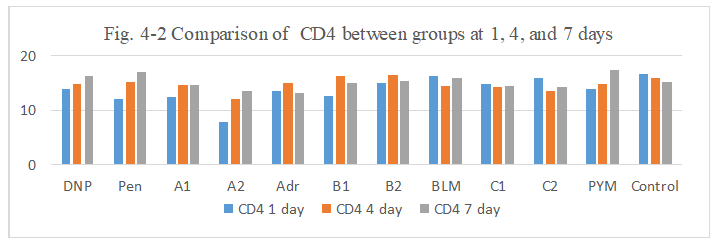
Figure 4-2: CD4 expression was compared with each group, it was found that all group has similarity in the induce of CD4 expression except for A2 group at day1 with lower expression.
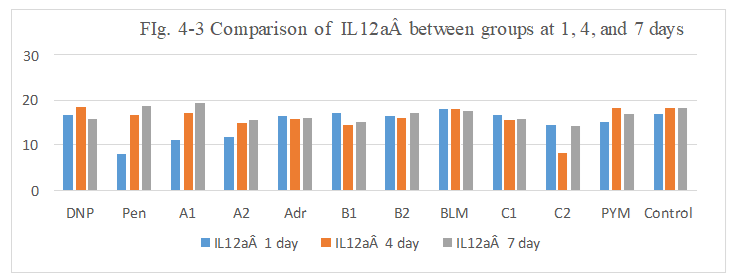
Figure 4-3: IL12a expression was compared with each group, it was found that all group has similarity in the induce of IL12a expression except for Pen and A1, A2 group at day1 with lower expression.
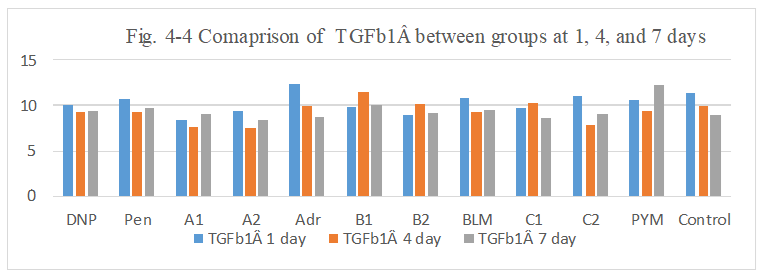
Figure 4-4: TGFb1Â expression was compared with each group, it was found that all group has similarity in the induce of TGFb1Â expression.
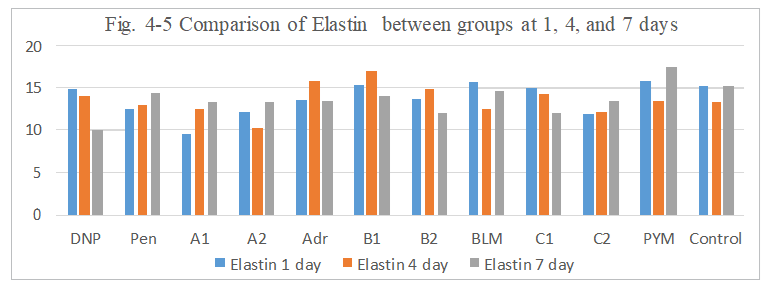
Figure 4-5: Elastin expression was compared with each group, it was found that all group has similarity in the induce of Elastin expression, it indicated that Elastin higher expression may help limited tumor cell to metastasis.
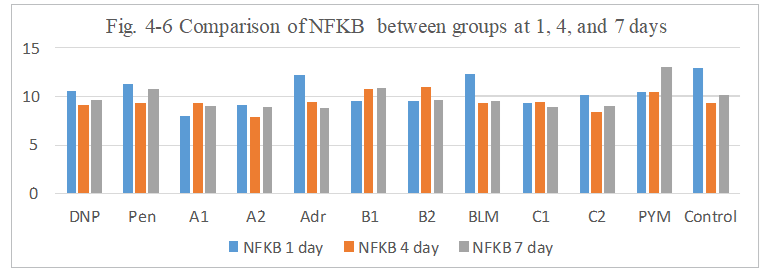
Figure 4-6: NFKB expression was compared with each group, it was found that all group has similarity in the induce of NFKB expression.
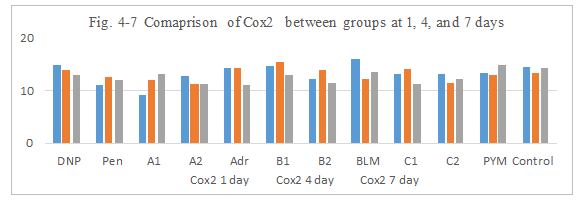
Figure 4-7: Cox2 expression was compared with each group, it was found that all group has similarity in the induce of Cox2 expression.
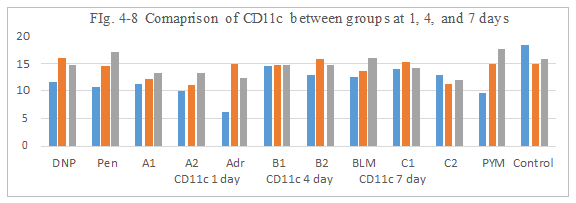
Figure 4-8: CD11 expression was compared with each group, it was found that all group has similarity in the induce of CD11 expression, group A1, A2, B1, B2, C1 and C2 all has a ability to induce the immunity reaction by CD11 activation and antigen presentation which was similarity hapten function of DNP and Penicillin.
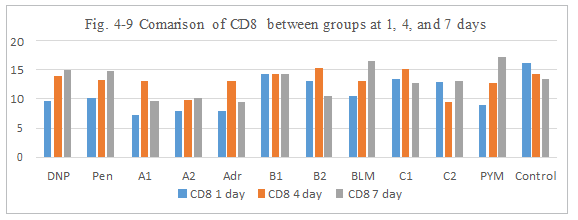
Figure 4-9: CD8 expression was compared with each group, it was found that all group has similarity in the induce of CD8 expression, group B1, B2, C1 has a ability to induce the immunity reaction by CD8 activation which was similarity hapten function of DNP and Penicillin.
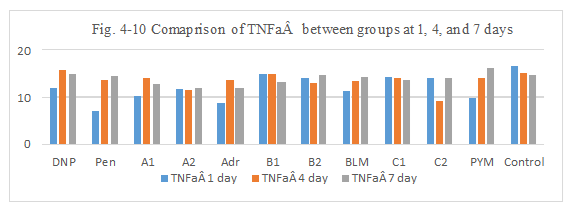
Figure 4-10: TNFa expression was compared with each group, it was found that all group has similarity in the induce of TNFa expression, group B1, B2, C1 has a ability to induce the immunity reaction by TNFa activation which was similarity hapten function of DNP and Penicillin.
Table 3.1: Comparison Expression of Colla1 Gene in Different Group After Intratumoral Injection with Hapten by qPCR Assay (Average CTs
Value & P value each to each)
Notes: Table 3-1 showed that expression of Colla 1 in each group of A1, A2, B1, B2 C1 and C2 were compared each other with hapten DNP, Pen and chemotherapy drug: Adr, BLM and PYM at day 1, day 4 and day 7, it was found that:
- A1 group does have significantly higher expression than the hapten and drugs alone, DNP(P<0.021); Pen(P<0.007); Adr(P<0.000); BLM(P<0.000); PYM(P<0.19) at day At day 4 and day 7, expression got less than that of day 1 and day 7; A1 group was compared with other group A2, B1, B2, C1 and C2, it was found that Colla 1 have an higher expression than A2(P<0.011), B2(P<0.012), C1(P<0.018) and C2(P<0.001) and control(P<0.003), at day 4 and day 7 there is only an significantly expression to B1, B2 and C1 (P< 0.000; 0.034 and 0.014), it indicated that A1 have a higher ability to induce the immunity reaction;
- A2 group does not have an higher expression comparing to hapten of DNP and Pen, BLM and PYM, only it was significantly higher than Adr group(P<0.043) at day 1; at day 4 and 7 there is an significantly higher expression than DNP alone(P<0.000;064), Pen alone(P<0.69; 0.078), Adr(P<0.000; 0.073), BLM(P<0.039; 0.001), PYM(P<0.007; 0.000); A2 group was compared with other group B1, B2, C1 and C2, it was found that there is no significantly higher at day 1; at day 4 there is all significantly higher than B1(P<0.000), B2(P<0.000), C1(P<0.000), C2(P<0.098) and control (P<0.004); at day 7 there is only higher expression for B1(P< 0.001) and control(P<0.000);
- B 1group dos not have an significantly higher expression comparing to hapten of DNP and Pen, it was only an significantly than Adr(P<0.039) at day 1; at day 4 there is all significantly higher expression DNP(P<0.001), Pen(P<0.000), Adr(P<0.007), BLM(P<0.001), PYM(P<0.000); at day 7 there is only an higher than PYM(P<0.000); comparing to other group, it was found that there is only no higher expression of any group at day 1, at day 4 there is a higher expression for all group of B2(P<0.005), C(P<0.016), C2(P<0.000) and control(P<0.000); at day 7 there is an higher expression for B2(P<0.0027) and C1(P<0.001);
- B2 group does have an significantly higher expression for Adr(P<0.000) and BLM(P<0.001) at day 1, Pen(P<0.011) and BLM(P<0.022) at day 4, BLM(P<0.026) and PYM(P<0.000) at day 7; comparing to other group C1 and C2, there is only higher expression for C2(P<0.021) and control(P<0.026) at day 1 and for C2(P<0.024) at day 4 and control(P<0.006) at day
- C1 group does have an significantly higher expression than Adr(P<0.009) and BLM(P<0.022) at day 1 and Pen(P<0.003), BLM(P<0.007) and PYM(P<0.039) at day 4, at day 7 there is all significantly higher expression than DNP(P<0.041), Pen(P<0.050), Adr(P<0.049), BLM(P<0.001) and PYM(P<0.000); comparing to other group C2 and control group, there is no significantly higher expression at day 1, but there is all higher expression than C2(P<0.009) and control(P<0.059) at day 4 and C2(P<0.010) and control(P<0.000) at day
- C2 group does not have an significantly higher expression at day 1, there is only a higher expression than DNP(P<0.067) and Adr(P<0.019) at day 4 and PYM(P<0.000) at day
Table 3.2: Comparison Expression of CD4 Gene in Different Group After Intratumoral Injection with Hapten by qPCR Assay (Average CTs
Value & P value each to each)
Notes: Table 3-2 showed that expression of CD4 in each group of A1, A2, B1, B2 C1 and C2 were compared each other with hapten DNP, Pen and chemotherapy drug: Adr, BLM and PYM at day 1, day 4 and day 7, it was found that:
- A1 group have no significantly higher expression comparing each of hapten of DNP(P<0.384) and Pen (P<0.781)and drugs of Adr(P<0.563), and PYM (P<0.394) at day 1 and day 4,but there is a higher expression only for BLM (P<0.018) at day 1; at day 7 the expression got higher than that of day 1 and day 4 with significantly to DNP(P<0.007),Pen (P<0.004),Adr (P<0.008),BLM (P<0.035) and PYM (P<0.000);it indicated that A1 group induced the immunity reaction A1 group was compared with other group A2, B1, B2, C1 and C2, it was found that CD4 have higher expression than A2 (P<0.005), C2 (P<0.032) and control(P<0.035) at day 1, at day 4 and day 7 there is only an significantly different to A2(P<0.038; P<0.0038), it indicated that A1 have a higher ability to induce the immunity reaction at day 1 to day 7;
- A2 group does have an significantly expression at day 1, 4 and 7 comparing to hapten of DNP(P<0.000; 007;0.000) and Pen(P<0.023;0.002;0.000), Adr(P<0.001;0.002;0.052), BLM(P<0.000;0.017;0.000) and PYM(P<0.000;0.005;0.000); A2 group was compared with other group B1,B2, C1, C2 and control, it was found that there is all significantly higher than other group(P<0.000);
- B1group does not have an significantly higher expression comparing to hapten of DNP and Pen, only it was an significantly than BLM(P<0.013), A2(P<0.001), C2(P<0.024) group at day 1; at day 4 there is only an significantly higher expression DNP(P<0.000), A2(P<0.000), C1(P<0.040), C2(P<0.018); at day 7 there is only an higher than DNP(P<0.018); Pen(P<0.009), Adr(P<0.000), PY (P<0.000), A2(P<0.0001);
- B2 group does have an significantly higher expression for A2(P<0.000), C2(P<0.021) and control(P<0.026) at day 1, at day 4 there is only significantly expression for BLM(P<0.042), A2(P<0.000), C1(P<0.022), C2(P<0.010), at day 7 there is significantly expression for Adr(P<0.000) and PYM(P<0.006) and control(P<0.006);
- C1 group does have an significantly higher expression than Adr(P<0.009) and BLM(P<0.022) at day 1 and Pen(P<0.003), BLM(P<0.007) and PYM(P<0.039), C2(P<0.009) and control(P<0.059) at day 4, at day 7 there is all significantly higher expression than DNP(P<0.041), Pen(P<0.050), Adr(P<0.049), BLM(P<0.001) and PYM(P <0.000) and control(P<0.000);
- C2 group does not have a significantly higher expression at day 1, there is only a higher expression than DNP(P<0.067) and Adr(P<0.019) at day 4 and PYM(P<0.000) at day
Table 3.3: Comparison Expression of IL12a Gene in Different Group After Intratumoral Injection with Hapten by qPCR Assay (Average
CTs Value & P value each to each)
Notes: Table 3-3 showed that expression of IL12a in each group of A1, A2, B1, B2 C1 and C2 were compared each other with hapten DNP, Pen and chemotherapy drug: Adr, BLM and PYM at day 1, day 4 and day 7, it was found that
- A1 group does have an significantly higher expression for DNP(P<0.018) and drugs of Adr(P<0.006), and PYM(P<0.004), no significantly higher expression for Pen(P<0.283) and PY (P<0.121), A2(P<0.830), C2(P<0.129) and control(P<0.059) at day 1; and all no significantly higher expression at day 4 for DNP(P<0.588), Pen(P<0.861), Adr(P<0.626), BLM(P<0.788), and PYM(P<0.668) and C2(P<0.002); at day 7 the expression got higher than that of day 4 with significantly to DNP(P<0.004),Adr(P<0.003), not for Pen (P<0.080), BLM(P<0.164), PYM(P<0.067), A2(P<0.000), B1(P<0.000), B2(P<0.095), C1(P<0.005), C2(P<0.000), it indicated that A1 have a higher ability to induce the immunity reaction at day 1 over to day 7;
- A2 group does have an significantly higher expression for DNP(P<0.033) and BLM(P<0.008), B1(P<0.035), C1(P<0.034) at day 1, at day 4 there is no significantly higher expression for DNP(P<0.116), Pen(P<0.421), Adr(P<0.642), BLM(P<0.195) and PYM(P<0.157) except for C2(P<0.010) and at day 7 there is only higher expression for Pen(P<0.026) and BLM(P<0.010), Pen(P<0.026) and BLM(P<0.010); (3) B1 group does have only an significantly higher expression for Pen(P<0.004) at day 1; at day 4 there is no any significantly higher expression for DNP(P<0.077), Pen(P<0.339), Adr (P<0.553), BLM(P<0.140), PYM(P<0.112) except for C2(P<0.008); at day 7 there is an significantly higher expression for Pen(P<0.009) and BLM(P<0.001) and PYM(P<0.048), B2(P<0.0017) and control(P<0.001);
- B2 group does have only an significantly expression for Pen(P<0.005) at day 1; at day 4 and day 7 there is no significantly higher expression for related hapten and drugs except for C2(P<0.000) at day 4 and C2(P<0.007) at day 7;
- C1 group does have only an significantly expression for Pen(P<0.003) at day 1, at day 4 and at day 7 there is no any significantly higher expression for hapten and drugs except for C2 (P<0.0.003) at day 4 and C2 (P<0.0.013) at day 7;
- C2 group does have an significantly expression for Pen(P<0.021) at day 1, at day 4 there is all significantly higher expression for related hapten and drugs(P<0.000); at day 7 there is a higher expression for Pen(P<0.004), Adr(P<0.031), BLM(P<0.001), PYM(P<0.018), A1(P<0.000), B2(P<0.007) and control(P<0.001).
Table 3.4: Comparison Expression of TGFb1Â Gene in Different Group After Intratumoral Injection with Hapten by qPCR Assay (Average
CTs Value & P value each to each)
Notes: Table 3-4 showed that expression of TGFb1Â in each group of A1, A2, B1, B2 C1 and C2 were compared each other with hapten DNP, Pen and chemotherapy drug: Adr, BLM and PYM at day 1, day 4 and day 7, it was found that:
- A1 group does have an significantly expression for Adr(P<0.001), BLM(P<0.025), C2(P<0.018) and control(P<0.043) at day 1, at day 4 there is all significantly expression for DNP(P<0.023), Pen(P<0.018), Adr(P<0.002), BLM(P<0.023), PYM(P<0.014), B1(P<0.000), B2(P<0.001), C1(P<0.000) and control(P<0.002); at day 7 there is only significantly expression for PYM(P<0.000);
- A2 group does not have an significantly expression for all factors related at day 1, at day 4 there is all significantly expression for all factors related except C2(P<0.588), it indicated that A2 group has a late effective for induce immunity reaction, at day 7 there is only an significantly expression for BLM(P<0.043), PYM(P<0.000) and B1(P<0.001);
- B1 group does not have an significantly expression for all drugs related each other at day 1 except Adr(P<0.027), at day 4 there is all significantly expression for all drugs related and show this TGFb1Â expression take a response later;
- B2 group does not have an significantly expression for all drugs related each other except Adr(P<0.002) and C2(P<0.031) at day1; at day 4 there is an significantly expression for A1(P<0.001), A2(P<0.000) , B1(P<0.021), C2(P<0.000); at day 7 there is only significantly expression for PYM(P<0.000);
- C1 group does not have an significantly expression for all drug related at day 1; at day 4 there is an significantly expression for A1(P<0.000), A2(P<0.000) and C2(P<0.000), at day 7 there is only an significantly expression for BLM P<0.000);
- C2 group do not have any significantly expression for all drug related at day 1 except for A1(P<0.018) and B2(P<0.031), at day 4 there is an significantly expression for DNP(P<0.043), Pen(P<0.034), Adr(P<0.003), BLM(P<0.044) and PYM(P<0.026), at day 7 there is only significantly express for PYM(P<0.00).
Table 3.5: Comparison Expression of Elastin Gene in Different Group After Intratumoral Injection with Hapten by qPCR Assay (Average CTs
Value & P value each to each)
Notes: Data on day 1 is not took placed for this research.
Table 3-5 showed that expression of Elastin in each group of A1, A2, B1, B2 C1 and C2 were compared each other with hapten DNP, Pen and chemotherapy drug: Adr, BLM and PYM at day 1, day 4 and day 7, it was found that:
- A1 group does not have an significantly expression for all drugs related each other(P>0.05) at day 4, at day 7 there is only an significantly expression for PYM(P<0.001);
- A2 group does have an significantly expression for Adr(P<0.001), B1(P<0.000), B2(P<0.022), C1(P<0.023) at day 4, at day 7 there is an significantly expression for DNP (P<0.001) and PYM(P<0.000);
- B1 group does have an significantly expression for Pen(P<0.030), BLM(P<0.019), A1(P<0.039), A2(P<0.000), C1(P<0.017);
- B2 group have only an significantly expression for A2(P<0.022) at day 4, at day 7 there is an significantly expression for BLM(P<0.012), PYM(P<0.000) and control(P<0.007);
- C1 group does not have any significantly expression for all drug related(P>0.05) except for A2(P<0.023) at day 4, at day 7 there is an significantly expression for BLM(P<0.011), PYM(P<0.000) and control(P<0.006);
- C2 does not have an significantly expression for all drug related except for B1(P<0.017) at day 4, at day 7 there is an significantly expression for DNP(P<0.003), PYM(P<0.002), B1(P<0.001).
Table 3.6: Comparison Expression of NFKB Gene in Different Group After Intratumoral Injection with Hapten by qPCR Assay (Average CTs
Value & P value each to each)
Notes: Table 3-6 showed that expression of NFKB in each group of A1, A2, B1, B2 C1 and C2 were compared each other with hapten DNP, Pen and chemotherapy drug: Adr, BLM and PYM at day 1, day 4 and day 7, it was found that
- A1 group does have an significantly expression for DNP(P<0.009), Pen(P<0.015), Adr(P<0.000), BLM(P<0.000), PYM(P<0.026), C2(P<0.037) and control(P<0.000) at day 1, at day 4 there is no significantly expression for DNP(P<0.859), Pen(P<0935), Adr(P<0.923), BLM(P<0.886) and PYM(P<0.101), but there is an significantly expression for group of A2 (P<0.026), B1(P<0.041), B2 (P<0.017), at day 7 there is an significantly expression for PYM (P<0.000) and B1(P<0.005);
- A2 group does have an significantly expression for Adr(P<0.019), BLM(P<0.009), and control(P<0.012) at day 1, at day 4 there is an significantly expression for all of drugs related DNP(P<0.012), Pen(P<0.009), Ad (P<0.005), BL (P<0.011), PYM(P<0.000), A1(P<0.026), B1(P<0.000), B2(P<0.000), C1(P<0.004), C2(P<0.000) and control(P<0.007) except C2(P<0.317), at day 7 there is an significantly expression for Pen(P<0.028) and B1(P<0.000);
- B1 group does have an significantly expression for Adr(P<0.025), BLM(P<0.010), and control(P<0.017) at day 1, at day 4 there is all significantly expression for DNP(P<0.007), Pen(P<0.010), Adr(P<0.018), BL (P<0.008), A1(P<0.041), A (P<0.000), C1(P<0.023), C2(P<0.000) and control(P<0.013) except B2(P<0.657) and PYM(P<0.606); at day 7 there is an significantly expression for Adr(P<0.000), BLM(P<0.024), PYM(P<0.001), A1(P<0.005), A2(P<0.000), C1(P<0.003), C2(P<0.006) except for DNP(P<0.070), Pen (P<0.089) and B2 (P<0.069);
- B2 group does have an significantly expression for Adr(P<0.014), BLM(P<0.004) and control(P<0.011) at day 1, at day 4 there is an significantly expression for DNP(P<0.002), Pen(P<0.003), Adr(P<0.005), BLM(P<0.002), A1(P<0.017), A2(P<0.000), C1(P<0.007), C2(P<0.000) and control(P<0.004) except for PYM(P<0.339) and B1(P<0.069), at day 7 there is only an significantly expression for PYM (P<0.000);
- C1 group does have an significantly expression for Adr(P<0.007), BLM(P<0.002) and control(P<0.007) at day 1, at day 4 there is an significantly expression for B1(P<0.023) and B2(P<0.007); at day 7 thee is an significantly expression for PYM(P<0.000) and B1(P<0.003);
- C2 group does have an significantly expression for Adr P<0.048), BLM(P<0.020), A1(P<0.037) and contro (P<0.031) at day 1, at day 4 there is an significantly expression for PYM(P<0.002), B1(P<0.000)and B2(P<0.000), at day 7 there is only an significantly expression for PYM(P<0.000).
Table 3.7: Comparison Expression of Cox2 Gene in Different Group After Intratumoral Injection with Hapten by qPCR Assay (Average CTs
Value & P value each to each)
Notes: Table 3-7 showed that expression of Cox2 in each group of A1, A2, B1, B2, C1 and C2 were compared each other with hapten DNP, Pen and chemotherapy drug: Adr, BLM and PYM at day 1, day 4 and day 7, it was found that :
- A1 group does have an significantly expression for DNP(P<0.000), Adr(P<0.000), BLM(P<0.000), PYM(P<0.000), A2(P<0.002), B1(P<0.000), B2(P<0.001), C1(P<0.000), C2(P<0.000) and control(P<0.000) except Pen(P<0.238) at day 1, at day 4 there is no significantly expression for DNP(P<0.136), Pen(P<0.669), Adr(P<0.923), BLM (P<0.879), PYM (P<0.453), A2 (P<0.364), B2 (P<0.129), C1 (P<0.073), C2 (P<0.516) and control (P<0.238), but there is an significantly expression for group of Adr(P<0.045), B1(P<0.008), at day 7 there is an significantly expression for Adr(P<0.025) and A2(P<0.041), there was no significantly differences in other expressions of groups;
- A2 group does have an significantly expression for DNP(P<0.026), BLM(P<0.001) and A1(P<0.002) at day 1, at day 4 there is an significantly expression for DNP (P<0.004), Adr(P<0.001), PYM (P<0.046), B1(P<0.000), B2(P<0.004), C1(P<0.001) and control(P<0.013), at day 7 there is an significantly expression for BLM(P<0.004), PYM(P<0.000), A1(P<0.041), B1(P<0.023) and control(P<0.001);
- B1 group does have an significantly expression for Pen(P<0.011), A1(P<0.000) and B2(P<0.012) at day 1, at day 4 there is all significantly expression for Pen(P<0.008), BLM(P<0.003), PYM(P<0.019), A1(P<0.008), A(P<0.000) and C2(P<0.017) except DNP(P<0.120), Adr(P<0.327), B2(P<0.128), C1(P<0.725) and control(P<0.670); at day 7 there is an significantly expression for Adr(P<0.011), PYM(P<0.048), A2(P<0.023) and C1(P<0.049);
- B2 group does have an significantly expression for DNP(P<0.002), BLM(P<0.000),A1(P<0.001) and B1(P<0.012) at day 1, at day 4 there is an significantly expression for A2(P<0.004) and C2(P<0.017), at day 7 there is only an significantly expression for BLM(P<0.021), PYM(P<0.001) and control (P<0.007).
- C1 group does have an significantly expression for DNP(P<0.022), BLM(P<0.001) and A1(P<0.000) at day 1, at day 4 there is an significantly expression for BLM(P<0.045), A2(P<0.001) and C2(P<0.007); at day 7 thee is an significantly expression for BLM(P<0.012), PYM(P<0.001), B1(P<0.049) and control(P<0.004).
- C2 group does have an significantly expression for DNP(P<0.022), BLM(P<0.001) and A1(P<0.000) at day 1, at day 4 there is an significantly expression for DNP(P<0.018), Adr(P<0.004), B1(P<0.001), B2 (P<0.017), C1(P<0.007) and control(P<0.042), at day 7 there is only an significantly expression for PYM(P<0.016).
Table 3.8: Comparison Expression of CD11b/c Gene in Different Group After Intratumoral Injection with Hapten by qPCR Assay (Average
CTs Value & P value each to each)
Notes: Table 3-8 showed that expression of CD11b/c in each group of A1, A2, B1, B2, C1 and C2 were compared each other with hapten DNP, Pen and chemotherapy drug: Adr, BLM and PYM at day 1, day 4 and day 7, it was found that :
- A1 group does not have an significantly expression for drug related each group at day 1, at day 4 there is an significantly expression for DNP(P<0.011), Adr(P<0.042), PYM(P<0.049), B2(P<0.018), C1(P<0.025) and control(P<0.042), at day 7 there is an significantly expression for Pen(P<0.000), BL (P<0.000), PYM(P<0.000), B1(P<0.019) and control (P<0.001);
- A2 group does not have significantly expression for all drugs related each others at day 1, at day 4 there is all significantly expression for DNP(P<0.000), Pen(P<0.004), Adr(P<0.001), BL (P<0.035), PYM(P<0.001), B1(P<0.002), B2(P<0.000), C1(P<0.000) and control(P<0.001) except A1(P<0.394) and C2(P<0.817), at day 7 there is all significantly expression for DNP(P<0.042), Pe (P<0.000), BLM(P<0.000), PYM(P<0.000), B1(P<0.009), B2(P<0.045) and control(P<0.000) except for Adr (P<0.131), A1(P<0.921), C1(P<0.121), C (P<0.114).
- B1 group does not have an significantly expression for all drugs related at day 1; at day 4 there is only an significantly expression for A1(P<0.018), A2(P<0.000) and C2 (P<0.001); at day 7 there is an significantly expression for Pe (P<0.011), Adr(P<0.000),PYM (P<0.000), A1(P<0.019), A2(P<0.009) and C2(P<0.000);
- B2 group does not have an significantly expression for all drugs related each other at day 1; at day 4 there is an significantly expression for A2(P<0.002) and C2(P<0.005); at day 7 there is only an significantly expression for Pen(P<0.012), Adr(P<0.001), PYM(P<0.001), A2(P<0.045) and C2(P<0.002);
- C1 group does not have an significantly expression for all drugs related each other at day 1; at day 4 there is an significantly expression for A2(P<0.000) and C2(P<0.001; at day 7 there is an significantly expression for Pen(P<0.007), Adr(P<0.006), BLM(P<0.035),PYM(P<0.000) and C2(P<0.008);
- C2 group does not have an significantly expression for all drugs related each other at day 1; at day 4 there is all significantly expression for DNP (P<0.001), Pen (P<0.009), Adr(P<0.002), PYM(P<0.003), B1(P<0.005), B2(P<0.001), C1(P<0.001) and control(P<0.002) except for BLM(P<0.067), A1(P<0.525) and C2(P<0.817); at day 7 there is all significantly expression for DNP(P<0.002), Pen(P<0.000), BLM(P<0.000), PYM(P<0.000), B1(P<0.000), B2(P<0.002),C1(P<0.008) and control(P<0.000) except for Adr(P<0.677), A1(P<0.177), A2 (P<0.114).
Table 3.9: Comparison Expression of CD8 Gene in Different Group After Intratumoral Injection with Hapten by qPCR Assay (Average CTs
Value & P value each to each)
Notes: Data on day 1 is not took for this research.
Table 3-9 showed that expression of CD8 in each group of A1, A2, B1, B2, C1 and C2 were compared each other with hapten DNP, Pen and chemotherapy drug: Adr, BLM and PYM at day 4 and day 7, it was found that?
- A1 group does have only significantly expression for A2(P<0.024) and C2(P<0.011) at day 4; at day 7 there is all significantly expression for DNP(P<0.000), Pen(P<0.001), BLM(P<0.000), PYM(P<0.000), B1(P<0.000), B(P<0.017), C1(P<0.017), C2(P<0.009) and control (P<0.002) except for Adr(P<0.797), A2(P<0.700).
- A2 group does have all significantly expression for DNP(P<0.002), Pen(P<0.004), Adr(P<0.006), BLM(P<0.016), PYM(P<0.015), A1(P<0.024), B1(P<0.000), B2(P<0.000), C1(P<0.000) and control(P<0.000) except for C2(P<0692) at day 4; and at day 7 there is all significantly expression for DNP(P<0.000), Pen(P<0.001), BLM(P<0.000), PYM(P<0.000), B1(P<0.000), B2(P<0.023) ,C1(P<0.023), C2(P<0.011) and Control(P<0.000) except for Adr(P<0.452), A2(P<0.700) .
- B1 group does have only an significantly expression for A2 (P<0.000) and C2 (P<0.000) at day 4; at day 7 there is an significantly expression for Adr (P<0.000), BLM(P<0.036), PYM(P<0.012), A1(P<0.000) and A2(P<0.000), there was no difference in the expression of other
- B2 group does have only an significantly expression for PYM(P<0.045), A2(P<0.000) and C2(P<0.000) at day 4; at day 7 there is all significantly expression for DNP(P<0.000), Pen(P<0.004), BLM(P<0.000), PYM(P<0.000), B1(P<0.000), C2(P<0.042) and control(P<0.010), there was no difference in the expression of other
- C1 group does have only PYM(P<0.041), A2(P<0.000) and C2(P<0.000) at day 4; at day 7 there is all significantly expression for Adr(P<0.004),BLM(P<0.002), PYM(P<0.001), A1(P<0.017) and A2(P<0.023). There was no difference in the expression of other groups.
- C2 group does have tan significantly expression for DNP(P<0.001), Pen(P<0.001), Adr(P<0.002), BLM(P<0.006), PYM(P<0.005), A1(P<0.011), B1(P<0.000), B2 (P<0.000), C1(P<0.000) and control(P<0.000) except for A2(P<0.692) at day 4, at day 7 there is all significantly expression for Adr(P<0.002), BLM(P<0.004), PYM(P<0.002), A1 (P<0.009), A2(P<0.011) and B2(P<0.042).
Table 3.10: Comparison Expression of TNFa Gene in Different Group After Intratumoral Injection with Hapten by qPCR Assay (Average CTs Value & P value each to each)
Notes: Table 3-10 showed that expression of TNFa in each group of A1, A2, B1, B2, C1 and C2 were compared each other with hapten DNP, Pen and chemotherapy drug: Adr, BLM and PYM at day 4 and day 7, it was found that?
- A1 group does not have an significantly expression for all drugs related each other at day 1; at day 4 there is only an significantly expression for C2(P<0.011); at day 7 there is all significantly expression for DNP(P<0.018), PYM(P<0.000), B2(P<0.034) and control(P<0.033);
- A2 group does not have an significantly expression for all drugs related each other at day 1; at day 4 there is only an significantly expression fro DNP(P<0.011), B1(P<0.015) and control(P<0.016); at day 7 there is an significantly expression for DNP(P<0.000), Pen (P<0.009), BLM (P<0.003), PYM (P<0.000), B1(P<0.040), B2 P<0.010), C1(P<0.025), C2(P<0.018) and control (P<0.001) except for Adr(P<0.954), A1(P<0.281).
- B1 group does not have an significantly expression for all drugs related each other at day 1; at day 4 there is only an significantly expression for A2 (P<0.015) and C2 (P<0.000); at day 7 there is all significantly expression for DNP(P<0.043), Adr(P<0.028), PYM(P<0.000), A2(P<0.040);
- B2 group does not have an significantly expression for all drugs related each other at day 1; at day 4 there is an significantly expression for only C2 (P<0.031), at day 7 there is an significantly expression for Adr (P<0.000) and A2 (P<0.001);
- C1 group does not have an significantly expression for all drugs related each other at day 1; at day 4 there is an significantly expression for C2 (P<0.004); at day 7 there is an significantly expression for Adr (P<0.019), PYM (P<0.101), A2 (P<0.025) and C2(P<0.009);
- C2 group does not have an significantly expression for all drugs related each other at day 1; at day 4 there is all significantly expression for DNP (P<0.000), Pen (P<0.009), Adr(P<0.004), BLM(P<0.013), PYM(P<0.002), A1(P<0.011), B1(P<0.000), B2(P<0.031), C1(P<0.004) and control(P<0.000) except for A2(P<0.149), at day 7 there is an significantly expression for Adr(P<0.013), PYM P<0.014) and A2(P<0.018).
locally. In the past years, research published outlined how hapten enhanced survival time in the treatment of advanced lung cancer, hepatocellular carcinoma, and late stage of pancreatic cancer by ultra-minimum incision personalized intratumoral chemoimmunotherapy (UMIPIC) can analyze the effect of this immune booster [14-16]. Another intriguing factor in the process of intra-tumoral chemotherapy is creating an in-situ vaccine depot in tumors with a tumor- specific antigen [4, 13]. Furthermore, UMIPIC can not only induce a tumor in-vivo vaccinate-like effect, but it also enhances systematic immunity due to the addition of hapten [17]. In fact, after intratumoral injection of a chemotherapy drug to a tumor, acute inflammation and tumor coagulation is induced. These effects provide the chance for an interaction of multiple tautologous tumor antigens, released from cell death and DC cells. This interaction can be a priming event for T cell or B cell response. Therefore, these clinical cases prove that the role of hapten is important in enhancing the immunological response of tumor associated antigens. DNP as a hapten for melanoma vaccine was proven in clinical test after dealing melanoma cells with 2, 4-dinitrophenol (DNP) and radiation killing in vitro. It showed an improved survival rate for patients and that DNP has a function of haptenation with tumor antigens [18]. However, DNP was not approved by the FDA as either as a drug or as a component in drug formulation.
Recently, research was published to compare of DNP and penicillin’s in vivo hapenation and vaccination. Quantitative PCR assays of the expression of the CoL1a1, CD4, IL12aÂ, TGFb1Â, Elastin, Elastin, Cox2, CD11b/c, CD8, TNFa genes in animals. This is further evidence that haptenation and vaccination is related to special inflammation in tumors. There are immunity reactions in different steps, and some samples were proven using a traditional immunohistochemical staining method. The result of the qPCR assay run in this study showed the changes of the contents of various fiber proliferations, inflammatory factor and factors related to immunity of C57BL/6 mice before and after CDP at day1, 4 and 7 (Table 3 and Figure 2). Thus, we concluded that the intratumor injection of the chemotherapy drug with DNP and penicillin hapten can cause significant expression of all genes of CoL1a1, CD4, IL12aÂ, TGFb1Â, Elastin, Elastin, Cox2, CD11b/c, CD8, TNFaÂ. There was variation in the expression of immunological genes when the different drugs were combined with the hapten components, DNP or penicillin, for injection. Experiment B1, with Adr and DNP, compared the expression of various genes on day 1, 4 and There was higher expression of CoL1a1, CD4, IL12aÂ, TGFb1Â, Elastin, Elastin, Cox2, CD11b/c, CD8, TNFa than in the untreated tumor of at day 1. Expression was especially high for CD 11bc, CD8 and TNFa at day 1, and then it immediately dropped to a lower level. This expression revealed that the immune response of new tumor antigens with CD 11c, CD8, TNFa occurred in the tumor antigens presentation and vaccination (Table 3.2 and Figure 2-1B1). The chemotherapy drugs or hapten components alone cannot induce any immunity response. Experiment B2, with Adr and Penicillin, compared the expression of various genes on day 1, 4 and 7. The results showed that the higher expression of CoL1a1, CD4, IL12aÂ, TGFb1Â, Elastin, Elastin, Cox2, CD11b/c, CD8, TNFa than the tumor untreated at day 1 only, then it immediately dropped to a lower level. However, it was still higher than the DNP group at day 4 and 7. CD11b/c, CD4 and CD8 were especially high at day 1, showing the immune response of new tumor antigens with CD11c, CD4 and CD8. The expression occurred in the tumor antigens presentation and vaccination (Table 3.2 and Figure 2-1B2). The immunological genes expression from DNP and penicillin, revealed that the two hapten components have similar function in haptenation with tumor antigens for stimulation of immunity reaction in mice with tumor, but penicillin has a high capability for stimulation of expression of CD4. Experiment C1, with BLM and DNP, compared the expression of various genes on day 1, 4 and 7. Results showed that CoL1a1, CD4, IL12aÂ, TGFb1Â, Elastin, Elastin, Cox2, CD11b/c, CD8, TNFa had a slightly higher expression in those days, than in the untreated tumor on day 1. The tumor antigens presentation and vaccination from DNP revealed the immune response of new tumor antigens with CoL1a1, CD4, IL12aÂ, TGFb1Â, Elastin, Elastin, Cox2, CD11b/c, CD8, TNFa (Table 3. C1 and Figure 2-2. C1). Therefore, when BLM replaces Adr in intratumoral injections with DNP, the BLM can still induce an immunity reaction in tumor bearing mice. Therefore, the chemotherapy drug role in damaging the tumor cell becomes apparent. It leads to a release of tumor antigens post-cell death. Thus, DNP plays a role in hapenation of tumor antigens to become neuantigens of tumor. Experiment C2, with BLM and penicillin, compared the expression of various genes on day 1, 4 and 7. Findings indicate that CoL1a1, CD4, IL12aÂ, TGFb1Â, Elastin, Elastin, Cox2, CD11b/c, CD8, TNFa have higher expression in those days than they do in the untreated tumor on day 1. There was an especially high expression of IL12aÂ, CD11b/c, TNFaÂ. It showed the immune response with the higher expression IL12aÂ, CD11b/c, TNFa by the tumor antigens presentation and vaccination with penicillin (Table 3. C2 and Figure 2-2. C2). The expression of CD4, CD8 and CD11 by qPCR assay correlated with the immunohistochemical staining of CD4, CD8 and CD11 (Figure 1). It showed it can act as an effective replacement the immunohistochemical staining by qPCR assay for the expression of factor related immune genes.
Both DNP and Penicillin with the chemotherapy drugs Adr or BLM, can induce the immunity reaction in tumor bearing mice. Experiment C2 used penicillin to induce the highest expression of CD11 and IL12aÂ, peaking in the value of CTs. This was higher than C1’s CT value. This difference may be attributed to the BLM combined with penicillin. The combination plays a strong partnership in the haptenation with tumor antigens released from tumor cell damaged by BLM and penicillin as hapten is reported in to stimulate hapenation [19]. These results are a good indication an example of what to use for a generic drug as a new indication of cancer treatment. Experiment D1, with PYM and DNP, compared the expression of various genes on day 1, 4 and Results showed that the expression of CoL1a1, CD4, IL12aÂ, TGFb1Â, Elastin, Elastin, Cox2, CD11b/c, CD8, TNFa was not higher on day 1, 4 or 7 when compared with the untreated tumor. Therefore, the immune response of new tumor antigens with the expression of various genes presented without an especially heightened expression of genes (Table3.4 and Figure 2-3 D1). Therefore, the D1 combination may not be a good candidate of combination for intratumoral injection in cancer treatment.
Experiment D2, with PYM and penicillin, compared the expression of various genes on day 1, 4 and 7. Results indicated that the expression of CoL1a1, CD4, IL12aÂ, TGFb1Â, Elastin, Elastin, Cox2, CD11b/c, CD8, and TNFa were higher in the other days than when the tumor was untreated. The especially heightened expression of IL12a at day 4 is notable. This shows that the immune response with the expression of various genes and the especially heightened expression of IL12aÂ, indicates that expression of IL12a is produced by the antigen presenting cell during of their interaction with specific T cell (Table 3.4 and Figure 2-3 D2). Comparison with the D1 treatment, which yielded the highest expression of IL12a is a good sign for the D2 combination in the cancer treatment which is late response and could contribute to long survival. The above intratumoral injection of different drug and hapten results, support penicillin a replacement for DNP in intratumoral injection with chemotherapy drug. It induces acute inflammation in tumors so tumor antigens can be modified by hapten to bring expression of immunological genes and their production of cytokines and autologous antibodies of tumor associate antigen. Ultimately this furthers the clinical abscopal effect.
Intratumoral injection of chemotherapy drug with DNP and penicillin can induce acute inflammation in tumors with a special immunity reaction. This inflammation provides strong evidence for the special immunity reaction induced effect while the chemotherapy drug kills the tumor cell, like the abscopal effect.
Competing Interests
There are no competing financial interests.
Data availability statement
The data that support the findings of this study are available from [third party name] but restrictions apply to the availability of these data, which were used under license for the current study, and so are not publicly available. Data are however available from the authors upon reasonable request.
Role of Sponsors
This study was sponsored by TaiMei Baofa Cancer hospital (Dongping, Shandong Province, China, 271500).
References
- Hoffman A S. The origins and evolution of ‘controlled’ drug delivery J Control Release 132 (2008): 153- 163.
- Bae Y H, Park K. Target drug delivery to tumor: Myths, reality and possibility. J Control Release 10 (2011): 198-
- Yu B and Fu Drug Mixed by H2O2 Injection Intratumoral to turning an Extracellular Matrix into Autologous Coagulum as Drug Depot. Novel Research in Sciences. Novel Research Science 584 (2020).
- Goldberg E P, Hadba A R, Almond B A, et Intratumoral cancer chemotherapy and immunotherapy: opportunities for nonsystemic pre-operative drug delivery. J Pharm Pharmacol 54 (2002): 159-180.
- Zhenlu M, Guanghui C, and Feng CT guide percutaneous needle lung interstitial therapy in the treatment of advanced non-small cell lung cancer. Chin J Interv Imaging Ther 10 (2020): 275-278.
- Yu B, Lu Y, Gao F, et al. Hapten-enhanced therapeutic effect in advanced stages of lung cancer by ultra-minimum incision personalized intratumoral chemoimmunotherapy Lung Cancer: Targets and Therapy 6 (2015): 1-11.
- Gao F, Jing P and Yu Hapten-enhanced overall survival time in advanced hepatocellular carcinoma by ultro-minimum incision personalized intratumoral chemoimmunotherapy. Journal of Hepatocellular Carcinoma 2(2015): 57-68.
- Jing P, Liu J, Li J, et Use of Hapten Combined Cytotoxic Drugs for Enhancing Therapeutic Effect in Advanced Stages of Pancreatic Cancer. Journal of Liver Research, Disorders & Therapy 1 (2015): 63-69.
- Yu B. A New Hope for Cancer Therapy with Liquid Knife & Immuno Therapy: Current Trends in Clinical & Medical Sciences 1 (2020).
- Kuang J, Yan X, Genders A J, et al. An overview of technical considerations when using quantitative real- time PCR analysis of gene expression in human exercise research 13 (2018): e0196438.
- Funato T and Funato T Quality assurance of quantitative PCR with real-time reverse transcription polymerase chain reaction. Method 54 (2006): 910-917.
- Fisher Scientific Guidelines for cDNA synthesis reactions.
- Goldberg E P, Almond BA, Hadba AR, et al. Nano- mesosphere drug carriers for localized cancer Technical Proceedings of the 2006 NSTI otechnology Conference and Trade Show 2 (2006): 1-4.
- Yu B, Lu Y, Gao F, et al. Hapten-enhanced therapeutic effect in advanced stages of lung cancer by ultra-minimum incision personalized intratumoral chemoimmunotherapy Lung Cancer: Targets and Therapy 6 (2015): 1-11.
- Gao F, Jing P and Yu Hapten-enhanced overall survival time in advanced hepatocellular carcinoma by ultro-minimum incision personalized intratumoral chemoimmunotherapy. Journal of Hepatocellular Carcinoma 2 (2015): 57-68.
- Jing P, Liu J, Li J, et Use of Hapten Combined Cytotoxic Drugs for Enhancing Therapeutic Effect in Advanced Stages of Pancreatic Cancer. Journal of Liver Research, Disorders & Therapy 1 (2015): 63-69.
- Goldberg E P, Hadba A R, Almond B et al. Intratumoral cancer chemotherapy and immunotherapy: opportunities for nonsystemic pre-operative drug delivery. J Pharm Pharmacol 54 (2002): 159-180.
- Taniguchi H, Takahashi T, Yamaguchi T, et al. Intra- arterial infusion chemotherapy for metastatic liver tumor using multipleanti-cancer agents suspended in a lipid contrast medium 64 (1989): 2001-2006.
- Lygidakis N J, Sgourakis G, Georgia D, et al. Regional Targeting Chemo immunotherapy in Patients Undergoing Pancreac Resection in an Advanced Stage of Their Disease: A Prospective Randomized Ann Surg 236 (2002): 806-813.
- Berd D, Sato T, HC M, et al. Immunopharmacologic analysis of an autologous, hapten-modified human melanoma J Clin Oncol 22 (2004): 403-415.
