Functional and Anatomical Characterization of Atrophic Age-Related Macular Degeneration in an Aged Mouse Model
Article Information
Stéphan Tobalem1, 2#, Mateusz Kecik1, 2#, Maëllie Midroit1, 2, 3, Djehna Scaldino4, 5, Sébastien Tardy4,5, Thais Bascuas1,2, Nina Harmening1, 2, Leonardo Scapozza4, 5, Gabriele Thumann1, 2*, Martina Kropp1, 2
#equal contribution
1Experimental Ophthalmology, University of Geneva, Geneva, Switzerland.
2Department of Ophthalmology, University Hospitals of Geneva, Geneva, Switzerland.
3Department of Fundamental Neurosciences, University of Lausanne, Switzerland.
4Pharmaceutical Biochemistry/Chemistry group, School of Pharmaceutical Sciences, University of Geneva, Geneva, Switzerland.
5Institute of Pharmaceutical Sciences of Western Switzerland, University of Geneva, Geneva, Switzerland.
*Corresponding Author: Gabriele Thumann. Department of Ophthalmology, University Hospitals of Geneva, Geneva, Switzerland.
Received: 11 April 2021; Accepted: 19 April 2021; Published: 22 April 2021
Citation:
Stéphan Tobalem, Mateusz Kecik, Maëllie Midroit, Djehna Scaldino, Sébastien Tardy, Thais Bascuas, Nina Harmening, Leonardo Scapozza, Gabriele Thumann, Martina Kropp. Functional and Anatomical Characterization of Atrophic Age-Related Macular Degeneration in an Aged Mouse Model. Journal of Ophthalmology and Research 4 (2021): 128-152.
Share at FacebookAbstract
Purpose: To develop an animal model of atrophic age-related macular degeneration (aAMD) in aged mice that more closely mimics the natural progression of the disease. Methods: 12- and 18-month-old CBl57/6JRj mice were immunized with murine serum albumin (MSA) conjugated with carboxyethyl pyrrole (CEP). The immunization, given into the hock, was followed by 3 booster injections into the neck over a 3-month period. Immunized mice and age-matched controls were trained for a visual discrimination and an optokinetic response task to determine the objective visual threshold (OVT) at arrival and at 3 months; funduscopy and ocular coherence tomography were performed. After sacrifice, the eyes were enucleated for histological, immunofluorescent and electron microscopy analyses. Results: Retinal imaging confirmed that all mice had normal retinas upon arrival. Three months after mice were immunized the normal retinal age-related alterations were significantly more pronounced in CEP-immunized than in control mice as evidenced by drusenoid alterations, increased retinal thickness, immune activation, signs of retinal degeneration, decreased OVT. Electron microscopy indicated degeneration of the retinal pigment epithelium (RPE). Conclusions: The retinal and behavioral changes in the aged CEP-immunized mice will be useful for the investigation of novel treatments of aAMD. Translational relevance: The enhanced Aged-CEP-Mouse model enables the generation of results highly transferable to human patients and promotes the development of efficient, safe AMD therapies.
Keywords
Macular
Article Details
1. Introduction
In industrialized countries excellent health care and progress in medicine have increased life expectancy and the number of elderly people [1], with concomitant increase of age-related diseases such as age-related macular degeneration (AMD) [2]. It is estimated that the number of patients suffering from early and late AMD will increase from 15 and 2.7 Mio, respectively, to 21.5 and 4.8 Mio respectively by 2040 [3]; approximately 80% of these patients will suffer from atrophic AMD (aAMD). No current approved therapies are available to treat aAMD. Even though several promising treatment approaches are being considered, which focus on visual cycle modulation, neuroprotection, suppression of inflammation and complement inhibition [4], progress is hampered by the absence of an appropriate animal model.
A significant cause for age-related diseases, including aAMD, is cellular oxidative stress with the resultant accumulation of reactive oxygen species, which damages and causes cell death [2]. Several animal models of aAMD have been developed; however, animal models that develop choroidal neovascularization (CNV) [5-7], which is not a feature of aAMD are time-consuming [6,7] or cause rapid retinal degeneration [7,8] are not suited for the analysis of therapeutic approaches that endeavor to interfere with the development of aAMD at an early stage of the disease.
Hollyfield et al. developed a model of aAMD in mice by immunizing 2-month-old mice with carboxy-ethylpyrrole coupled to murine serum albumin (CEP-MSA); CEP is an oxidation adduct produced from docosahexaenoic acid and is elevated in the vitreous and plasma of aAMD patients [9,10]. Here, we report a modification of the model of aAMD that Holyfield developed in young mice [9,10] by modifying the immunization protocol and using old mice establishing a model of aAMD that better recapitulates to the human disease without accompanying adverse events and thus, permits the generation of results highly transferable to human patients, which promotes the development of new aAMD therapies.
2.Methods
2.1 Chemicals
Isoflurane (Baxter AG, Deerfield, USA); Ketamine (Ketalar®, Pfizer, New York, USA); Medetomidine (Domitor®, Orion Pharma, Dhaka, Bangladesh); NaCl (Laboratrium Dr. G. Bichsel, Unterseen, Switzerland); Thiopental Inresa (Ospedalia AG, Hünenberg, Switzerland); complete (CFA) and incomplete (IFA) Freund’s adjuvants (Santa Cruz Biotechnology, Dallas, USA); glutaraldehyde (GDA, Polysciences, Warrington, USA); cacodylate buffer, osmium tetroxide, propylene oxide, Epon and N-benzyl-dimethylamine, paraformaldehyde (PFA), Dulbecco’s Phosphate Buffered Saline (PBS), hemalum (Haemalum Mayer's) solution for microscopy, eosin (Eosin Y), citrate acid monohydrate, BSA, Tween 20 (Merck, Darmstadt, Germany); Vectamount (Vector Laboratories, Burlingame, CA, USA); ProLong™ Gold Antifade Mountant with DAPI (ThermoFisher Scientific, Waltham, MA, USA); MSA was kindly provided by Prof. Scapozza (University of Geneva, Geneva, Switzerland).
2.2 Reagents and Analytical Procedures for the Synthesis of CEP-conjugated MSA
All reagents for the synthesis were purchased from Sigma-Aldrich (Merck, St Louis, Missouri) with a purity greater than 98% and used without prior purification. Anhydrous solvents kept over 4 Å molecular sieves (Acroseal® 100 mL bottles) were used for reactions (ThermoFisher Scientific, Waltham, MA, USA). Solvents of analytical or HPLC grade were used for purifications and reaction treatments (ThermoFisher Scientific, Waltham, MA, USA). For working under inert conditions argon (PanGas 6.0 quality, Dagmersellen, Switzerland) was used. Flash chromatographic purifications were performed on an automated Grace Reveleris® apparatus and using a pre-packed silica gel column (FlashPure® ID Silica 4 g or 12 g, 0.040-0.060 mm mesh, Büchi Labortechnik, Flawil, Switzerland). Reactions were monitored by thin layer chromatography (TLC) on precoated silica gel plates (Merck silica gel 60 F254) and observed with a UV lamp at 254 nm and 366 nm. A Bruker Avance III HD 600 MHz NMR (Nuclear Magnetic Resonance) spectrometer equipped with a QCI 5 mm Cryoprobe and a SampleJet automated sample changer (Bruker BioSpin, Rheinstetten, Germany) was used to perform 1H and 13C DEPTQ (Distortionless Enhancement by Polarization Transfer including detection of quarternary carbons) NMR experiments. Names of compounds follow IUPAC rules and molecules are drawn by ChemDraw Professional software (version 16.0). All chemical shifts are expressed in parts per million (ppm) relative to the peak of deuterated chloroform (CDCl3). The following abbreviations are used to explain the observed multiplicities of signals: s, singlet; d, doublet; dd, doublet of doublet; ddd, doublet of doublet of doublet; t, triplet; td, triplet of doublet; q, quadruplet; m, multiplet. The device used to record low resolution mass spectra (LRMS) was an Advion ExpressionL CMS operating in electrospray positive and negative mode (ESI) simultaneously.
2.3 Animals and immunization
Male 12 and 18-months old CBL57/6JRj mice (Janvier Labs, Le Genest Saint Isle, France) were housed at the University of Geneva animal facility under standard animal facility conditions on a 12 h light/dark cycle, with food and water available ad libitum. For short-term anesthesia mice were placed for 30-60 sec in a gas-tight, acrylic glass box containing 5% isoflurane and 95% O2. Long-lasting anesthesia was induced by intraperitoneal (i.p.) injection of Ketamine (75 mg/kg) and Medetomidine (0.36 mg/kg) diluted 1:2 in 0.9% NaCl. Animals were sacrificed by an overdose of Thiopental Inresa (150 mg/kg i.p.). Animal experiments were approved by the cantonal Département de la sécurité, de l'emploi et de la santé, Domaine de l’expérimentation animale, Geneva, Switzerland (no. GE/82/18) and complied with the ARVO Statement for the Use of Animals in Ophthalmic and Vision Research.
The immunization procedure is based on studies of Hollyfield et al. [9,10] and Kamala et al. [11]. Briefly, animals were injected subdermally (s.d.) into the hocks with CEP-MSA, emulsified in CFA followed with 3 booster injections in the neck with CEP-MSA in IFA at 10, 20 and 90 days. Tolerability of the procedure was documented qualitatively in a score sheet based on criteria including weight, spontaneous standing on back legs, local signs of inflammation, general agility, fur, and grimace scale.
2.4 Synthesis of CEP-conjugated MSA
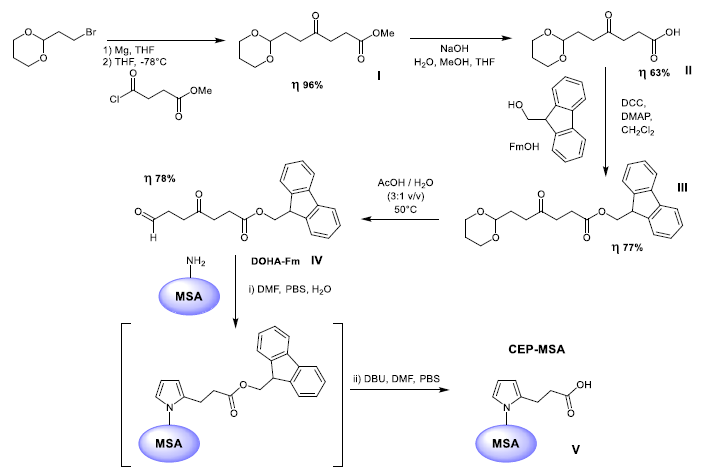
The strategy for grafting the CEP entity onto MSA has been inspired by the synthesis work published by Salomon et al. [12] and Lu et al. [13]. Briefly, the synthesis consists of five steps (Figure 1). The first 4 steps of the CEP-conjugated albumin synthesis consist in the synthesis of 9-fluorenylmethyl (Fm) ester of 4,7-dioxoheptanoic acid (DOHA) to be then coupled via Paal-Knoor reaction to the activated MSA during step number 5. The first 4 steps were performed under inert atmosphere of argon while the fifth step was performed in PBS. Reactions were monitored by TLC and compounds were purified by flash chromatography. The identity of each synthetized product was assessed by 1H and 13C DEPTQ NMR and LRMS. 1H and DEPTQ 13C NMR spectra as well as LRMS analysis are provided in supplementary material. The purity was evaluated from the quality of the 1H NMR spectra and monitored by chromatography.
2.5 In vivo retinal imaging and intraocular pressure (IOP) measurement
Before funduscopy and ocular coherence tomography (OCT), five IOP measurements were done in non-sedated mice and the mean calculated automatically using the Tonovet® device (Icare, Vantaa, Finland). Anesthetized mice were then placed on a heated platform with an attached fundus camera interchangeable with an OCT objective (iVivo® Small Animal Funduscope and iVivo® Small animal OCT system, Ocuscience, Henderson, USA). Alternatively, OCT was performed using the Spectralis® HRA+OCT (Heidelberg Engineering GmbH, Heidelberg, Germany). The uEye Cockpit software version 4.91.0000 (IDS Imaging Development Systems GmbH, Obersulm, Germany) recorded fundus videos, while the Discovery InSightTM software recorded a series of ≥ 32 OCT images (Ocuscience, Henderson, USA). The examinations were done before immunization (M0), at three (M3) and eight (M8) months post-immunization. Retinal thickness was determined from OCT images and expressed in arbitrary units (AU); choroid thickness was assumed to be stable and used to align OCT images from both the Ocuscience and the Spectralis devices; retinal thickness values measured at a distance of 1.2 AU from the optic nerve (ON) head from Ocuscience-derived images were corrected using a factor of 1.4.
2.6 Determination of the objective visual threshold (OVT)
OVT was quantified as optokinetic (OKT) and visual perceptual thresholds (VPT); OKT analyzes an involuntary response (OKT) while VPT adds a psychophysical dimension. In both cases the frequency of bars measured in cycles per degree (c/d) was used to quantify OVT; the higher the frequency, the higher is the OVT. OKT [14, 15] was analyzed on a platform enclosed by four monitors showing bars of different frequencies circling around the platform (OptoMotry HD, Cerebral Mechanics Inc., Medicine Hat, Alberta, Canada). The shift in frequency provokes a reflexive eye and head movement known as optokinetic response. Six tests/mouse/day were performed, repeated 3 times and the mean highest frequency was recorded as OKT. Visual perception and memory (VPT) were determined as bars shown as stimulus on a monitor in increasing frequencies in a water visual discrimination task [15] (Acumen, Cerebral Mechanics Inc., Medicine Hat, Alberta, Canada). A platform beneath the active monitor takes advantage of the fact that rodents are instinctive swimmers but prefer to escape from water. The tank is Y-shaped filled with 22°C tap water containing milk powder to conceal the escape platform; mice released at the foot of the Y, have to choose which arm of the Y will lead to the platform and escape from the water, indicated by the active monitor. Before determination of VPT, mice were familiarized with the tank equipment and trained for 7 days; each training session comprised 12 runs with distance from tank entry to platform increasing from first to last run. Training started with a stimulus of 0.052 c/d (square stimulus shown in a pseudo-random sequence) and comprised 36 runs/day until a success rate of ≥ 90% was reached; tired mice were given a 5-10 min rest period, or the training stopped. During determination of VPT, the frequency was increased after every successful completion of a set of 3 stimuli (≥ 2 correct out of 3 choices). A ≥ 70% success rate was considered the VPT.
2.7 Toluidine staining and electron microscopy Tissue processing and electron microscopy were done according to Dosso et al. [16]. Briefly, globes were fixed in 2% PFA and 1% GDA in 0.1 mol/L cacodylate buffer. The posterior segment was post-fixed for an additional 5 h at RT in 2.5% GDA, rinsed in 0.1 M cacodylate buffer, and incubated for 60 min in 0.5% osmium tetroxide in cacodylate buffer. The fixed tissue was dehydrated, perfused by propylene oxide and Epon (1:1) overnight at RT, embedded in Epon with N-Benzyl-dimethylamine (50:1) and polymerized at 60°C for 2-3 d. Semi-thin sections (1 µm) were stained with toluidine blue and thin sections (0.08 µm) with uranyl acetate and lead citrate.
2.8 H&E and immunofluorescent staining
For histology, globes were fixed in 4% PFA at RT. After 24 h, the globes were rinsed in PBS, dehydrated through an ascending EtOH series, embedded in paraffin, rehydrated in a descending EtOH series and 5 µm thin sections prepared. The sections were stained with hemalum (4 min), washed with tap water (40°C, 2 min), rinsed in EtOH with 0.4% HCl (37%) and stained with 0.25% eosin (3 min). After repeated dehydration, sections were mounted using Vectamount. For antigen retrieval, sections were boiled for 10 min in citrate buffer (citrate acid monohydrate 0.01 M, pH 6.0 in H2O dist.) before blocking in 3% PBS-BSA and 0.1% Tween 20 for 45 min at RT. Sections were incubated overnight at 4°C with primary antibodies followed by incubation with the secondary antibodies for 1 h at RT in the dark, stained with DAPI and mounted. The primary and secondary antibodies used diluted in 3% PBS-BSA are detailed in Table 1. Vitronectin expression was quantified by determining the average gray value of a standardized area placed in the center of the micrographs, using ImageJ v1.53c (NIH, USA); the gray value indicates the brightness of a pixel and the mean, reported in arbitrary units, is calulated by converting each pixel to grayscale. To quantify C3, a score scheme “(Table2)” was designed to evaluate all micrographs. For vitronectin and C3, at least 3 images per animal were analyzed. The “In Situ Cell Death Detection Kit® Fluorescein” (Merck) was used to detect apoptotic cell death in paraffin-embedded retinal sections according to the manufacturer’s instructions.
2.9 Statistics
Statistical analysis was performed using GraphPad Prism v8.4.3 (GraphPad Software, San Diego, CA, USA). A D’Agostino-Pearson normality test was performed to determine sample distribution. Differences in OVT, retinal and choroid thickness were calculated by performing a Kruskal-Wallis and Dunn’s multiple comparison post-tests or using a Mann-Whitney test, while vitronectin and C3 were analyzed using an ANOVA and Tukey’s multiple comparison post-tests. The rate of fundus abnormalities was analyzed by performing a Chi-square test for trend. Data are expressed as mean ± SD and a p-value of <0.05 was considered statistically significant; only significant differences are reported in the text and shown in the graphs by asterisks.
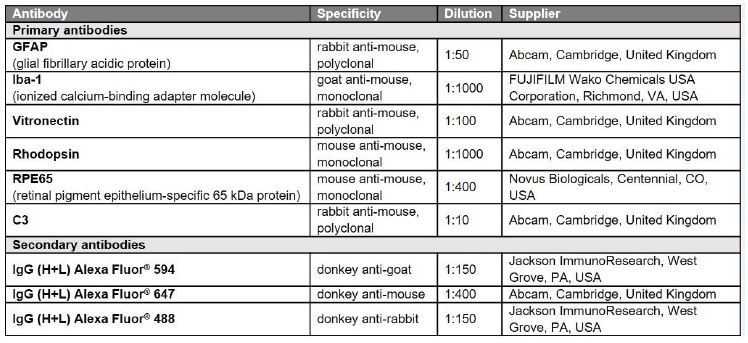
Table 1: Antibodies used in the study.
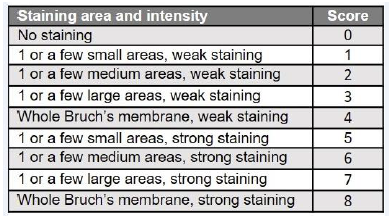
Table 2: Score scheme for semi-quantitative expression analyses of C3.
The score has been created to include all information of the micrographs in the analysis but excluding false positives by background or autofluorescence (e.g. erythrocytes).

Table 3: Optimized immunization technique.
CEP-MSA, CEP-conjugated mouse serum albumin; CFA, complete Freund’s adjuvant; IFA, incomplete Freund’s adjuvant; s.d., subdermal.
3.Results
3.1 Optimized immunization protocol for aged mice To improve transferability of the CEP aAMD model [9,10] to the human condition and refine the protocol according to 3R rules [17,18], a new immunization regimen was used in ≥12 months old mice (Table 3). Even though immunization of rodents by footpad injection, which is painful, reduces mobility and risks infection, is not recommended, it is still used [19-22].
Kamala et al. proposed the hock as an alternative injection site [11], which we have used to optimize the
CEP-MSA immunization protocol. On day 0, thirty mice of 12 (n=10) and 18 months (n=20) of age were
injected with 200 µg CEP-MSA emulsified in 120 µL CFA, 60 µL in each hock; 40 aged-matched untreated mice served as controls (AgM). At 10, 20 and 90 days, experimental mice received a booster injection s.d. in the neck containing 100 µg CEP-MSA suspended in 60 µL IFA. Mice were anesthetized using the sedative and analgesic Medetomidine in combination with Ketamine since anesthesia with Ketamine plus Xylazin produced keratopathy in 25% of CBL57/6JRj-aged mice, whereas Ketamine plus Medetomidine produced keratopathy in only 1.7% of the mice (unpublished data). Hock immunization and the low concentration of CEP-MSA used for the booster injections resulted in excellent tolerability with no adverse events observed and no difference in mobility between control and immunized mice.
3.2 Preparation of CEP-conjugated protein
Protein modifications in which the e-amino group of lysyl residues is combined into a 2-CEP using the well-known, efficient Paal-Knoor synthesis, have been developed a few years ago. However, efforts at preparing the corresponding CEP derivatives of proteins by treatment with unprotected DOHA generally caused precipitation and aberrant reactivity. Indeed, Lu et al. [13], observing the absence of the characteristic CHO signal in 1H NMR, postulated that was probably due to an intramolecular cyclization into a spirolactone hemiacetal of the starting material giving instability compared to what is obtained in the case of longer chain carboxyalkylpyrroles. Consequently, Salomon et al. [12] and Lu et al. [13] reported an efficient synthesis of CEP derivatives, which is specific and efficient for proteins. Their key finding was that the protected DOHA 9-fluorenylmethyl ester reacts with primary amines to provide 9-fluorenylmethyl esters of CEP-modified proteins that can be later deprotected in situ with a weak base like 1,8-diazabicyclo [5.4.0] undec-7-ene (DBU) instead of classical piperidine without causing protein denaturation. The optimized synthetic route developed by Salomon et al. [12] and Lu et al. [13] and used for the synthesis of the CEP-MSA in this work is summarized in Figure 1.
3.3 Synthesis of DOHA-Fm
A Grignard reagent derived from 2-(2-bromoethyl)-1,3-dioxane was acylated with methyl 4-chloro-4-oxobutanoate to afford the methyl ester (I) in a 96% good yield. The desired ester 9H-fluoren-9-ylmethyl-4,7-dioxo-heptanoate (DOHA-Fm, (IV)) was then obtained after three additional steps. Firstly, a saponification to release the free carboxylic acid (II) was performed. Then, the new esterification with 9-fluorenylmethanol (FmOH) protecting group was carried out using 1.2 equiv of FmOH under stirring for 19 h. The full protected compound (III) was delivered in 77% yield after a single column chromatography on silica gel. Finally, the acetal cleavage in acidic media at 50°C for 5 h provided the keto-aldehyde DOHA-Fm (IV) as a crystalline solid after drying in vacuum and cooling in the fridge. Protocols and purifications followed are taken from the previous papers [12,13]. The key intermediates have been characterized by 1H, 13C and LRMS to assess their identity and are shown in the text here (Figures 11-15).
3.4 Synthesis of CEP-MSA adducts (V) by Paal-Knoor synthesis from DOHA-Fm
The last step of the synthesis is the insertion of the CEP motif on MSA via a Paal-Knoor reaction using the freshly prepared key intermediate DOHA-Fm (IV) (Figure 1). To do so, we used strictly and rigorously the methodology developed by Lu et al. [13], of which here are the main steps in a few words: A DOHA-Fm solution (18.5 mg, 0.055 mmol) in anhydrous DMF (8 mL) was added slowly to a solution of 100 mg MSA in 18 mL of 10 mM PBS (pH 7.4). One equivalent of DOHA-Fm was used for each lysine group present in MSA. The mixture was stirred under argon for 4 days. Then, 360 mL of DBU was added to the mixture and stirred overnight under argon. Then, low molecular weight contaminants were removed by successive dialysis: first, two 24 h dialyses (Mr cutoff 14000) against 1 L 20% DMF in 10 mM PBS (pH 7.4) followed by two additional dialyses (24 h each) against 1 L of 10 mM PBS (pH 7.4) at 4°C. Analytically, enzymatic digestion with fragment analysis by LC-MS / MS was carried out. The sequence coverage of the LC-MS/MS (Liquid Chromatography-Tandem Mass Spectrometry) analysis was excellent. This study revealed characteristic fragments possessing respectively 1, 2 or 3 CEP moieties on lysyl residues demonstrating that CEP-MSA was formed. The fragmentation as well as the observed recurrences were in agreement with those described by Lu et al. [13]. It should also be noted that no CEP-Fm units were detected after deprotection with DBU showing the effectiveness of the dialysis-based purification method. Finally, the final protein concentration was determined by the Pierce bicinchoninic acid (BCA) protein assay.
3.5 Determination of OKT and VPT
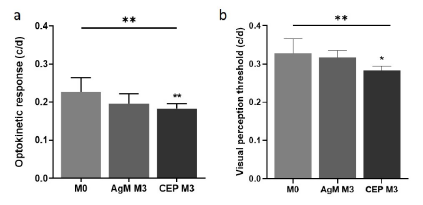
To examine how structural retinal modifications affect and whether they are associated with functional visual impairments, OVT was determined using two complementary tasks, i.e., OKT and VPT. A statistically significant decrease in OKT was observed in both CEP-MSA immunized and control mice, specifically from 0.2263 c/d in pre-immunized 12-month-old to 0.1960 c/d in 15-month-old control mice (AgM M3) and to 0.1827 c/d in 15-month-old CEP mice (CEP M3). A Kruskal-Wallis variance analysis revealed a significant difference between the groups (p=0.0018); post-hoc comparisons additionally revealed a significant decrease from “M0” to “CEP M3” (p=0.0038) (Figure 2a). A similar statistically significant decrease in the VPT (p=0.0075) was evident from 0.3280 c/d pre-immunization (12-month-old) to 0.3176 c/d in 15-month-old control mice and to 0.2839 c/d in 15-month-old CEP mice (p=0.0155) (Figure 2b).
3.6 Retinal imaging and intraocular pressure (IOP) determination
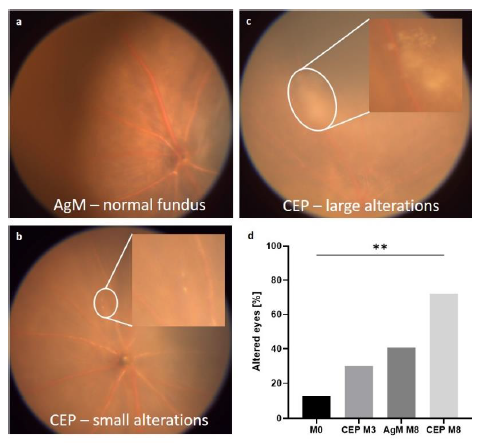
Funduscopy and OCT were performed in 12- and 18-month-old mice upon arrival (M0) at our animal facility and repeated at 3 (M3) and 8 months (M8) post-immunization. From videos of the fundus a screenshot was captured that showed the optic nerve head, central and peripheral retina. Pathological alterations were enumerated and categorized as small or large lesions (Figure 3 a-c) and the percentage of eyes per group with drusenoid alterations was calculated (Figure 3d). In normal animals the number of eyes with pathological alterations of the fundus increased with age from 12.50% (18-month-old, M0) to 40.63% (26-month-old, M8) whereas in CEP-treated mice the increase by percentage in pathological alterations with age was 72.20% (26-month-old, M8) “(p=0.0043)” OCT was done immediately after funduscopy and images were recorded with the optical nerve (ON) head at the center.
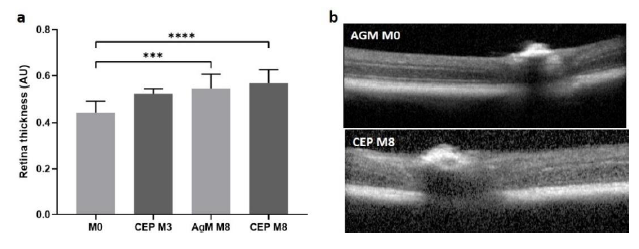
The best image in terms of sharpness, centrality of the ON head and cell layer visibility was chosen from each mouse to quantify retinal thickness expressed as arbitrary units (AU), measured at 1.2 AU left or right from the ON head. Retinal thickness increased with age and the increase was more pronounced in CEP-treated mice (ANOVA: p<0.0001). Mean retinal thickness was 0.44 AU at M0 and increased to 0.55 AU at M8 in AgM mice. In CEP mice, thickness was 0.44 AU at M0 and increased to 0.53 AU at M3 and to 0.57 AU at M8 post-immunization (M0 vs. AgM M8: p=0.0004; M0 vs. CEP M8: p<0.0001) (Figure 4a). Immunization did not affect the intraocular pressure (IOP) (AgM: 8.3±1.5 mmHg; CEP: 8.1±0.7 mmHg; p=0.5809).
3.7 Histology, immunofluorescence, and electron microscopy
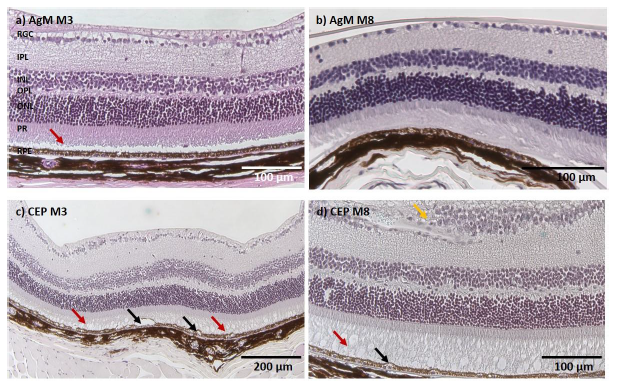
Figure 5 shows representative micrographs of retinal sections of AgM and CEP mice at M3 and M8. In the upper row two retinal sections from control mice show a slight photoreceptor (PR) outer segment disorganization without other signs of degeneration (Figure 5a, b); all retinal layers are present and identifiable. The bottom two micrographs from CEP mice show retinas with significant degeneration, increased thickness and less organized retinal cell layers indicative of an inflammatory response. PR outer segments (POS) are disorganized or degenerated, creating large vacuoles; the RPE shows vacuolization and swelling. The retinal degeneration was visible at 3 months post-immunization (M3) and became more pronounced by 8 months post-immunization (M8), with obvious PR degeneration, accumulation of subretinal deposits, cell migration, fibrotic remodeling in the retinal ganglion cell (RGC) layer and evident vacuolization of RPE and PR cells. Hypertrophic RPE cells suggest pyknotic cell death.
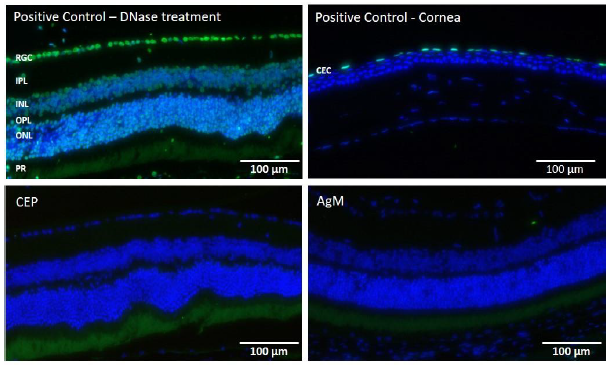
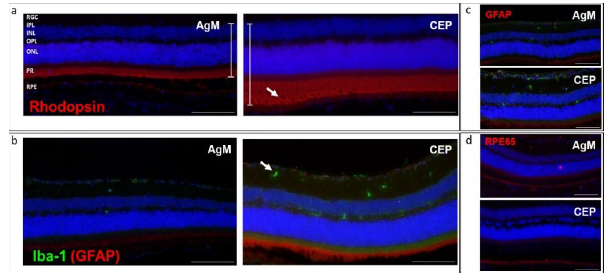
To determine the presence of apoptotic cells, TUNEL staining was performed on PFA-fixed retinal sections and two positive controls (Fig. 6, upper row: cornea, left panel; DNase-treated retina, right panel). In the DNase-treated retina positive control, all cell nuclei are TUNEL-positive while in the cornea positive control, apoptotic cells can be found only in the surface layer of the corneal epithelium (CEC) that is regularly replaced. No apoptotic cells were identified in retinas from either AgM or CEP mice at any time point, (Figure 6 lower row). A panel of antibodies was used for immunofluorescent characterization of inflammatory reactions of the retina, specifically GFAP, Iba-1; rhodopsin was used to examine PR degeneration; RPE65 was used to examine RPE cell status; vitronectin and C3 were used to
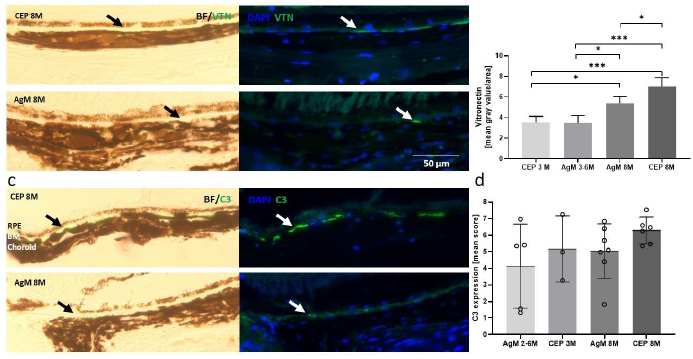
examine for the presence of subretinal deposits. It is evident from Figures 7a and b that there is an approximately 50% thickening of the retina following CEP-MSA immunization, which is most obvious for the outer nuclear (ONL) and layer PR; also note the disorganization, holes and loss of POS. Iba-1 staining revealed increased microglia (green) in CEP retinas (Figure 7b). No differences in GFAP and RPE65 expression were observed in CEP-immunized retinas (Figure 7c). Vitronectin, a known constituent of drusen, was found subretinally between the PR and the RPE at 3 months; the expression of vitronectin increased with age between 3 months and 8 months (AgM 3M vs. AgM 8M, mean difference 1.910, p=0.0418; CEP 3M vs. CEP 8M, mean difference 3.494, p=0.0002) and the increase was significantly larger in CEP-MSA immunized mice at 8 months (AgM 8M vs. CEP 8M, mean difference, 1.639 p=0.0207) (Figure 8a, b). Similar trends were obtained for the expression of C3; however, the differences are not statistically significant (Figure 8c, d).
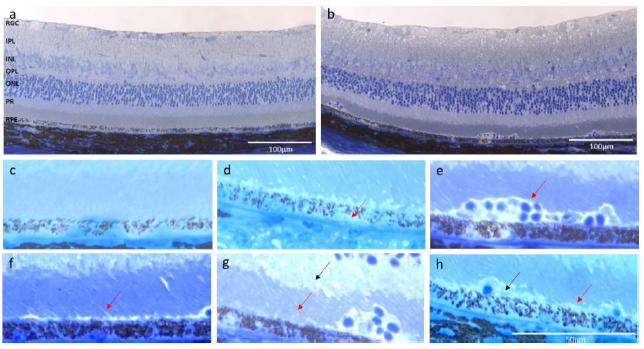
3.8 Toluidine staining and electron microscopy: Toluidine-stained semi-thin sections and uranyl acetate and lead citrate-stained thin sections of retinas from one CEP-treated and one age-matched control mouse at 3 months post-immunization were analyzed for CEP-induced alterations by light and electron microscopy, respectively. Figure 9a and b illustrate the toluidine blue-stained retinal morphology of the control and CEP-treated mice; note the increased thickness of the retina of the CEP-treated mouse (Figure 9b). Increased thickness of the OPL, optic nerve (ONL) and RGC layers are shown at a higher magnification (Figure 9c). RPE layer degeneration in CEP-treated retinas is apparent (Figure 9d) evidenced by holes, vesiculation and cell lysis. Figure 9e demonstrates invasion at the PR-RPE association zone by what are likely immune cells. PR are swollen and degenerated in both, the inner and outer segment layer (Figure 9f, g). Debris accumulation is evident beneath the PR layer (Figure 9h).
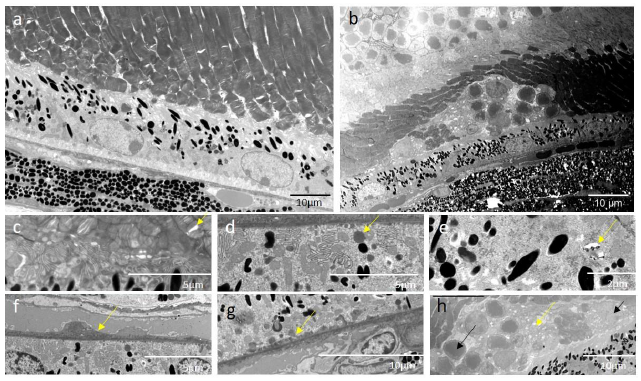
Electron microscopic micrographs from the control mouse retinas do not show significant signs of degeneration; however, we observed PR outer segment integrity loosening that suggests minor, age-related structural modifications (Figure 10a). In the CEP-treated retina, degeneration is obvious (Figure 10b), disruption and disorganization of the PR layer (Figure 10c) are present, as well as the accumulation of lipid droplets in the RPE cells, cystic structures and vacuoles (Figure 10d, e), the thickened Bruch’s membrane (Figure 10f), and laminar deposits accumulated at the PR-RPE connection zone and at the Bruch’s membrane-RPE border (Figure 10g). Infiltrating cells migrate to the RPE-PR intermatrix, disrupting cell connections and the normal retinal architecture (Figure 10h).
- a) In the visual discrimination task, VPT differs significantly between groups (p=0.0075) with an additional significant decrease in the multi-comparison post-test from M0 to CEP M3 (p=0.0155). Data are expressed as mean±SD (n=3-10).
- b) The OKT differs significantly between groups (p=0.0018) and decreased significantly in CEP mice M3 compared to M0 (p=0.0038), while the decrease in AgM controls was not significant. OVT, objective visual threshold; OKT, optokinetic threshold; VPT, visual perception threshold.
The fundi of AgM controls and CEP mice were monitored at M0, M3 and M8; lesions were identified from screenshots and enumerated. a) Fundus of an AgM mouse at M8; no pathological alterations are visible. b) Fundus of a CEP animal at M3; small yellow spots are visible (magnified in the insert), which are probably drusen deposits. c) At M8, the size and number of drusen bodies increased in CEP mice. The insert shows a magnified area with large drusen deposits. d) Quantification shows drusen deposits in 12.50% of retinas at M0, which increased to 40.63% in AgM and to 72.2% in CEP mice at M8 (p=0.0043**). All images are representative for their respective groups. Data are shown as mean±SD of n=8-11 animals/group.
a) OCT measurements were done at M0, M3 and M8. Retinal thickness quantified in AU increased with increasing age; for AgM retinal thickness was 0.44 AU at M0 and 0.55 AU at M8, p=0.0004. Retinal thickness for CEP-treated mice was 0.53 AU at M3 and 0.57 AU at M8, p<0.0001). The difference in retinal thickness between control and CEP-treated mice at M8 was not statistically significant. b) The upper panel shows a control retina at M8 and the bottom panel shows a retina from a CEP-treated mouse at M8. Data are shown as mean±SD of n=8-11 animals/group.
- a) The retina of a 15-month-old AgM mouse at M3 shows a slight POS disorganization (red arrow); however, all retinal layers are present and intact without signs of degeneration. b) At M8 (AgM) there is still only a slight disorganization of the POS without other signs of inflammation or degeneration. c) The CEP retina at M3 (15-month-old) shows increased retinal thickness, disorganized POS with large holes, vacuolization and swelling of RPE cells (black arrows).
- d) POS in CEP retina at M8 are almost completely degenerated (red arrow) and increased RPE degeneration (black arrow) is evident. The RGC layer is swollen with an accumulation of cells and fibrotic remodeling (yellow arrow). Micrographs are representative of n=8-9 animals/group (Magnification of 200x).
Both, cornea and retina of mice pre- and post-immunization were stained. The upper row, left, illustrates a retina treated with DNase showing a high number of TUNEL positive cells (green). On the right, a representative cornea from a CEP mouse shows few apoptotic corneal epithelial cells, indicating normal cell replacement. The lower two panels show representative retinas of a CEP (left) and an AgM mouse (right) at M8 (20-month old) without any evidence of apoptotic cells. The control cornea and the CEP-retina are from the same animal. Micrographs are representative of n=4-6 animals/group (Magnification of 200x).
a) Rhodopsin (red) staining of retinas of CEP mice illustrates the increased retinal thickness, especially evident in the PR and ON layers (white bars); PR degeneration (white arrow) is evident. b) Iba-1 staining (green) revealed an increase in migration and activation of microglia in retinas of CEP mice, mainly in the inner (IPL) and outer (OPL) plexiform layers (white arrow). c) GFAP (red), indication of inflammatory processes, was only weakly expressed in The Muller cells of AgM and CEP mice. d) Similar levels of RPE65 (red) was expressed in both groups of animals. The micrographs in the figure are from retinas of AgM and CEP mice without reference to age, since no age-dependent differences were observed. Micrographs are representative of n=8-10 animals/group (Magnification of 200x).
a) Panels are brightfield and DAPI-stained retinal images merged with images of sections stained with anti-VTN (green) from an AgM control (bottom) and a CEP mouse (top) at 8 months after immunization (26-month-old); note the increase in the expression of VTN. b) Retinal brightfield and DAPI-stained sections stained with anti-C3 from an AgM control (bottom) and a CEP mouse (top) at 8 months after immunization (26-month-old); note the increase in the expression of C3. Arrows indicate VTN and C3 expression. b-d) Quantitative analyses revealed a statistically significant age-related increase in VTN expression (AgM 3M vs. AgM 8M: p=0.0418) as well as a larger increase at 8 months in retinas of immunized mice (AgM 8M vs. CEP 8M p=0.0207) (Magnification of 400x). Similar trends were obtained for C3 expression, but the differences were not statistically significant.
a) Normal retina from an AgM control animal. All layers are distinguishable, POS are present and intact, and the RPE shows no signs of degeneration. b) The retina of the CEP-mouse shows increased thickness; the OPL and the RGC layers seem especially thicker. The organization of PR seemed less regular. Cells have migrated into the tissue and accumulated at the PR-RPE association zone, where the RPE shows holes and irregularities. c) The enlarged section of the micrograph a) shows that the PR and RPE cell layers are normal without visible cell or outer segment degeneration. d) The enlarged area of micrograph b) shows signs of degeneration, i.e., holes in the RPE layer (arrow), vesiculation and cell lysis. e) Note the accumulated, migrated cells in the PR-RPE association zone (arrow), swollen PR (arrow), f) PR lost their stringent order in both, the outer (red arrow) and inner segment layer (black arrow). g) Loss of the PR-RPE connection (red arrow) and deposition of debris (black arrow) are evident. Magnification: 200x.
Electron microscopy from ultra-thin sections (0.8 µm) illustrates the ultrastructural pathological modifications in the retina of CEP-treated mice at M3. a) The micrograph shows a representative region of the retina of an AgM control mouse. No significant signs of degeneration are visible; however age-related early-stage structural modifications, i.e., loosening of PR outer segment integrity, are present. b) Cross-section of the retina of the CEP mouse shows morphological disorganization. c) Disruption (yellow arrow) and disorganization of POS. d) Lipid droplets (yellow arrow) in RPE cells. e) Cystic and vacuolar structures (yellow arrow) in RPE cells. f) Thickened Bruch’s membrane (yellow arrow). g) Accumulation of laminar deposits (yellow arrow) at the Bruch’s membrane-RPE border, h) Deposits (yellow arrow) and cell (black arrow) infiltration in the RPE-PR intermatrix, disrupting inter-cell connections. Magnification: 1900-2000x
1H, 13C and LRMS characterization of the key intermediates
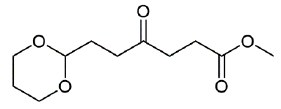
Figure 11: methyl 6-(1,3-dioxan-2-yl)-4-oxohexanoate (1H and 13C characterization).
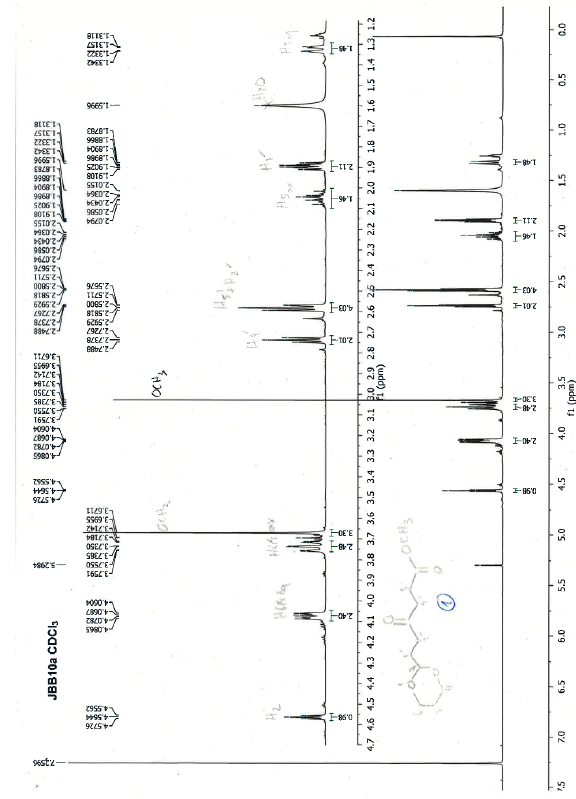
Chemical Formula: C11H18O5. Molecular Weight: 230.26 g.mol-1. 1H NMR (600 MHz, CDCl3) δ 4.56 (t, J = 4.9 Hz, 1H), 4.07 (dd, J = 10.7, 5.0 Hz, 2H), 3.74 (td, J = 12.4, 2.5 Hz, 2H), 3.67 (s, 3H), 2.74 (t, J = 6.6 Hz, 2H), 2.60 - 2.56 (m, 4H), 2.09 - 2.00 (m, 1H), 1.89 (td, J = 7.3, 5.0 Hz, 2H), 1.35 - 1.30 (m, 1H) ; 13C NMR (151 MHz, CDCl3) δ 208.4 (C=O), 173.4 (COO), 101.0 (CH), 67.0 (CH2), 51.9 (OCH3), 37.3 (CH2), 36.8 (CH2), 29.1 (CH2), 27.9 (CH2), 25.9 (CH2) ; MS (ESI)+ m/z : 253.1 [M+Na]+.
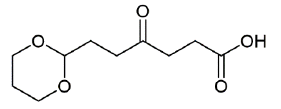
Figure 12: 6-(1,3-dioxan-2-yl)-4-oxohexanoic acid (1H and 13C characterization).
Chemical Formula: C10H16O5. Molecular Weight: 216.23 g.mol-1. 1H NMR (600 MHz, CDCl3) δ 4.57 (t, J = 4.9 Hz, 1H), 4.07 (dd, J = 10.8, 5.0 Hz, 2H), 3.74 (td, J = 12.4, 2.3 Hz, 2H), 2.74 (t, J = 6.5 Hz, 2H), 2.63 (t, J = 6.5 Hz, 2H), 2.58 (t, J = 7.2 Hz, 2H), 2.10 - 1.99 (m, 1H), 1.90 (td, J = 7.2, 4.9 Hz, 2H), 1.33 (dt, J = 13.5 Hz, 1H) ; 13C NMR (151 MHz, CDCl3) δ 208.4 (C=O), 177.1 (COOH), 100.9 (CH), 67.0 (CH2), 37.0 (CH2), 36.7 (CH2), 29.1 (CH2), 27.7 (CH2), 25.9 (CH2) ; MS (ESI)+/- m/z : 239.0 [M+Na]+, 271.0 [M+MeOH+Na]+, 471.0 [2M+K]+, 214.9 [M-H]-.
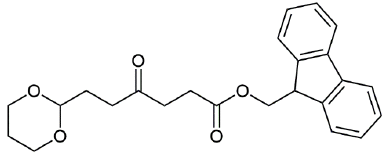
Figure 13: (9H-fluoren-9-yl) methyl 6-(1,3-dioxan-2-yl)-4-oxohexanoate (1H and 13C characterization).
Chemical Formula: C24H26O5. Molecular Weight: 394.47 g.mol-1. 1H NMR (600 MHz, CDCl3) δ 7.77 (d, J = 7.6 Hz, 2H), 7.60 (d, J = 7.5 Hz, 2H), 7.40 (t, J = 7.4 Hz, 2H), 7.32 (td, J = 7.4, 0.9 Hz, 2H), 4.56 (t, J = 4.9 Hz, 1H), 4.38 (d, J = 7.2 Hz, 2H), 4.22 (t, J = 7.2 Hz, 1H), 4.07 (dd, J = 10.7, 5.0 Hz, 2H), 3.73 (td, J = 12.4, 2.4 Hz, 2H), 2.73 (t, J = 6.8 Hz, 2H), 2.67 (t, J = 6.9 Hz, 2H), 2.56 (t, J = 7.2 Hz, 2H), 2.10 - 2.00 (m, 1H), 1.90 (td, J = 7.2, 4.9 Hz, 2H), 1.35 - 1.30 (m, 1H) ; 13C NMR (151 MHz, CDCl3) δ 208.33 (C=O), 172.89 (C=O), 143.94 (C), 141.44 (C), 127.92 (CH), 127.27 (CH), 125.22 (CH), 120.15 (CH), 100.97 (CH), 66.98 (CH2), 66.70 (CH2), 46.92 (CH), 37.21 (CH2), 36.74 (CH2), 29.12 (CH2), 28.14 (CH2), 25.88 (CH2) ; MS (ESI)+ m/z : 417.0 [M+Na]+, 433.0 [M+K]+.
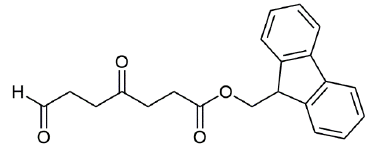
Figure 14: (9H-fluoren-9-yl) methyl 4,7-dioxoheptanoate (1H and 13C characterization).
Chemical Formula: C21H20O4. Molecular Weight: 336.39 g.mol-1. 1H NMR (600 MHz, CDCl3) δ 9.79 (s, 1H), 7.77 (d, J = 7.5 Hz, 2H), 7.59 (d, J = 7.5 Hz, 2H), 7.41 (t, J = 7.5 Hz, 2H), 7.32 (t, J = 7.4 Hz, 2H), 4.39 (d, J = 7.1 Hz, 2H), 4.22 (t, J = 7.1 Hz, 1H), 2.80 - 2.72 (m, 6H), 2.69 (t, J = 6.4 Hz, 2H) ; 13C NMR (151 MHz, CDCl3) δ 206.76 (C=O), 200.46 (CHO), 172.74 (COO), 143.89 (C), 141.44 (C), 127.93 (CH), 127.27 (CH), 125.19 (CH), 120.16 (CH), 66.70 (CH2O), 46.91 (CH), 37.64 (CH2), 37.09 (CH2), 34.74 (CH2), 28.14 (CH2) ; MS (ESI)+ m/z : 337.1 [M+H]+, 359.1 [M+Na]+.
4. Discussion
Recent studies have shown the importance of chronic oxidative damage, inflammation, immune dysregulation, and lipid metabolism in aAMD pathophysiology [4]. The successful transfer of new treatments from bench to bedside depends on suitable in vivo models that correspond as much as possible to the human condition. The ideal model of aAMD should reliably reproduce disease pathophysiology and phenotype while being inexpensive, easy, and rapid to generate, and respect animal welfare. In addition, critical parameters to ensure transferability are immunity (complement regulation), anatomy (retinal structure), and treatment regimen considering the complex interplay of species, strain, age, trigger, symptoms, induction stimulus and follow-up time [7].
Several animal models have been developed mimicking human aAMD using genetic modifications, pharmacological or physical stimuli [6]. Murine models that are most similar to human aAMD are the Ccl/r2-/-, Ccl2/Cx3cr1-/-, SOD2 knock-down (KD), mcd transgenic and NRF2-/- genotypes and the “CEP model”. However, none of these models fully reproduces all the characteristics of aAMD and show all conditions of an optimal animal model. The mcd transgenic, as well as the chemokine-acting models Ccl/r2-/- and Cx3cr1-/-, manifest AMD features slowly over 9 months. the Ccl2-/-/Cx3cr1-/- double KO develop the disease at 6 weeks but 15% of the animals develops CNV [5,6,8]. Other models have been developed, e.g. light stimulation and sodium iodate injection models, that, in a few days (1-7 days), manifest significant retinal degeneration [20,23,24]; however, these models, which have the advantage of limiting animal suffering, only mimic the final disease stage. The senescence accelerated OXYS rat model mimics the human pre-atrophic stage of aAMD at the young age of 1. 5-4 months with signs of inflammation, drusen, and atrophic alterations in the RPE and choriocapillaris and presents irreversible degenerative damages including hemorrhagic detachment and neovascularization at 24 months [21] that are not found in the human disease. The SOD2 KD model, which is complex to generate and responsible for early animal death [22], causes increased CEP levels, which are known to be elevated in the plasma and vitreous of aAMD patients [25,26]. CEP, an oxidation adducts produced from the docosahexaenoic acid, is generated following dysfunctions of the Nrf2 pathway [22].
The orginal “CEP model” by Hollyfield [9,10] is a murine model where 2-month-old mice were immunized with CEP-MSA. Animals were divided into a “short-term” group receiving a strong immunological challenge over three months and a “long-term” group inoculated with a weaker challenge over one year. Immunized mice developed antibodies to CEP, fixed C3 in BM, accumulated drusen below RPE during aging, showed decreased a- and b-wave amplitudes in response to light, and developed lesions in the RPE mimicking geographic atrophy [9,10]. The model presents many advantages: no secondary neovascularization, relatively rapid and “physiologic” disease progression [9,10]. However, the model that Hollyfield developed in young animals does not consider age-related influences of human aAMD that typically occur in aged patients.
To model disease progression that takes into account ageing in human aAMD, we have modified the Hollyfield CEP model [9,10] by using 12- or 18-month-old C57BL/6J mice [27]. We found that immunization with CEP-MSA induces symptoms of aAMD disease within 90 days, i.e., thickening of Bruch’s membrane, sub-RPE deposits, drusenoid structures, RPE hypoplasia/atrophy, complement deposition, immune cell accumulation and PR atrophy [7,9,10]. The CEP-old-mouse model reproduces the pre-atrophic stages of aAMD including the influence of age. It is also less traumatic for the animal injecting CEP-MSA into the hocks [11] instead of the foot pad and by injecting smaller quantities into both hocks. All 30 mice used in our study tolerated the procedure without signs of pain and side effects, despite their advanced age. The symptoms resembled a mixture of the short-term and the long-term models presented by Hollyfield et al. [9,10] combining a maximum immune response with an age-related increase of symptoms. In Hollyfield’s short-term model, RPE alterations, i.e., vesiculation, swelling of cells, C3 presence and cell death, were observed whereas thickening of Bruch’s membrane was only observed in the long-term model. In our model we also observed significant vesiculation, cystic structures, lipid droplet accumulation (Figures 5, 9-10), Bruch’s membrane thickening, and complement C3 expression (Figure 8). We observed PR swelling, disorganization and degeneration accompanied by invading cells, which accumulated at the RPE-PR intermatrix like the monocytes observed by Hollyfield et al. [10] in the short-term model. Basal deposits and drusenoid structures, documented for the long-term model, were observed in the present model by H&E (Figure 5) and toluidine blue (Figures 9) staining; we also observed increased vitronectin and C3 expression (Figure 8); drusenoid structures and a thickened retina were observed by funduscopy and OCT (Figures 3-4). The retinal thickening that we have observed by microscopy (Figures 4-5, 7) has not been reported in several other models [23,24,28,29]; however, these models are end-stage aAMD models with atrophy and cell death as prominent disease features, while the model we have developed reproduced the pre-atrophic stage of human aAMD that comprised cell swelling and vesiculation as shown in other models [30]. Similarly, we did not observe apoptotic cell death (Figure 6) as reported in other models [23,29]. In that sense, Hollyfield et al. detected propidium iodide positive RPE cells assuming rather necrotic processes in this phase of the disease.
In addition to the morphological alterations, we have found that there is an age-related decrease in the OVT that is greatly increased in CEP-treated mice, based on the visual perceptual test (VPT) and optokinetic threshold test (OKT) (Figure 2). In general, AgM controls demonstrated retinal alterations analogous to CEP mice that progressed with age, but the retinal alterations in CEP-treated mice were substantially greater; for example, vitronectin and C3 expression at the Bruch’s membrane was present in 15-21-month-old control mice (Figure 8), but the expression was increased significantly in CEP mice (vitronectin AgM 8M vs. CEP 8M, p=0.0207). A limitation of the results reported here is the small group size. The strength of the study, i.e., development of the disease in aged mice similar to human aAMD patients, allows transferability to humans, though the analysis of the immunization effect in CEP-immunized retinas discrete from age-related alterations may be impeded in aged mice. Thus, the enhanced Aged-CEP-Mouse model is of high translational relevance promoting the development of efficient and safe aAMD therapies.
In conclusion, the age-related model of aAMD we have reported here, recapitulates the alterations observed in human retinas of early aAMD including drusenoid structures, thickening of Bruch’s membrane, RPE and PR degeneration, as well as some loss of vision, which has been observed in early aAMD patients. These alterations in the Aged-CEP-Mouse model that mimic early human aAMD, makes the model ideally suited to test innovative early aAMD treatment strategies.
Acknowledgements
A special thanks goes to Dr. Remo Perozzo† who initiated the collaboration between the Pharmaceutical Biochemistry/Chemistry group and the Experimental Ophthalmology group, and to Mr. Alain Conti (Department of Ophthalmology, University Hospitals of Geneva, Geneva, Switzerland) for his excellent technical assistance especially in (immuno-) histologic staining and in vivo experimentation.
Conflicts of interest
The Authors declare that there is no conflict of interest in this study.
Funding
The work has been funded by the Swiss National Science Foundation (SNSF), grant no. 31003A_160195.
References
- Kontis V, Bennett J E, Mathers C D, et al. Future life expectancy in 35 industrialised countries: projections with a Bayesian model ensemble. The Lancet 389 (2017): 1323-1335.
- Moldogazieva N T, Mokhosoev I M, Mel'nikova T I, et al. Oxidative Stress and Advanced Lipoxidation and Glycation End Products (ALEs and AGEs) in Aging and Age-Related Diseases. Oxidative medicine and cellular longevity (2019): 3085756.
- Colijn, J M, Buitendijk G H S, Prokofyeva E, et al. Prevalence of Age-Related Macular Degeneration in Europe. The Past and the Future. Ophthalmology 124 (2017): 1753-1763.
- Hanus J, Zhao F, Wang, S. Current therapeutic developments in atrophic age-related macular degeneration. The British journal of ophthalmology 100 (2016): 122-127.
- Ross R J, Zhou M, Shen D, et al. Immunological protein expression profile in Ccl2/Cx3cr1 deficient mice with lesions similar to age-related macular degeneration. Experimental eye research 86 (2008): 675-683
- Combadière C, Feumi C, Raoul W, et al. CX3CR1-dependent subretinal microglia cell accumulation is associated with cardinal features of age-related macular degeneration. The Journal of clinical investigation 117 (2007): 2920-2928.
- Pennesi M E, Neuringer M, Courtney R J. Animal models of age-related macular degeneration. Molecular aspects of medicine 33 (2012): 487-509.
- Tuo J, Zhou M, Shen D, et al. Murine Ccl2/Cx3cr1 Deficiency Results in Retinal Lesions Mimicking Human Age-Related Macular Degeneration. Invest Ophthalmol Vis Sci 48 (2007): 3827-3836.
- Hollyfield J G, Bonilha V L, Rayborn M E, et al. Oxidative damage-induced inflammation initiates age-related macular degeneration. Nature medicine 14 (2008): 194-198.
- Hollyfield J G, Pere V L, Salomon R G. A hapten generated from an oxidation fragment of docosahexaenoic acid is sufficient to initiate age-related macular degeneration. Molecular neurobiology 41 (2010): 290-298.
- Kamala, T. Hock immunization: A humane alternative to mouse footpad injections. J Immunol Methods 328 (2007): 204-214.
- Salomon Robert G, Crabb J W, Jaffe K D, et al. Preparation of fluorenylmethyl masked-carboxyethylpyrrole-linker acids and esters and carboxyethylpyrrole-linker-carrier derivatives. PCT Int. Appl. (2008).
- Lu L, Gu X, Hong L, et al. Synthesis and structural characterization of carboxyethylpyrrole-modified proteins: mediators of age-related macular degeneration. Bioorganic & medicinal chemistry 17 (2009): 7548-7561.
- Prusky G T, Alam N M, Beekman S, et al. Rapid quantification of adult and developing mouse spatial vision using a virtual optomotor system. Investigative ophthalmology & visual science 45 (2004): 4611-4616.
- Prusky G T, Silver B D, Tschetter, et al. Experience-dependent plasticity from eye opening enables lasting, visual cortex-dependent enhancement of motion vision. The Journal of neuroscience: the official journal of the Society for Neuroscience 28 (2008): 9817-9827.
- Dosso A A, Leuenberger P M, Rungger-Brändle E. Tissue processing, electron microscopy, morphometric measurements and statistics were performed as detailed in a previous study [29]. Briefly, enucleated eyes were immersionfixed in 2.5% glutaraldehyde in 0.1 mol/l cacodylate buffer (pH 7.4) containing 0.2% tannic acid, washed in the same Remodeling of retinal capillaries in the diabetic hypertensive rat. Invest Ophthalmol Vis Sci 40 (1999): 2405-2410.
- Richter H, Karol A, Nuss K, et al. Comparison of hock- and footpad-injection as a prostate adenocarcinoma model in rats. BMC veterinary research 14 (2018): 327.
- Schmerler P, Jeuthe S, Lauer D, et al. Mortality and morbidity in different immunization protocols for experimental autoimmune myocarditis in rats. Acta physiologica (Oxford, England) 210 (2014): 889-898.
- Shenoy G. N, Chatterjee P, Kaw S, et al. Recruitment of memory B cells to lymph nodes remote from the site of immunization requires an inflammatory stimulus. Journal of immunology 189 (2012): 521-528.
- Bhutto I A, Ogura S, Baldeosingh R et al. An Acute Injury Model for the Phenotypic Characteristics of Geographic Atrophy. Invest Ophthalmol Vis Sci 59 (2018): AMD143-AMD151.
- Markovets A M, Saprunova V B, Zhdankina A A, et al. Alterations of retinal pigment epithelium cause AMD-like retinopathy in senescent-accelerated OXYS rats. Aging 3 (2011): 44-54.
- Handa J T. How does the macula protect itself from oxidative stress? Molecular aspects of medicine 33 (2012): 418-435.
- Natoli R, Jiao H, Barnett N L, et al. A model of prog--ressive photo-oxidative degeneration and inflammation in the pigmented C57BL/6J mouse retina. Experimental eye research 147 (2016): 114-127.
- Jang K-H, Do Y-J, Koo S T, et al. Protective effect of RIPK1-inhibitory compound in in vivo models for retinal degenerative disease. Experimental eye research 180 (2019): 8-17.
- Crabb J W, Miyagi M, Gu X, et al. Drusen proteome analysis: An approach to the etiology of age-related macular degeneration. PNAS 99 (2002): 14682-14687.
- Gu X, Meer S G, Miyagi M, et al. Carboxyethylpyrrole protein adducts and autoantibodies, biomarkers for age-related macular degeneration. The Journal of biological chemistry 278 (2003): 42027-42035.
- Chu X K, Wang Y, Ardeljan D, et al. Controversial view of a genetically altered mouse model of focal retinal degeneration. Bioengineered 4 (2013): 130-135.
- Biswal M R, Justis B D, Han P, et al. Daily zeaxanthin supplementation prevents atrophy of the retinal pigment epithelium (RPE) in a mouse model of mitochondrial oxidative stress. PloS one (2018).
- Lyzogubov V V, Bora N S, Tytarenko R G, et al. Polyethylene glycol induced mouse model of retinal degeneration. Experimental eye research 127 (2014): 143-152.
- Seo S -j, Krebs M P, Mao H, et al. Pathological consequences of long-term mitochondrial oxidative stress in the mouse retinal pigment epithelium. Experimental eye research 101 (2012): 60-71.

