Diagnostic Value of Pulmonary Artery Hypodense and Hyperdense Luminal Sign in Non-Contrast Thoracic CT Scan for Detection of Pulmonary Embolism
Article Information
Meisam Izadi1*, Nasim Salehnia2, Masoud Pezeshki Rad3, Hamidreza Reihani4, Fateme Shafiee1
1Department of Radiology, Mashhad University of Medical Sciences, Mashhad, Iran
2Department of Infectious Diseases, Mashhad University of Medical Sciences, Mashhad, Iran
3Associate Professor of Radiology, Mashhad University of Medical Science, Mashhad, Iran
4Department of Emergency Medicine, Faculty of Medicine, Mashhad University of Medical Sciences, Mashhad, Iran
*Corresponding Author: Nasim Salehnia, Department of Infectious Diseases, Mashhad University of Medical Sciences, Mashhad, Iran
Received: 21 August 2021; Accepted: 16 September 2021; Published: 01 October 2021
Citation: Meisam Izadi, Nasim Salehnia, Masoud Pezeshki Rad, Hamidreza Reihani, Fateme Shafiee. Diagnostic Value of Pulmonary Artery Hypodense and Hyperdense Luminal Sign in Non-Contrast Thoracic CT Scan for Detection of Pulmonary Embolism. Journal of Radiology and Clinical Imaging 4 (2021): 132-140.
Share at FacebookAbstract
This study evaluates the diagnostic value of hyperdense and hypodense foci in the lumen of pulmonary arteries and their branches for pulmonary embolism in thoracic CT Scan without contrast. In this study, imaging data of 171 patients who underwent both Non-contrast thoracic CT Scan and CT angiography were assessed. First, non-contrast thoracic CTs done by a multidetector CT machine were evaluated for abnormal intraluminal densities in pulmonary arteries and their branches. Then, the results were compared with the results of pulmonary CT angiography. In 58 patients (43/92%), the intraluminal signs (including hyperdense and hypodense) were seen in non-enhanced CT. According to the obtained results, 18 (31%) cases had normal CT Angiography, 24 patients (37/41%) had evidence of central emboli, and 16 patients (58/27%) had evidence of peripheral embolism. For the hyperdense luminal sign, false-negative rate, false-positive rate, sensitivity, specificity, PPV, and NPV for pulmonary embolism were 13/5%, 4/1%, 48/89%, 98/44%, 75/86%, and 83/80%, respectively. For the hypodense luminal sign, false-negative rate, false-positive rate, sensitivity, specificity, PPV, and NPV for pulmonary embolism were 15/8%, 6/4%, 40%, 91/27%, 62/07%, and 80/99% respectively. The results indicate that the hyperdense luminal sign has a high specificity and NPV for the diagnosis of PE, especially for central embolism. However, the sensitivity and PPV of this sign are not significant. Also, the hypodense luminal sign has a high specificity and PPV for the diagnosis of PE, but its sensitivity and PPV are not substantial.
Keywords
Pulmonary embolism; Computed tomography pulmonary angiography; Hypodense luminal sign; Hyperdense luminal sign
Pulmonary embolism articles; Computed tomography pulmonary angiography articles; Hypodense luminal sign articles; Hyperdense luminal sign articles
Pulmonary embolism articles Pulmonary embolism Research articles Pulmonary embolism review articles Pulmonary embolism PubMed articles Pulmonary embolism PubMed Central articles Pulmonary embolism 2023 articles Pulmonary embolism 2024 articles Pulmonary embolism Scopus articles Pulmonary embolism impact factor journals Pulmonary embolism Scopus journals Pulmonary embolism PubMed journals Pulmonary embolism medical journals Pulmonary embolism free journals Pulmonary embolism best journals Pulmonary embolism top journals Pulmonary embolism free medical journals Pulmonary embolism famous journals Pulmonary embolism Google Scholar indexed journals Computed tomography pulmonary angiography articles Computed tomography pulmonary angiography Research articles Computed tomography pulmonary angiography review articles Computed tomography pulmonary angiography PubMed articles Computed tomography pulmonary angiography PubMed Central articles Computed tomography pulmonary angiography 2023 articles Computed tomography pulmonary angiography 2024 articles Computed tomography pulmonary angiography Scopus articles Computed tomography pulmonary angiography impact factor journals Computed tomography pulmonary angiography Scopus journals Computed tomography pulmonary angiography PubMed journals Computed tomography pulmonary angiography medical journals Computed tomography pulmonary angiography free journals Computed tomography pulmonary angiography best journals Computed tomography pulmonary angiography top journals Computed tomography pulmonary angiography free medical journals Computed tomography pulmonary angiography famous journals Computed tomography pulmonary angiography Google Scholar indexed journals Hypodense luminal sign articles Hypodense luminal sign Research articles Hypodense luminal sign review articles Hypodense luminal sign PubMed articles Hypodense luminal sign PubMed Central articles Hypodense luminal sign 2023 articles Hypodense luminal sign 2024 articles Hypodense luminal sign Scopus articles Hypodense luminal sign impact factor journals Hypodense luminal sign Scopus journals Hypodense luminal sign PubMed journals Hypodense luminal sign medical journals Hypodense luminal sign free journals Hypodense luminal sign best journals Hypodense luminal sign top journals Hypodense luminal sign free medical journals Hypodense luminal sign famous journals Hypodense luminal sign Google Scholar indexed journals Hyperdense luminal sign articles Hyperdense luminal sign Research articles Hyperdense luminal sign review articles Hyperdense luminal sign PubMed articles Hyperdense luminal sign PubMed Central articles Hyperdense luminal sign 2023 articles Hyperdense luminal sign 2024 articles Hyperdense luminal sign Scopus articles Hyperdense luminal sign impact factor journals Hyperdense luminal sign Scopus journals Hyperdense luminal sign PubMed journals Hyperdense luminal sign medical journals Hyperdense luminal sign free journals Hyperdense luminal sign best journals Hyperdense luminal sign top journals Hyperdense luminal sign free medical journals Hyperdense luminal sign famous journals Hyperdense luminal sign Google Scholar indexed journals CT angiography articles CT angiography Research articles CT angiography review articles CT angiography PubMed articles CT angiography PubMed Central articles CT angiography 2023 articles CT angiography 2024 articles CT angiography Scopus articles CT angiography impact factor journals CT angiography Scopus journals CT angiography PubMed journals CT angiography medical journals CT angiography free journals CT angiography best journals CT angiography top journals CT angiography free medical journals CT angiography famous journals CT angiography Google Scholar indexed journals deep venous thrombosis articles deep venous thrombosis Research articles deep venous thrombosis review articles deep venous thrombosis PubMed articles deep venous thrombosis PubMed Central articles deep venous thrombosis 2023 articles deep venous thrombosis 2024 articles deep venous thrombosis Scopus articles deep venous thrombosis impact factor journals deep venous thrombosis Scopus journals deep venous thrombosis PubMed journals deep venous thrombosis medical journals deep venous thrombosis free journals deep venous thrombosis best journals deep venous thrombosis top journals deep venous thrombosis free medical journals deep venous thrombosis famous journals deep venous thrombosis Google Scholar indexed journals Venous thromboembolism articles Venous thromboembolism Research articles Venous thromboembolism review articles Venous thromboembolism PubMed articles Venous thromboembolism PubMed Central articles Venous thromboembolism 2023 articles Venous thromboembolism 2024 articles Venous thromboembolism Scopus articles Venous thromboembolism impact factor journals Venous thromboembolism Scopus journals Venous thromboembolism PubMed journals Venous thromboembolism medical journals Venous thromboembolism free journals Venous thromboembolism best journals Venous thromboembolism top journals Venous thromboembolism free medical journals Venous thromboembolism famous journals Venous thromboembolism Google Scholar indexed journals pulmonary embolism articles pulmonary embolism Research articles pulmonary embolism review articles pulmonary embolism PubMed articles pulmonary embolism PubMed Central articles pulmonary embolism 2023 articles pulmonary embolism 2024 articles pulmonary embolism Scopus articles pulmonary embolism impact factor journals pulmonary embolism Scopus journals pulmonary embolism PubMed journals pulmonary embolism medical journals pulmonary embolism free journals pulmonary embolism best journals pulmonary embolism top journals pulmonary embolism free medical journals pulmonary embolism famous journals pulmonary embolism Google Scholar indexed journals cerebrovascular accident articles cerebrovascular accident Research articles cerebrovascular accident review articles cerebrovascular accident PubMed articles cerebrovascular accident PubMed Central articles cerebrovascular accident 2023 articles cerebrovascular accident 2024 articles cerebrovascular accident Scopus articles cerebrovascular accident impact factor journals cerebrovascular accident Scopus journals cerebrovascular accident PubMed journals cerebrovascular accident medical journals cerebrovascular accident free journals cerebrovascular accident best journals cerebrovascular accident top journals cerebrovascular accident free medical journals cerebrovascular accident famous journals cerebrovascular accident Google Scholar indexed journals myocardial infarction articles myocardial infarction Research articles myocardial infarction review articles myocardial infarction PubMed articles myocardial infarction PubMed Central articles myocardial infarction 2023 articles myocardial infarction 2024 articles myocardial infarction Scopus articles myocardial infarction impact factor journals myocardial infarction Scopus journals myocardial infarction PubMed journals myocardial infarction medical journals myocardial infarction free journals myocardial infarction best journals myocardial infarction top journals myocardial infarction free medical journals myocardial infarction famous journals myocardial infarction Google Scholar indexed journals
Article Details
1. Introduction
Venous thromboembolism (VTE), which includes deep venous thrombosis (DVT) and pulmonary embolism (PE) is considered one of three cardiovascular causes of mortality. The other two are myocardial infarction (MI) and cerebrovascular accident (CVA) [1]. PE is a common cause of acute thoracic symptoms. Although this condition is associated with a high frequency of admissions and mortality, early initiation of anticoagulant therapy significantly reduces its mortality and recurrence [2]. Based on general surgeons’ American society, PE is the most common preventable cause of mortality among admitted patients [1]. Signs and symptoms of PE are highly nonspecific, and radiologists play a significant role in diagnosing patients suspected of PE [2]. Currently, a thoracic CT with contrast using a multidetector CT scan is considered an appropriate primary evaluation for PE [1-3]. Since the clinical signs of pulmonary embolism are nonspecific [2, 4], awareness of its various imaging manifestations essential in diagnosis [4]. Considering high prevalence [1], and nonspecific signs and symptoms of PE [2], a patient with PE may undergo thoracic CT imaging without contrast. Also, as the early diagnosis of PE is critical, paying attention to possible evidence of PE on thoracic CT, even when there’s no clinical suspicion, is highly important [5].
A study was done by Vicent R.Tacto et al. (2011), aiming to evaluate the diagnostic value of hyperdense lumen sign for PE on thoracic CT scans without contrast. In this study, thoracic CT scans with- and without contrast of 121 patients who underwent standard CT angiography was collected and evaluated separately. The presence or lack of the intraluminal hyperdense region was evaluated in thoracic CT pulmonary arteries without contrast. Twenty-five patients showed PE in CT angiography, and 9 out of these showed hyperdense lumen in thoracic CT without contrast. In this study, hyperdense luminal sign had a sensitivity, specificity, positive predictive value, and negative predictive value of 36%, 99%, 90%, and 85.6% (p-value < 0.001) respectively. At detecting central thromboembolism, this sign had a sensitivity, specificity, positive predictive value and negative predictive value of 66.7%, 99.1%, 88.9%, and 96.4%. This sign had lesser sensitivity for detecting peripheral embolism. The mean difference in the embolus and pulmonary artery blood density was 22.76 ± 4.2 HU. Based on the study’s results, the hyperdense luminal sign is a useful sign for diagnosing PE, especially when the embolus is in the central region [6].
Jeffrey P.Kanne et al. (2003) reported acute central PE in six patients by thoracic CT without contrast. The imaging data of 80 patients suspected of PE were evaluated, of whom 11 patients were found to have central PE. In this study, high attenuation regions in pulmonary arteries in thoracic CT without contrast of six patients were proposed as a sign of PE. Five were detected retrospectively and one prospectively during the study. The difference between embolus and pulmonary artery blood density was calculated for all of these six patients. The density of the embolus ranged between 53 to 77 HU (mean 65.8 HU), while the density of circulating blood ranged from 25 to 41 HU (mean 36.3 HU). The lowest density difference between the embolus and circulating blood was 17 HU, and the highest difference was 45 HU. The high attenuation embolus was reported to be best seen using a narrow window setting (WW: 158-349 HU and WL: 15-50 HU) [3].
In 2005, Corbelli et al. published a paper that evaluated the imaging data of 140 patients suspected of PE, which included thoracic CT scans with- and without IV contrast. First, the CT images with IV contrast were evaluated for PE, then the non-contrast images of PE cases were analyzed. Fifty-one patients had evidence compatible with PE on contrast CT images, of whom non-contrast CT images could detect 21 patients with PE. Based on this study's results, non-contrast thoracic CT images can detect PE (especially those with central embolus) in about 40-50% of PE patients [7]. In 2000, Michaei B. Gotway et al. described a patient suspected of PE who underwent thoracic CT imaging without contrast and with IV contrast afterward. The non-contrast CT images showed a high attenuation saddle-shaped embolus in the pulmonary artery, which correlated with the site of PE after the administration of IV contrast [4]. In a study by De Luca et al. (2012), imaging data of 86 patients with acute PE, and 21 patients with chronic PE were evaluated. In the thoracic CT images without contrast administration, the mean density of embolus in acute PE was 54.9 HU comparing to 33.8 HU in chronic PE. Based on this study's results, acute emboli have higher density before contrast administration and, therefore, better visualized [8]. The present study was designed to determine the Hyperdense and Hypodense intraluminal sign's diagnostic value in thoracic CT images without contrast administration for detecting pulmonary embolism.
2. Material and Method
2.1 Study design
We performed a prospective cross-sectional review of the imaging data of all included patients.
2.2 Patients
We prospectively analyzed imaging data of all consecutive patients who were referred to Ghaem and Imam Reza hospitals, Mashhad, Iran from 2019-2020 who underwent both thoracic high resolution computed tomography (HRCT) without contrast administration and computed tomography pulmonary angiography (CTPA) at the same referral.
2.3 Inclusion and exclusion criteria
Inclusion criteria were all consecutive patients who were referred to Ghaem and Imam Reza hospitals, Mashhad, Iran from 2019-2020 who underwent both thoracic HRCT without contrast administration and CTPA at the same refe-rral. Exclusion criteria:
- Patients who underwent only thoracic HRCT without contrast administration or CTPA.
- Poor opacification of pulmonary arteries on CTPA.
- Presence of motion-related artifacts in mentioned diagnostic interventions.
2.4 Interventions
First, non-contrast thoracic CT of each patient done by a multidetector 16 slices CT machine were evaluated for abnormal intra-luminal densities in pulmonary arteries and their branches and the involved regions were classified as either central (pulmonary trunk and left and right pulmonary arteries) or peripheral (branches distal to left and right pulmonary arteries). As CTPA is currently considered the gold standard for diagnosis of PE, these results were compared with results of CTPA for the presence of embolism and its site correlation. We also measured the density of abnormal density (if present) and the circulating blood of pulmonary arteries for each patient in their CT without contrast administration.
2.5 Statistical analysis
All data were analyzed using SPSS version 21.
3. Results
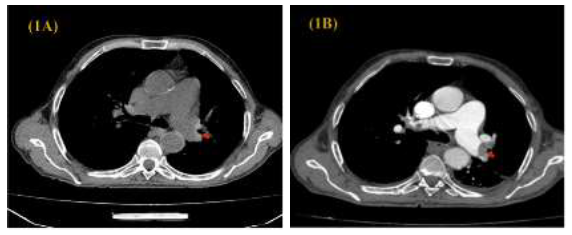
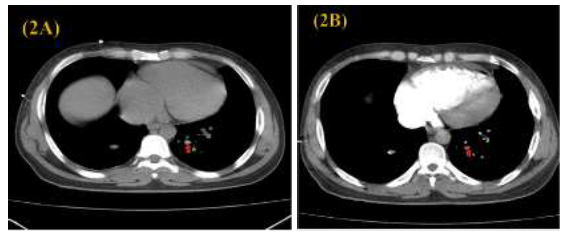
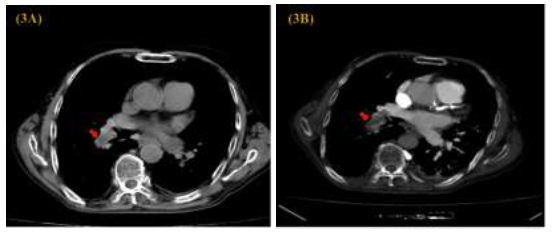
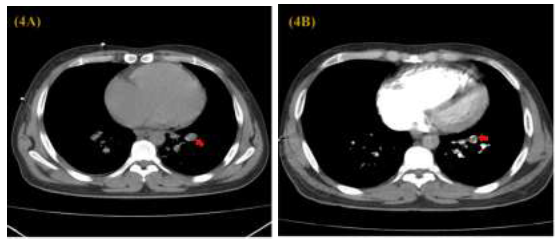
After considering our inclusion, as mentioned earlier and exclusion criteria, 171 patients were enrolled, all of whom had a suspicion for PE based on their clinical presentation. Thus, 45 out of 171 patients (26.3 %) were diagnosed with PE based on their CTPA (Table 1). We detected hypodense or hyperdense intraluminal sign in 58 (33.9%) of our patients based on the results of CT without contrast administration. Figures 1-4 are examples of these signs were detected on Non-contrast CT Scan. 40 out of 58 patients (88.9%) received a definite diagnosis of PE (central or peripheral) based on their CTPA. As shown, 113 (66%) patients did not have hypo- or hyperdense intraluminal sign in CT without contrast administration (Table 2). Using CTPA as the gold standard for diagnosing PE, we calculated the indices of predictive efficiency of hypodense and hyperdense intraluminal signs for PE and central and peripheral PE separately. Based on our results, the hyperdense luminal sign has a high specificity and negative predictive value for PE diagnosis, especially for central pulmonary embolism.
However, the sensitivity and positive predictive value of this sign are not significant. On the other hand, the hypodense luminal sign has a high specificity and positive predictive value for PE diagnosis (central and peripheral). Still, its sensitivity and positive predictive value are not significant) (Table 3). As table 5 shows, there was no association between the mean density of intraluminal lesions (hypo- or hyperdense) on HRCT without contrast administration and any final diagnoses. We also measured the density of embolus and circulating blood for each patient on HRCT without contrast administration. Overall, the mean density of the emboli was 47.19 HU (Table 4).
|
Definite diagnosis based on CTPA |
Percentage |
n |
|
|
Normal |
73.70% |
126 |
|
|
PE |
Central |
14.60% |
25 |
|
Peripheral |
11.70% |
20 |
|
|
Total |
26.30% |
45 |
|
|
Total |
100% |
171 |
|
Table 1: Definite diagnosis of patients based on the results of their CTPA.

Figure 1: Central intraluminal hyperdense sign in left lower lobe pulmonary artery branches in thoracic CT without contrast administration (1A), and its concordance with the site of an embolus in CTPA (1B).

Figure 2: Peripheral intraluminal hyperdense sign in left lower lobe pulmonary artery branches in thoracic CT without contrast administration (A), and its concordance with the site of an embolus in CTPA (B).

Figure 3: Central intraluminal hypodense sign in the right interlobar artery in thoracic CT without contrast administration (A), and its concordance with the site of an embolus in CTPA (B).

Figure 4: Peripheral intraluminal hypodense sign in the right interlobar artery in thoracic CT without contrast administration (A), and its concordance with the site of an embolus in CTPA (B).
|
Non-contrast CT CTPA |
Intraluminal sign |
No intraluminal sign |
Total |
|||
|
Hyperdense intraluminal sign |
Hypodense intraluminal sign |
Total |
||||
|
Normal |
7 (5.6%) |
11 (8.7%) |
18 (14.2%) |
108 (85.7%) |
126 (100%) |
|
|
PE |
Central |
13 (52%) |
11 (44%) |
24 (96%) |
1 (4%) |
25 (100%) |
|
Peripheral |
9 (45%) |
7 (35%) |
16 (80%) |
4 (20%) |
20 (100%) |
|
|
Total |
22 (48.89%) |
18 (40%) |
40 (88.9%) |
5 (11.11%) |
45 (100%) |
|
|
Total |
29 (16.96%) |
29 (16.96%) |
58 (33.9%) |
113 (66.08%) |
171 (100%) |
|
Table 2: frequency of normal, hypodense and hyperdense intraluminal signs, and its concordance with CTPA findings.
Table 3: Validity and predictive values of intraluminal hypodense and hyperdense sign for pulmonary embolism, FN: false negative; FP: false positive; PPV: positive predictive value; NPV: negative predictive value; PE: pulmonary embolism.
|
Intraluminal Sign |
n |
Density on HRCT |
|||
|
Lowest |
Highest |
Mean |
SD |
||
|
Hypodense |
29 |
8 HU |
45 HU |
20.96 HU |
9.33 HU |
|
Hyperdense |
29 |
43 HU |
116 HU |
73.69 HU |
19.56 HU |
|
Total |
58 |
8 HU |
116 HU |
47.19 HU |
30.75 HU |
Table 4: Density of intraluminal signs on HRCT without contrast administration, HU: Hansfield Unit.
|
Intraluminal Sign |
Diagnosis based on CTPA |
n |
Lowest density |
Highest density |
Mean density |
SD |
P value |
|
Intraluminal hypodense lesions |
Normal |
11 |
9 |
39 |
19.09 |
9.16 |
P= 0.307 |
|
Central PE |
11 |
8 |
45 |
24.09 |
10.69 |
||
|
Peripheral PE |
7 |
8 |
29 |
17.86 |
6.39 |
||
|
Intraluminal hyperdense lesions |
Normal |
7 |
46 |
116 |
70 |
26.48 |
P= 0.238 |
|
Central PE |
13 |
53 |
105 |
80.46 |
16.06 |
||
|
Peripheral PE |
9 |
43 |
99 |
66.78 |
16.93 |
Table 5: Density of intraluminal hypodense and hyperdense lesions on HRCT without contrast administration for normal, central PE and peripheral PE diagnoses.
4. Discussion
Acute pulmonary embolism is a common cause of acute chest syndrome. The prevalence of the disease is high, and patients with acute pulmonary embolism may undergo a chest CT scan without contrast due to nonspecific symptoms. Evidence of pulmonary embolism in lung parenchyma is non-specific, and therefore in this study, the pulmonary arteries were evaluated. We define the hyperdense and hypodense luminal sign as a focal area of intraluminal hyperdensity or hypodensity, respectively, comparing to adjacent areas within the lumen. The current study revealed that Hyperdense luminal sign in thoracic CT scan without contrast administration has a high negative predictive value and specificity, especially for central embolism; however, this sign sensitivity and positive predictive value aren’t desirable, especially for peripheral embolism. On the other hand, in our investigation, luminal Hypodense sign for the diagnosis embolism (both central and peripheral) had relatively high specificity and negative predictive value. Still, the sensitivity and positive predictive value aren’t desirable.
Based on the results of this study, pulmonary artery evaluation in terms of intraluminal hypodense sign and the intraluminal hyperdense sign can help diagnose pulmonary embolism and mainly has a high negative predictive value, more evident for central embolism. This finding is essential in emergency patients, especially in patients with hypersensitivity to iodine contrast or in patients who are at high risk for contrast-induced nephropathy or even in patients without suspicion of pulmonary emboli due to non-specific symptoms. Primarily if the suspicion of pulmonary embolism is low based on clinical criteria, the absence of an abnormal luminal sign can reliably rule out pulmonary embolism, at least for central emboli, and reduce the potential contrast complications.
In addition to helping in embolism exclusion, a non-Contrast-enhanced CT scan in a group of patients can make an alternative diagnosis; therefore, in patients with low clinical suspicion and high risk of contrast-induced complications, non-contrast CT scans before CT angiography may be helpful, although further studies are needed to assess this hypothesis. At present, due to the recent coronavirus pandemic and the fact that lung-CT Scan without contrast is a part of the diagnosis, due to the relative high incidence of pulmonary embolism in patients with COVID-19 (an overall 24% (95% CI; 17–32%) cumulative incidence of pulmonary embolism in patients with COVID-19 pneumonia, 50% (30–70%) in ICU and 18% (12–27%) in other patients in one study) [9], and sometimes emergency conditions in some patients, this examination can be an adjunct to the screening of patients with suspected pulmonary embolism in the area of the COVID-19.
References
- Samuel Z Goldhaber. Deep Venous Thrombosis and Pulmonary Thromboembolism. In: Longo D, Fauci A, Hauser S, et al. Harrison’s principles of internal medicine. 18th ed. Philadelphia: The McGraw-Hill companies (2012).
- Curtis E Green, Jeffrey S. Klein. Pulmonary vascular disease.In:William E. Brant, Clyde A. Helms. Fundamentals of diagnostic radiology. 4th ed. Philadelphia: Wolters Kluwer Health (2012): 396-409.
- Jeffrey P Kanne, Michael B Gotway, Nisa Thoongsuwan, Eric J. Stern. Six Cases of Acute Central Pulmonary Embolism Revealed on Unenhanced Multidetector CT of the Chest. American Roentgen Ray Society 180 (2003): 1661-1664.
- Michael B. Gotway, W. Richard Webb. Acute pulmonary embolism: visualization of high attenuation clot in the pulmonary artery on non-contrast helical chest CT. American society of emergency radiology 7 (2000): 117-119.
- John Haaga. CT and MRI of the whole body. 5th ed. Philadelphia: Mosby Elsevier (2009): 873-875.
- Vincent R. Tatco, Honorato H. Piedad. The validity of hyperdense lumen sign in non-contrast chest CT scans in the detection of pulmonary thromboembolism. International Journal of Cardiovascular Imaging 3 (2011): 433.
- Cobelli R, Zompatori M, De Luca G, et al. Clinical usefulness of computed tomography study without contrast injection in the evaluation of acute pulmonary embolism.J Comput Assist Tomogr 29 (2005): 6-12.
- De Luca F1B, Modolon C, uia F, et al. Densitometric CT evaluation of acute and chronic thromboembolic filling defects of the pulmonary arteries before and after contrast injection. Radiol Med 117 (2012): 979-991.
- Bompard F, Monnier H, Saab I, et al. Pulmonary embolism in patients with Covid 19 pneumonia. European respiratory journal (2020).
