Development and Validation of a Gliadin Induced Intestinal Enteropathy Rat Model of Non-Celiac Gluten Sensitivity
Article Information
Walaa Albenayan1, Nabil Alruwaili1, José Rodrigo Pauli2, Andrella King1, Mattia Migliore1, and Iman Zaghloul1
1MCPHS University, Department of Pharmaceutical Sciences, 179 Longwood Ave, Boston, MA, 02115 USA
2School of Applied Sciences, University of Campinas (UNICAMP), FAPESP process number 2019/00227-1, Limeira, Brazil
*Corresponding author: Iman Zaghloul, MCPHS University, Department of Pharmaceutical Sciences, 179 Longwood Avenue, Boston, MA 02115, USA
Received: 22 June 2021; Accepted: 03 July 2021; Published: 08 October 2021
Citation: Walaa Albenayan, Nabil Alruwaili, José Rodrigo Pauli, Andrella King, Mattia Migliore, Iman Zaghloul. Development and Validation of a Gliadin Induced Intestinal Enteropathy Rat Model of Non-Celiac Gluten Sensitivity. Journal of Pharmacy and Pharmacology Research 5 (2021): 205-217.
Share at FacebookAbstract
Background: Non-celiac gluten sensitivity (NCGS) is a syndrome that is related to the ingestion of gluten-containing food. In the current study we developed and validated a NCGS rat model. Materials and Methods: Wistar rats were divided into 2 groups: control group (receiving 0.02 M acetic acid solution) and gliadin group (receiving 1.5 mg/g of body weight of gliadin in acetic acid solution). Rats received its treatment by intra-gastric gavage on postnatal day 2, then three times a week for 6 weeks. Animals were assessed for weight changes, intestinal permeability, histology, inflammatory cytokines, and anti-gliadin antibodies (AGA). Intestinal permeability was evaluated 24 h prior to sacrifice by administering a lactulose/mannitol solution (500/250 mg/kg respectively), and collecting urine for 24 h. For histological examination, small intestines were collected, fixed, and stained with hematoxylin and eosin. Intestinal gene expression of cytochrome P450 (CYP 3a62, CYP 3a9/18) and uptake transporters, breast cancer resistance protein (ABCG2), and P-glycoprotein (MDR1a) were evaluated using qRT-PCR. Blood was collected for measurement of totalanti-gliadin antibodies (AGA), anti-gliadin immunoglobulins A and M (AGA-IgA and AGA-IgM), and pro-inflammatory cytokines. Results: As compared to control, the gliadin group had lower body weight, increased intestinal permeability (p<0.05); mild villous atrophy, increased intraepithelial lymphocytes, mild inflammation; increases in total AGA and AGA-IgM, increased gene expression of pro-inflammatory cytokines, IL-6, TNF-α, and IFN-γ, by 94%, 33%, and 46% (p < 0.05) and altered gene expressions of CYP450 and transporters. Conclusions: This model closely mimics the pathological and inflammatory characteristics of NCGS, and could be used to test new pharmacological treatments for this syndrome.
Keywords
Celiac disease; non-Celiac gluten sensitivity; enteropathy; gluten; gliadin; animal model
Celiac disease articles, non-Celiac gluten sensitivity articles, enteropathy articles, gluten articles, gliadin articles, animal model articles
Article Details
Introduction
Non-celiac gluten sensitivity (NCGS) is a condition that results from the ingestion of gluten-containing foods or drinks and may affect up to 6% of the US population. NCGS patients suffer from both intestinal (abdominal pain, diarrhea, bloating and flatulence) and systemic symptoms including joint/muscle pain, headaches, fatigue, and foggy brain [1, 2]. In addition, loss of body mass, nausea, inflammation, among other health disorders may co-exist [5, 6]. These symptoms improve with dietary elimination of gluten, and then reappear upon its reinstatement. Additionally, NCGS patients demonstrate positive immune responses to gluten and its peptides, such as increases in immunoglobulin A (IgA) and/or G (IgG), and positive anti-gliadin (AGA) or anti-deamidated gliadin peptide (anti-DGP) antibodies [3, 4].
As a strategy to study the pathophysiology and intolerance to gluten, different experimental models of study have been proposed [7-11]. One of the strategies adopted for the study of gluten intolerance and structural changes in the gastrointestinal system has been the intragastric administration of gliadin in rodents [9]. However, the results are not always satisfactory or changes in the jejunal mucosa are not evident [9, 12]. In this scenario, it is observed that there is a need to create and validate a model of intestinal enteropathy to mimic the changes observed clinically in gluten-sensitive non-celiac patients. Researchs in this field will be essential and enable better compression of disorders linked with gluten hypersensitivity and its adverse health effects.
Moreover, bowel disorders present in this syndrome may interfere with drug pharmacokinetics; this is an issue that needs to be addressed [13, 14]. Pharmacokinetics studies in NCGS and gluten-sensitive patients may also facilitate dose adjustments for narrow therapeutic window drugs. Therefore, in the presence of gluten hypersensitivity intestinal enteropathy in a validated rat model of local and systemic inflammation, intestinal drug metabolizing enzymes, transporters and tight junctions are altered, which consequently would be expected to affect drug disposition. This model could help in assessing the pharmacokinetic parameters of certain drugs given to rats with gliadin-induced enteropathy compared to normal rats. Drugs that are substrates of intestinal drug metabolizing enzymes (DMEs), organic anion-transporting polypeptide (OATP) drug transporter and P-glycoprotein (P-gp) could have a different pharmacokinetic profile than normal rats.
The importance of drug disposition due to alterations in the enterocyte pathology aids in the determination and understanding of drug-drug interactions and dose-responses in therapy. Thus, the purpose of the study was to develop and validate a rat model, which exhibits pathologic changes in the intestinal mucosa (villus atrophy and inflammation) to be able to use it for the evaluation of pharmacokinetics of different drugs.
2. Material and Methods
2.1 Animal Experimental Design
A total of 8 Wistar female rats at the end of their gestation period and the litters of the dams were utilized in this study (Charles River Labs, Cambridge, MA). End stage gestation female rats were acclimated into our facility upon arrival to the vivarium. Each dam delivered approximately 10-12 pups. Rat pups were allowed to be naturally fed by their dam and were housed with their dams and handled (1-2 min minimum) daily. To avoid food dust contamination between investigators, as a precaution, cages with ventilated cage tops were used throughout the study. The corn cob bedding was wheat gluten-free and did not affect the study. Rat pups and dams had access to enrichment devices (e.g., plastic bones, crawling/hiding–plastic elbow chambers) in the cage. The weight of each pup in both groups was measured and recorded every 3 d.
On day 21 (when pups are independent of dam feeding) the dams were sacrificed by carbon dioxide asphyxiation until breathing stopped followed by cardiac exsanguination. The two litters were initially divided into two main groups (control and gliadin-fed). For each group, the end point was six weeks. The pups in the control group were given the blank vehicle (0.02M acetic acid, pH=3.22) while the pups in the gliadin-fed group were given the gliadin solution (10% in 0.02 M acetic acid, pH=3.22). Doses of the solution (1.5mg/g) were administered intragastrically by means of a specialized stainless steel neonatal gavage tool, a stainless steel curved feeding needle (24-22 GA/1.5 in; Kent Scientific Corporation, Torrington, CT) every 3 d until end point.
Rats in each group were administered lactulose/mannitol solution 1 d before the endpoint. The 1 mL dose was equivalent to 500:250 mg lactulose/mannitol/kg of the weight of each rat, and was administered intragastrically. To assess the permeability of the intestine to lactulose (7, 15) the rats fasted and were placed in metabolic cages individually for 24 h for urine collection. The amount of lactulose/mannitol ratio excreted in urine was calculated for each rat.
During the study, all rats were monitored (three times a week) for their health and well-being. Specifically, their body weight and all changes were recorded (gain or loss), hydration status, presence of gastrointestinal symptoms (e.g., diarrhea), color of mucus membranes, and body condition score by assessing the vertebrae by palpation of the lumbar spine and the pelvic bones by palpation of the hips. The Biopharmaceutics Classification System (BCS) diagrams and descriptions (animals scoring less than BCS 2 were euthanized and eliminated from the study) were used to establish individual scores for each rat (16)
On day 46 rats were deeply anesthetized with 3-4% isoflurane and intestinal tissues were excised. Blood samples were collected via cardiac puncture through a thoracotomy for each rat. After blood and tissue collection, rats were euthanized by cervical dislocation under deep anesthesia.
2.2 Histological Analysis
Excised intestinal tissue sections were labeled according to the region (duodenum/ jejunum) and then fixed in Bouin’s solution (Sigma-Aldrich Co. LLC). Tissues were embedded in paraffin cassettes and then thin sections were obtained and stained with hematoxylin–eosin. Tissue section slides were analyzed under the microscope. Histological analysis was performed at the Rodent Histopathology Core facility at Harvard Medical School, Boston, MA.
2.3 Lactulose/Mannitol Permeability Assessment
The day before their endpoint each rat was placed individually in ametabolic cage that separated its urine from feces. Urine samples were collected and the volume was measured. Then, all urine samples were stored at -80 °C until the time of analysis. Samples were prepared by adding Carrez Clarification Reagent (BioVision Inc., Milipitas, CA) to precipitate all protein contaminants in the urine. The supernatant was collected then centrifuged at 12,000 × g for 5 min. Because the concentrations of lactulose and mannitol were unknown, different volumes of urine per sample for all samples were tested. The ratio of the concentration of lactulose to mannitol for each was determined and compared between both groups.
D-Mannitol Colorimetric Assay
Samples were analyzed using a D-Mannitol Colorimetric Assay Kit (BioVision). All preparations were added to a 96-well plate and read on a spectrophotometer at absorbance of 450 nm, which is the detection wavelength of mannitol.
Lactulose Fluorometric Assay
Samples were analyzed using a PicoProbe Lactulose Fluorometric Assay Kit (BioVision). All preparations were added to a 96-well plate and read on a plate reader with fluorescence detection capability at the fluorescence measure of Ex/Em = 535/587 nm.
2.3 Plasma analyses of AGA, IgA, IgM and pro-inflammatory cytokines
Anti-gliadin antibodies (AGA), Immunoglobulin A (IgA) and Immunoglobulin M (IgM) by ELISA kits (MyBioSource, San Diego, CA) were used to determine the change and presence of these markers between both animal groups using plasma samples. Moreover, quantikine ELISA kits (R&D System) were used to measure the plasma concentrations of interferon gamma (IFN- γ), Tumor necrosis factor alpha (TNF-α), interleukin-1 beta (IL-1β) and interleukin-6 (IL-6), in both animal groups, in accordance with the manufacturer's recommendations.
2.4 Gene expression
Jejunal tissue sections from all animals in both groups were stored at -80 °C then, were prepared for mRNA isolation as follows: 50-100 mg of tissue was homogenized with 1 mL TRIzol reagent (Thermo Fisher Scientific, Waltham, MA), then homogenized mechanically under dry ice. Chloroform (Sigma-Aldrich Co. LLC) was added in volumes of 200 uL to each sample. The mixture was then centrifuged for 15 min at 12,000 × g at 4 °C. Upon separation the aqueous phase was removed to a new vial and 500 uL of 100% isopropyl (Sigma-Aldrich Co. LLC) was added and then centrifuged under the previous condition. This process resulted in a pellet. The pellet was washed with 1 mL of 75% ethanol (Sigma-Aldrich Co. LLC) and then centrifuged for 5 min 7500 × g at 4 °C. The pellet was then allowed to dry and then 50 uL of triethanolamine buffer solution (Sigma-Aldrich Co. LLC) was added and mixed well. The RNA concentrations were determined with a NanoDrop ND-2000 spectrophotometer (NanoDrop Technologies, Wilmington, DE). All the samples were diluted to a concentration of 133 ng/uL of RNA and then further used for cDNA preparation.
The cDNA was synthesized using the prepared diluted samples of mRNA along with the transcript of First Strand cDNA Synthesis kit (Roche Applied Science, Indianapolis, IN). Samples were then placed in the SimpliAmp Thermal Cycler (Applied Biosystems Inc., Foster City, CA) for amplification.
Then, six probes were analyzed for mRNA expression levels in all samples. Glyceraldehyde-3-phosphate dehydrogenase (GAPDH) was used as a housekeeping gene to normalize for the expression of other probes. Quantitative reverse-transcriptase polymerase chain reaction was performed using the Applied BiosystemsStepOnePlus Real-Time PCR System andTaqMan Fast Advanced Master Mix (Life Technologies). All probes were 6-carboxyfluorescein (6-FAM) labeled. The primers of the genes measured in this study are listed in Table 1. The relative expression of each gene was analyzed using a cycle threshold (Ct) by the 2-ΔΔCt method [17].
Table 1: The primers of the genes measured in this study.
2.5 Statistical Analysis
Data were presented as the mean ± standard deviation (S.D) for each variable studied. Statistical significance comparing two groups was assessed by Student’s t test. All analyses were performed using GraphPad Prism 7 software (GraphPad Software, La Jolla, CA); a p value of < 0.05 was considered statistically significant.
2.6 Body weight assessment
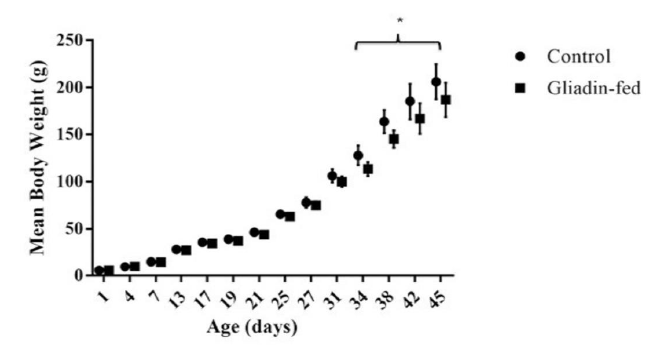
Animal weight gain was analyzed between gliadin-fed and control groups from day 1 until the endpoint (Figure 1). On day 34 gliadin-fed rats started to show statistically significant less weight gain than the control (p<0.05).
2.7 Histological Analysis
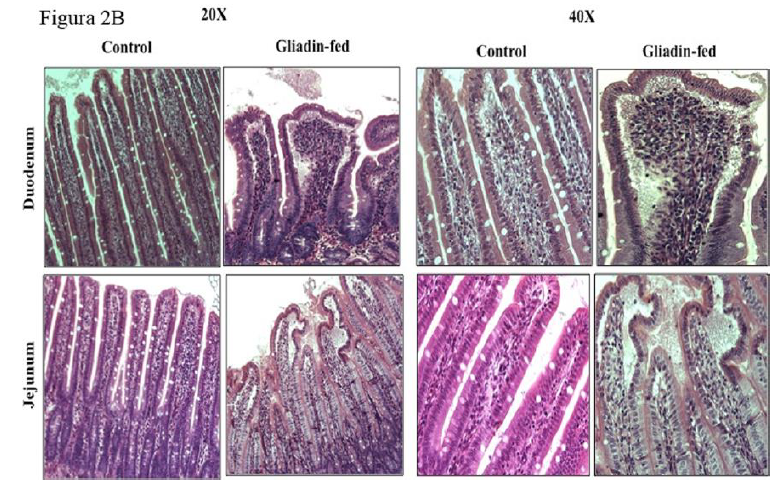
The difference in villus height between gliadin-fed rats and the control in two different intestinal regions, duodenum and jejunum at six weeks is shown in Figure 2A. Intestinal sections from both regions resembled mild inflammation characterized by infiltrates of immune cells in the lamina propria, edema at the tips of villi and a few macrophages and neutrophils in the lumen of the gut as shown in Figure 2B.
2.8 Lactulose/Mannitol Permeability Assessment
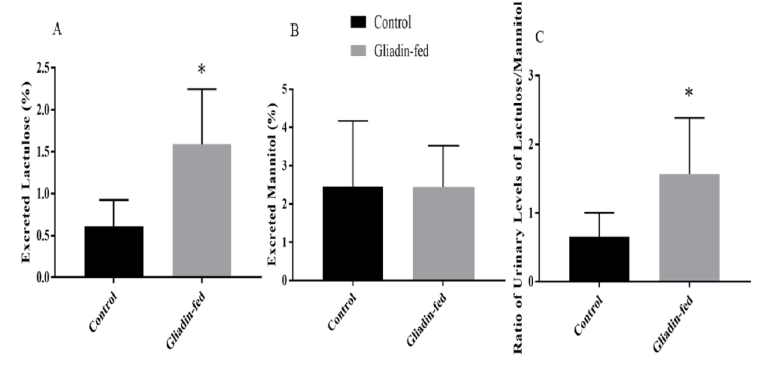
The percentage of urinary excretion of lactulose and mannitol was measured (Figures 3). The amount of lactulose excreted in urine in the gliadin-fed group was significantly higher than control group (p= 0.0127) (Figure 3A). Data are expressed as percentage excreted. The amount of mannitol excreted in urine was not significantly different between the gliadin-fed and control groups (Figure 3B). The ratio of urinary levels of lactulose/mannitol was significantly higher in gliadin-fed groups (p=0.0417) (Figure 3C).
Figure 3: Amount of Urinary Excretion of Lactulose (Figure 3A), amount of Urinary Excretion of Mannitol (Figure 3B) and Ratio of Urinary Excretion of Lactulose to Mannitol (Figure 3C) Between Control and Gliadin-Fed Groups. Data represent the mean
± standard deviation (S.D), n=6 animals per group, *p< 0.05.
2.9 Plasma anti-gliadin antibodies and pro-inflammatory cytokines analysis:
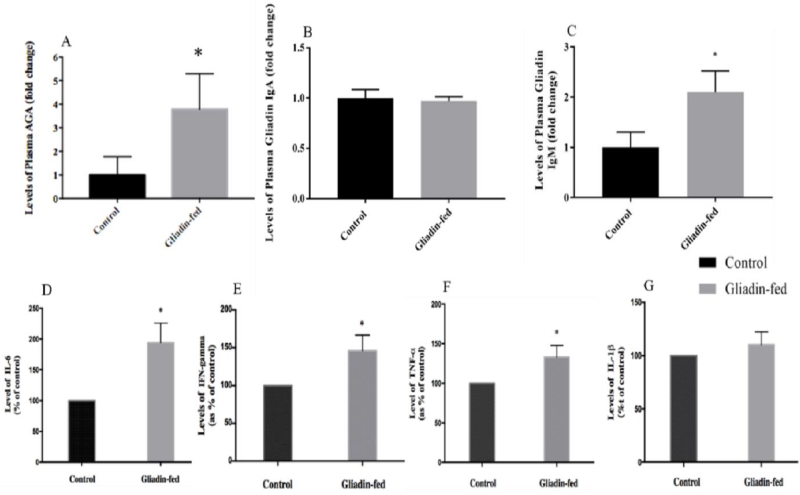
Total AGA were significantly higher in the plasma of gliadin-fed rats as compared to levels measured in the control group (p= 0.0262) (Figure 4A). Regarding plasma levels of gliadin IgA antibodies did not show any significant difference between gliadin-fed and control groups (Figure 4B). However, plasma levels of gliadin IgM antibodies were significantly higher in the plasma of gliadin-fed rats as compared to levels measured in the control group (0.0209) (Figure 4C). The protein levels of IL-6 in the gliadin-fed group was increased as compared to the control group (Figure 4D). The same effect was observed when IFN- was measured in the control and the gliadin-fed animals. The gliadin-fed group was increased as compared to the control group (Figure 4E). There was a significantly increased expression of TNF- in the gliadin-treated group as compared to the control group (Figure 4F). In contrast, the protein levels of IL-1 in the gliadin- fed group did not significantly differ when compared to that of the control group (Figure 4G).
Figure 4: Plasma Levels of AGA (Figure 4A, n=4), Gliadin IgA Antibodies (Figure 4B, n=4), Gliadin IgM Antibodies (Figure 4C, n=3), IL-6 (Figure 4D, n=3), IFN- γ (Figure 4E, n=3), TNF-α (Figure 4F, n=3) and IL-1β (Figure 4G, n=3) between Control and Gliadin-Fed Groups. Expressed as fold change. Data represent the mean ± standard deviation (S.D), *p< 0.05.
3.0 Gene Expression of Different CYP3A Enzymes and Drug Transporters
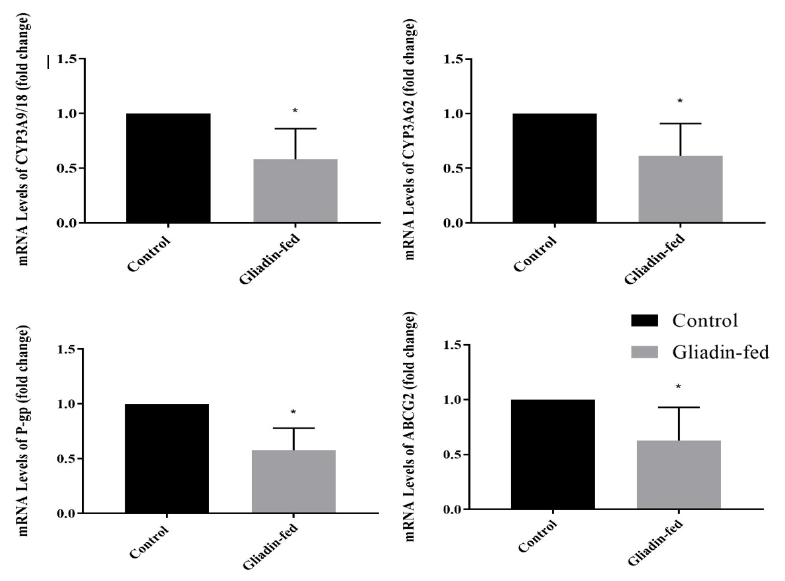
The effect of gliadin-induced enteropathy on DME and drug transporter protein gene expression is shown in Figure 5. The mRNA expression of CYP3A9/18 and CYP3A 62 in rat jejunum is shown in Figure 5A and 5B. The expression in gliadin-fed groups was significantly lower than that of the control (p = 0.0237 and (p=0.0400), respectively. The mRNA expression of Pg-p in rat jejunum is shown in Figure 5C. It can be observed from the results that the expression in gliadin-fed groups was significantly lower than that of the control (p = 0.0056). The mRNA expression of ABCG2 in rat jejunum is shown in Figure 5D. It was noted that the expression in gliadin-fed groups was significantly lower than that of the control (p = 0.0485).
3. Discussion
Here, we developed a rat model that exhibited an intestinal environment that mimicked the pathophysiology of celiac disease (CD) by the oral gavage administration of crude gliadin preparation immediately after birth. Our model was a modified version of several previous successful reported models [7-12]. However, the purpose and aims of our model were to be used in assessment of pharmacokinetics drug profiles, which is novel and has not been reported previously. Additionally, more in-depth validation techniques were used to further validate the application of this model for the purpose of assessing drug disposition.
Considering the symptoms associated with gluten intolerance, monitoring the weight of the rats was a crucial point. Although, signs of diarrhea were not evident, the consistency of collected feces was loose and pale in the gliadin-fed group compared to the control group. Total body weight gain started to show a significant decline starting day 34 in the gliadin-fed rats. This could be attributed to malnutrition that is usually associated with such illnesses. Other study that sought to mimic intestinal changes of gluten intolerant organisms also observed reductions in rodent body mass [9].
The hallmark of CD and non-celiac gluten intolerance is intestinal villous morphology changes [5, 9]. In our study, the images of intestine in gliadin-fed group show very mild submucosa edema, artifactual vacuolation of the tips of villi at the ends, mild shortening of villi, mild inflammation characterized by infiltrates of immune cells in the lamina propria, edema at the tips of villi, a few macrophages and neutrophils in the lumen of the gut, and the very tips of some villi have granular material in the edema. These observations were expected as a result of the high dose of gliadin ingested. The degree of villous shortening and the mild inflammation resembled closely that reported with some celiac and non-celiac gluten sensitivity. This validation analysis endorsed the inflammatory characteristics of the gluten moiety that causes a series of localized processes altering the enterocyte.
Moreover, our results showed a significant increase in the percentage of lactulose excreted in gliadin-fed group as compared to the control group. On the other hand, mannitol is absorbed transcellularly, but due to a possible decrease in the number and functional capacity of the intestinal epithelial cells that are available for transcellular transport the amount of mannitol may be decreased [15, 19]. The percentage of mannitol excreted in gliadin-fed rats was measured, which decreased but was not statistically significant. To compensate for the decrease in surface area, the ratio of lactulose to mannitol was determined and was shown to be significantly higher in the same group.
The immunological pathways involved with gluten-related diseases are distinguished mainly by the involvement of genetic factors associated with CD. In the presence of HLA-DQ2/DQ8 genes the adaptive immune system takes place in a T-cell activation manner and is involved the production of specific gliadin IgA antibodies [20, 21]. For non-celiac gluten sensitivity, the immune responses are different involving mainly the humoral immune response and the T-cell independent adaptive immune response. This is mainly due to independence of TG2 enzymatic activity that requires the genetic factors associated with CD. Antibody response to native gliadin in NCGS individuals, specifically involve IgG and IgM antibodies [22]. The determination of gliadin IgA antibodies in our model showed no difference between both groups. This result was expected since genetic factors requiring their presence and elevation were not involved. However, non-specific gliadin antibodies showed a significant 3-fold increase in the gliadin-fed rats. Moreover, gliadin IgM antibodies were significantly higher in the latter group. These findings correspond to the immunological responses seen in NCGS [5, 21].
Regarding pro-inflammatory cytokines, our finding was that there was a significant increase in the plasma level of IFN-γ, TNFα, and IL-6 in animals treated with gliadin. Thus, the elevation of cytokine production in the model could be responsible for other related complications from gliadin dosing for 45 days. Similar studies, in the rodent model, were conducted to mimic the autoimmune disease in order to study the impact and effects of cereal grain intake in this kind of model. One of these studies has shown that feeding a cereal-based diet to diabetes-prone BioBreeding (BBdp) rats led to increased intestinal permeability. In addition, there was a significant elevation in the level of IFN- γ- in the gut [23, 24]. Comparable results were achieved by Lammers et al., who demonstrated in both CD patients and healthy controls that gliadin induced an inflammatory immune response, including significant elevations of IL-6, Interlukin-13 and IFN-γ in CD patients [25].
The regional abundance and actions of drug metabolizing enzymes, the interplay of intestinal drug metabolizing enzymes and transporter proteins, and absence of a sufficient understanding of the role of their levels, calls for an investigation to determine the levels by which they are altered in such diseases [26-28]. The levels of the intestinal drug metabolizing enzymes and transporters that are known to be of high abundance in the intestine were investigated as they may have a high impact on the overall oral bioavailability of drugs. In rodents CYP3A is present in these isoforms: CYP3A9/18 and 62. The decrease in the mRNA expression of CYP3A enzymes was significant with about a 42 and 39% reduction respectively. Drug transporter proteins investigated in this study included MDR1a and ABCG2. The mRNA expression of these proteins showed a statistically significant decrease among gliadin-fed rats with 42 and 37 % reduction, respectively. This reduction was expected as a result of pathological defects found in the enterocytes of gliadin-fed rats as a result of gliadin induced local inflammation that affected the morphology of the villi, where they are expressed. These findings were an important validation of the end goal in the development of this rat model.
4. Conclusions
Celiac disease and non-celiac gluten sensitivity has recently been a topic of major debate in research from finding a cure to finding specific biomarkers that sets them apart.
An observed lack in understanding drug disposition profiles in these diseases should be involved in this debate. By developing a rat model with proper validation for this purpose, pharmacokinetic studies can be carried out to determine a better understanding and more precise outcome pharmacodynamically. This research was a successful step in the development and validation towards this goal. We were able more widely understand the effects of gliadin on the intestine in rats. Taking this project to the next level of testing drug disposition is now just a step away assuring promising results.
References
- Khan A, Suarez MG, Murray JA. Nonceliac Gluten and Wheat Sensitivity. Clin Gastroenterol Hepatol. (2019) S1542-3565(19)30367-2.
- Rotondi Aufiero V, Fasano A, Mazzarella G. Non-Celiac Gluten Sensitivity: How Its Gut Immune Activation and Potential Dietary Management Differ from Celiac Disease. Mol Nutr Food Res 62 (2018): e1700854.
- Bardella MT, Elli L, Ferretti F. Non Celiac Gluten Sensitivity. Curr Gastroenterol Rep 12 (2016): 63.
- Hozyasz KK. Non-celiac gluten sensitivity (NCGS) - An old diagnosis recently rediscovered. Fam Med Prim Care Rev 18 (2016): 79-83.
- Tanveer M, Ahmed A. Non-Celiac Gluten Sensitivity: A Systematic Review. J Coll Physicians Surg Pak 29 2019: 51-57.
- Losurdo G, Principi M, Iannone A, Amoruso A, Ierardi E, Di Leo A, Barone M2.Extra-intestinal manifestations of non-celiac gluten sensitivity: An expanding paradigm. World J Gastroenterol 24 (2018): 1521-1530.
- Stepánková R, Tlaskalová-Hogenová H, Fric P, Trebichavský I. Enteropathy induced in young rats by feeding with gliadin--similarity with coeliac disease. Folia Biol (Praha) 35 (1989): 19-26.
- Stepankova R, Tlaskalová-Hogenová H, Šinkora J, Jodl J, Fric P. Changes in jejunal mucosa after long-term feeding of germfree rats with gluten. Scand J Gastroenterol 31 (1996): 551-557.
- Stepankova R, Kofronová O, Tucková L, Kozáková H, Cebra JJ, Tlaskalová-Hogenová H. Experimentally induced gluten enteropathy and protective effect of epidermal growth factor in artificially fed neonatal rats. J Pediatr Gastroenterol Nutr 36 (2003): 96-104.
- Nikoukar LR, Nabavizadeh F, Mohamadi SM, et al. Protective effect of ghrelin in a rat model of celiac disease. Acta Physiol Hung 101 (2014): 438-447.
- Amnuaycheewa P, Murray JA, Marietta EV. Animal models to study non-celiac gluten sensitivity. Minerva Gastroenterol Dietol 63 (2017): 22-31.
- Troncone R, Ferguson A. Animal model of gluten induced enteropathy in mice Gut 32 (1991): 871–5.
- Gubbins PO, Bertch KE. Drug Absorption in Gastrointestinal Disease and Surgery: Clinical Pharmacokinetic and Therapeutic Implications. Clin Pharmacokinet 21 (1991): 431-447.
- Heizer WD, Smith TW, Goldfinger SE. Absorption of digoxin in patients with malabsorption syndromes. N Engl J Med 285 (1971): 257-259.
- Vilela EG, Torres HOG, Ferrari MLA, Lima AS, Cunha AS. Gut permeability to lactulose and mannitol differs in treated Crohn's disease and celiac disease patients and healthy subjects. Braz J Med Biol Res 41 (2008): 1105-1109.
- Gades NM, Murray N. Use of a body condition score technique to assess health status in a rat model of polycystic kidney disease. J Am Assoc Lab Anim Sci 49 (2010): 269.
- chmittgen TD, Livak KJ. Analyzing real-time PCR data by the comparative CT method. Nat Protoc 3 (2008): 1101+.
- Vogelsang H, Schwarzenhofer M, Steiner B, Wyatt J, Oberhuber G. In vivo and in vitro permeability in coeliac disease. Aliment Pharmacol Ther 15 (2001): 1417-1425.
- Vives-Pi M, Takasawa S, Pujol-Autonell I, et al. Biomarkers for diagnosis and monitoring of celiac disease. J Clin Gastroenterol 47 (2013): 308-313.
- Fasano A. Surprise from celiac Disease. Sci Am 301 (2009): 54-61.
- Roszkowska A, Pawlicka M, Mroczek A, Balabuszek K, Nieradko-Iwanicka B. Non-Celiac Gluten Sensitivity: A Review. Medicina (Kaunas) 55 (2019): E222.
- Uhde M, Ajamian M, Caio G, et al. Intestinal cell damage and systemic immune activation in individuals reporting sensitivity to wheat in the absence of coeliac disease. Gut 65 (2016): 1930-1937.
- Sonier B, Patrick C, Ajjikuttira P, Scott FW. Intestinal Immune Regulation as a Potential Diet-Modifiable Feature of Gut Inflammation and Autoimmunity. Taylor & Francis 28 (2009).
- de Punder K, Pruimboom L. The dietary intake of wheat and other cereal grains and their role in inflammation. Nutrients 5 (2013): 771-787.
- Lammers KM, Khandelwal S, Chaudhry F, et al. Identification of a novel immunomodulatory gliadin peptide that causes interleukin-8 release in a chemokine receptor CXCR3-dependent manner only in patients with coeliac disease. Immunology 132 (2011): 432-440.
- Collins D, Wilcox R, Nathan M, Zubarik R. Celiac disease and hypothyroidism. Am J Med 125 (2012): 278-282.
- Sai Y. Biochemical and molecular pharmacological aspects of transporters as determinants of drug disposition. Drug Metab Pharmacokinet 20 (2005): 91-99.
- Lennernäs H. Clinical pharmacokinetics of atorvastatin. Clin Pharmacokinet 42 (2003): 1141-1160.

