Comparison of 3D Echo and In-Vivo Analysis of the Tricuspid Valve During Mitral Surgery. 3D-Echo vs In Vivo Analysis of Tricuspid
Article Information
Matteo Pettinaria*, Laurent De Kerchoveb,e, Michel Van Dyckc, Agnes Pasquetd,e, Bernhard Gerberd,e, Gebrine El-Khouryb,e, Jean-Louis Vanoverschelded,e
aCardiac Surgery Department, Ziekenhuis Oost Limburg, Genk, Belgium
bDivision of Cardiovascular and thoracic Surgery, Cliniques Universitaires Saint-Luc, Brussel, Belgium
cAnesthesia Department, Cliniques Universitaires Saint-Luc, Brussel, Belgium
dDivision of Cardiology, Cliniques Universitaires Saint-Luc, Brussel, Belgium
ePôle de recherche cardiovasculaire, Institut de recherche expérimentale et clinique, Universitè catholique de Louvain, Brussel, Belgium
*Corresponding Author: Matteo Pettinari Ph d, Cardiac Surgery Department, Ziekenhuis Oost Limburg, Genk, Belgium
Received: 06 August 2021; Accepted: 13 August 2021; Published: 26 December 2021
Citation: Matteo Pettinari, Laurent De Kerchove, Michel Van Dyck, Agnes Pasquet, Bernhard Gerber, Gebrine El-Khoury, Jean-Louis Vanoverschelde. Comparison of 3D Echo and in-vivo Analysis of the Tricuspid Valve During Mitral Surgery. 3D-Echo Vs In Vivo Analysis of Tricuspid. Cardiology and Cardiovascular Medicine 5 (2021): 610-622.
Share at FacebookAbstract
Background: The tricuspid valve is a complex threedimensional (3D) structure. Echocardiography (2D/3D) is the gold standard for evaluating valve function and anatomy. The aim of our study was to compare in vivo with 3D echocardiographic tricuspid valve measurements in patients treated for mitral valve disease.
Methods: Among the 139 patients treated for mitral valve disease, 37 had an intraoperative evaluation by 3D trans-esophageal echocardiography. After exposure of the valve, we took several pictures to obtain annular and leaflet measurements. We traced the echocardiographic annular measurements (area, perimeter, septal anterior, and latero-lateral diameters) at six different moments of the cardiac cycle: early, mid, and late, systole and diastole; leaflet lengths and areas were measured only during end-systole and diastole. From the intraoperative pictures, we obtained annular and leaflet measurements and compared them to echocardiographic findings using Pearson’s correlation test.
Results: Significant correlations were found between 3D echocardiography and in vivo measurements in terms of valve areas and perimeter (p < 0.01; r = 0.77 and p < 0.01; r=0.61, respectively) while diameters correlated moderately. Correlations of leaflet measurements were poor (R: 0.51–0.61). Multivariate linear regression analysis identified annulus areas and tenting height (p = 0.03 and 0.04, respectively) as significant predictors of tricuspid regurgitation.
Conclusion: Our study demonstrated that annulus area and perimeter correlate better than diameters for measuring the tricuspid annulus and have significant influence on functional tricuspid regurgitation. Leaflet analysis remains limited. Further studies will identify their impact on follow-up recurrence of functional tricuspid regurgitation.
Keywords
3D Echocardiography; Mitral valve disease; Intraoperative; Tricuspid
Article Details
Abbreviations:
FTR=functional tricuspid regurgitation, TA= tricuspid annulus, TV= tricuspid valve, 2D 3D= two and three dimensional, TEE= trans esophageal echocardiography, TTE= trans thoracic echocardiography, ES= early systole, MS= mid systole, LS= late systole, ED= Early diastole, MD= mid diastole, LD=late diastole, SA= septal anterior, LL= latero lateral, HTA= Arterial Hypertension, COPD== Chronic Obstructive Pulmonary Disease, PVD= Peripheral Vascular Disease, CVA= Cerebral Vascular Accidents, BSA= Body Surface Area
1. Introduction
Recent valvular treatment guidelines assign a Class IIa recommendation for tricuspid valve (TV) repair in the presence of tricuspid annulus (TA) dilatation, irrespective of TR severity [1]. Correct evaluation of the tricuspid annulus is thus of paramount importance for adequate surgical indication. Nowadays, the decision to intervene is usually based on the measurement of TA diameter obtained by transthoracic or transesophageal evaluation. Although two-dimensional (2D) echocardiography is the standard technique for measuring aortic and mitral annular dimensions, it is probably as appropriate to assess TV dimension. Indeed, compared to these two valves, the tricuspid valve has a much more complex non-circular geometry [2]. This phenomenon is even exaggerated in the presence of functional tricuspid regurgitation (FTR), as the anterior and posterior parts of the annulus tend to dilate more than the septal part. This makes it difficult to accurately measure tricuspid annular dimensions from a single 2D-echo cross section. 3D echo has been shown to overcome the limitations of 2D echo in non-circular objects. Accordingly, the aim of the present study was to compare 2D and 3D measurements of the TA with their intraoperative equivalents. We also compared 3D measurements of valve leaflet areas and lengths with those obtained by surgery.
2. Materials and Methods
Between May 2009 and May 2011, 139 patients undergoing mitral valve surgery were screened for inclusion into a prospective randomized trial on prophylactic tricuspid annuloplasty [2], among which 59 ultimately underwent combined TV annuloplasty. The surgical procedures and techniques have been previously described [2]. The study protocol was approved by our institutional review board and all patients gave their written informed consent prior to inclusion into the study.
2.1 Preoperative transthoracic 2D-echocardiography
Standardized preoperative TTE examinations were acquired according to established guidelines using iE33 ultrasound systems (Philips Medical Systems, Andover, Massachusetts) equipped with a 3.5/1.75-MHz phased-array transducer. Images were stored on a XCELERA 2.1 PACS server (Philips Medical Systems, Andover, Massachusetts) for off-line analysis. Four chamber views centred on the right ventricle (RV) were used to evaluate RV dimensions and function and to measure the tricuspid annulus dimensions. Zoomed 2D color-doppler images, centred on the tricuspid annular plane were used to measure the vena contracta (VC) of the tricuspid regurgitant jet in 4 chamber view. Based on these measurements, TR severity was categorized as mild (VC<3mm) , moderate (VC between 3-6 mm) and severe (VC ≥7mm).
2.2 Intraoperative transesophageal 2D- and 3D-echocardiography
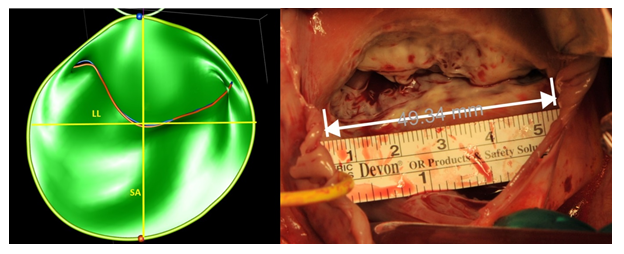
Experienced cardiologists or anaesthesiologists performed all TEE examinations after induction of general anesthesia and prior to cardiopulmonary bypass using an iE-33 ultrasound system equipped with an X7-2t TEE probe (Philips Medical Systems, Andover MA). Standard 2D-echo of the tricuspid valve (at an average frame rate of 55–60 Hz) were acquired from the 4 chambers view, the right ventricle inflow-outflow view and the transgastric right ventricle inflow view [3], to measure the tricuspid annulus diameter at end-systole and end-diastole. Zoomed 3D echo images of the tricuspid annulus were then acquired from a mid-oesophageal 4 chamber view, during brief periods of breath hold without electrical interference or patient movement over 4 to 8 cardiac cycles. Great care was taken to include the entire tricuspid annulus within the 3D volume. 3D images were analysed off-line using the Image Arena software (Tom-Tec Corporation GmBH, Munich, Germany) and the 4D mitral valve analysis package. This package allows for the semi-automatic identification and measurements of the mitral annulus and leaflets throughout the entire cardiac cycle; manual adjustments were made if needed. For annular measurements, only six specific time-points were analysed (early systole (ES): first frame after closure of the tricuspid valve; late systole (LS): last frame prior to tricuspid valve opening; mid systole (MS): midpoint between ES and LS; early diastole (ED): first frame after valve opening; late diastole (LD): the last frame prior to complete tricuspid valve closure mid diastole (MD): midpoint between ED and LD. For each of these pre-specified time points, the software automatically generates the following measurements; (1) maximal diameter from the septum to the anterior leaflet (Septal-anterior diameter); (2) the lateral-lateral diameter (the largest diameter perpendicular to the previous); (3) the annulus area (2D and 3D); and (4) the annulus perimeter (2D and 3D) (Figure 1). Leaflet measurements were performed at end-systole and mid-diastole. The software generated the area and maximal length of two leaflets, the septal, and the combination of the anterior and posterior leaflets. No attempt to FTR quantification was made intraoperatively, as TR severity is notably underestimated under general anaesthesia.
2.3 Intraoperative pictures
After right atriotomy, the tricuspid valve was exposed using a standard atrial retractor (Cosgrove Valve Retractor System – Kapp Surgical Instrument Inc.) in an attempt to maximize the exposure of the tricuspid annulus and leaflets. We positioned a sterile ruler onto the annulus for calibration (Figure 2).
We first photographed the valve without leaflet retraction in order to visualize the annulus. Thereafter, we exposed each leaflet by means of a slight retraction to take selective images. We use ImageJ, an open source image processing software designed for scientific multidimensional images, to perform the post hoc data processing. Similar to the 3D-echo evaluation, four annular dimensions were selected: (1) maximal diameter from the septum to the anterior leaflet (septal-anterior diameter); (2) the latero-lateral diameter (the largest diameter perpendicular to the previous); (3) the annulus area; and (4) the annulus perimeter. We traced the leaflet area, (trace of the leaflet until the origin of the chordae) and the leaflet length (maximal distance between the free margin and the base). Again, we combined the leaflet area of the anterior and posterior leaflets in order to compare their measurements with the corresponding 3D echo images.
2.4 Statistical analysis
All analyses were conducted using the RStudio software (Version 1.0.153–© 2009–2017 RStudio, Inc.). Continuous variables were expressed as mean ± standard deviation, categorical variables were expressed as counts and percentages, and follow-up times were expressed as median and range. Continuous variables were compared using the Student’s t-test or Mann–Whitney U-test. Repeated measure analysis of variance (ANOVA) was used to compare TA 3D-echo measurements at each pre-specified time points. Categorical variables were compared using the χ2, or Fisher’s exact test where appropriate. All tests were two-sided and a p-value < 0.05 was considered statistically significant. Agreement between methods of TA measurements was assessed using the Bland–Altman method [4]. Multivariate regression analysis was used to identify significant predictors of preoperative tricuspid regurgitation. We used a multi criteria method to identify significant parameters in the multivariate analysis with Akaike information criterion (AIC), Mallows’ Cp, and adjusted R². The best combination of those parameters were used to construct the final model. Variance inflation factors (VIF) using cut-off of 10 was used to check for multicollinearity. Receiver operating characteristic (ROC) curves were used to calculate areas under the curve (AUC) and to derive optimal cut-off values. Intra- and inter-observer agreements for annular measurements were tested using to the Bland–Altman method as well as intraclass correlation coefficients.
3. Results
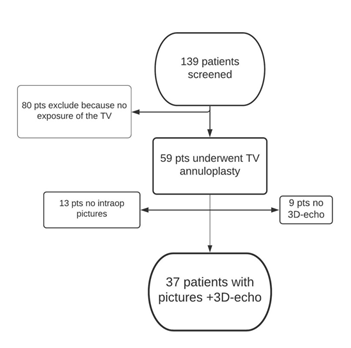
The final study population consisted of 37 patients, in whom both intraoperative pictures and a complete 3D TEE examination of the tricuspid valve were available. Figure 2 shows the flowchart of patient selection. Table 1 shows the demographic and clinical characteristics of the study population categorized according to the baseline severity of FTR.
|
[ALL] N=37 |
≤ Mild N=18 |
Moderate N=8 |
Severe N=11 |
p value |
|
|
Age |
63.0±15.9 |
58.8±12.2 |
65.0±22.7 |
68.5±15 |
0.27 |
|
Male |
17 (45.9%) |
9 (50%) |
4 (50%) |
4 (36.4%) |
0.76 |
|
HTA |
18 (48.6%) |
6 (33.3%) |
5 (62.5%) |
7 (63.6%) |
0.19 |
|
Diabetes |
5 (13.5%) |
1 (5.6%) |
2 (25%) |
2 (18.2%) |
0.39 |
|
Smoke |
4 (10.8%) |
2 (11.1%) |
1 (12.5%) |
1 (9.1%) |
1 |
|
BPCO |
1 (2.7%) |
0 (0%) |
1 (12.5%) |
0 (0%) |
0.22 |
|
Kidney Failure |
3 (8.1%) |
0 (0%) |
1 (12.5%) |
2 (18.2%) |
0.12 |
|
PVD |
1 (2.7%) |
0 (0%) |
0 (0%) |
1 (9.1%) |
0.51 |
|
SR |
17 (45.9%) |
11 (61.1%) |
2 (25.0%) |
4 (36.4%) |
0.22 |
|
CVA |
1 (2.7%) |
0 (0%) |
1 (12.5%) |
0 (0%) |
0.22 |
|
Carpentier class: |
0.31 |
||||
|
I |
1 (2.7%) |
0 (0%) |
0 (0%) |
1 (9.1%) |
|
|
II |
23 (62.2%) |
12 (66.7%) |
5 (62.5%) |
6 (54.5%) |
|
|
IIIa |
11 (29.7%) |
6 (33.3%) |
3 (37.5%) |
2 (18.2%) |
|
|
IIIb |
2 (5.4%) |
0 (0%) |
0 (0%) |
2 (18.2%) |
|
|
BSA |
1.9±0.3 |
1.9±0.3 |
1.9±0.2 |
1.9±0.3 |
0.97 |
Table 1: Patient demographic characteristics in function the degree of functional tricuspid regurgitation.
HTA= Hypertension; COPD== Chronic Obstructive Pulmonary Disease; PVD= Peripheral Vascular Disease; CVA= Cerebral Vascular Accidents; BSA= Body Surface Area
3.1 Annular dimension
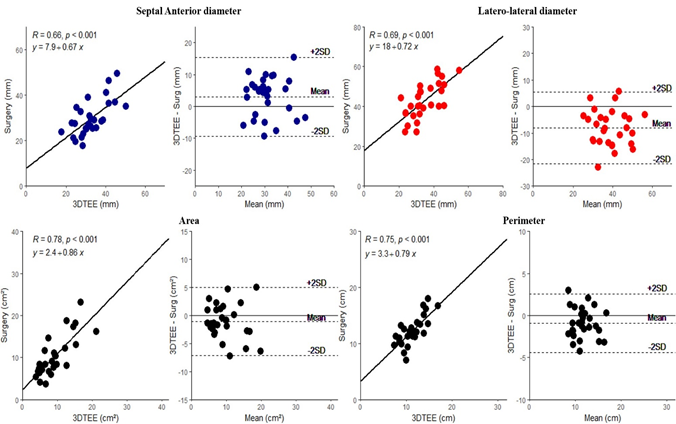
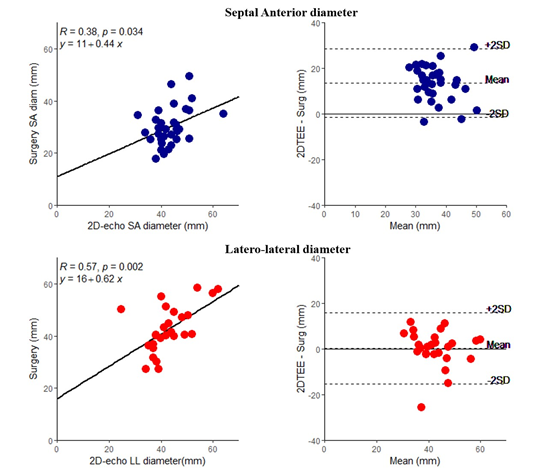
Table 2 compares direct intraoperative measurements of the tricuspid annulus with similar measurements by 2D and 3D echocardiography. As shown, at each time points, both 2D and 3D echo overestimated the intraoperative septal-anterior diameters, while at the same time it underestimated both the latero-lateral diameters, and perimeter. By contrast, annular areas were similar between 3D echo and surgery. As shown in figures 3, intraoperative surgical annular dimensions correlated well with those measured by 3D echo. Correlations with 2D echo were poorer (Figure 4).
|
SA diam (mm) |
LL diam (mm) |
Area (cm²) |
Perimeter (cm) |
||
|
In vivo Measurement |
30.1±7.3† |
42.9±8.3† |
10.2±4.5 |
12.2±2.4† |
|
|
3D TEE Measurement |
|||||
|
Early-systole |
33.1±7.9 |
34.2±9.3 |
9.53±4.8 |
11.2±2.7 |
|
|
Mid-systole |
33.2±8.2 |
34.4±8.8 |
9.62±4.6 |
11.2±2.7 |
|
|
Late-systole |
32.9±8.1 |
34.4±8.3 |
9.56±4.5 |
11.2±2.5 |
|
|
Early-diastole |
32.9±8* |
35.1±8.7 |
9.85±4.6 |
11.4±2.5 |
|
|
Mid-diastole |
33.8±8.1 |
34.9±8.6* |
9.96±4.6* |
11.5±2.5* |
|
|
Late-diastole |
33.3±8.4 |
34.4±8.8 |
9.66±4.7 |
11.3±2.6 |
|
Table 2: Annular measurements
SA= Septal-anterior; LL= Latero-lateral; diam= diameter; TEE= Trans Oesophageal echocardiography.
* = Highest correlation between surgical and 3D TEE measurement;
†= significant (p value<0.05) difference compare the surgical measurement to 3D measurement for each time points
3.2 Leaflet dimensions
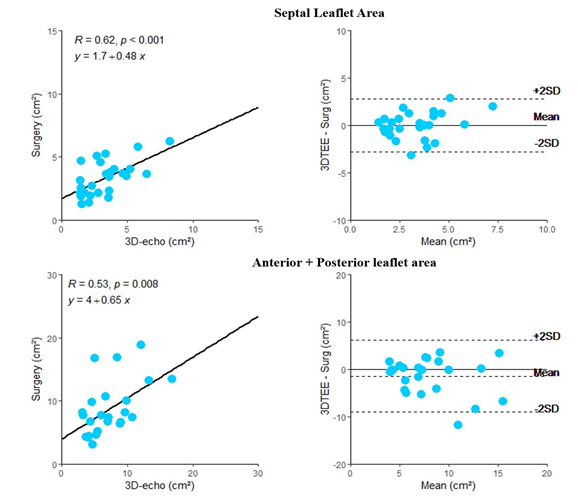
As shown in Table 3, the systolic area of the septal leaflet was similar between the surgical and 3D echo measurements, whereas the diastolic area, septal length, and combined area of the anterior and posterior leaflets were significantly different. Correlation coefficients between leaflet measurements ranged from 0.53 to 0.62 (Supplementary material - Figure 1).
|
SL area |
SL length |
A+P area |
|
|
In vivo Measurement |
3.2±1.3 |
1.7±0.5 |
8.5±4.1 |
|
3D TEE Measurement |
|||
|
Systolic |
3.8±2.7 |
1.5±0.6† |
7±3.3† |
|
Diastolic |
4.6±2.5† |
1.4±0.4† |
9.6±5.5† |
Table 3: Leaflet measurements
SL= Septal Leaflet; A+P = Anterior + Posterior Leaflet; TEE = Trans oesophageal echocardiography;
†= significant p value (< 0.05) comparing TEE to the surgical measurement.
3.3 Relationship with FTR
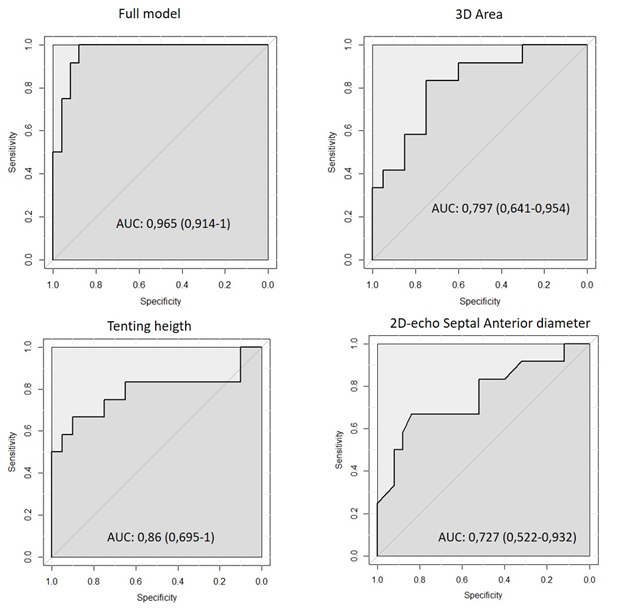
Table 4 shows the univariate and multivariate determinants of preoperative FTR. Multivariate linear regression analysis identified 3D echocardiographic area and tenting height as independent predictors of preoperative tricuspid regurgitation. As shown in Table 5 (Supplementary material Figure 2), ROC analysis was used to identify best cut-off values for the entire model as well each of its individual components and to calculate their ability to predict severe preoperative FTR. As shown, preoperative FTR was best predicted by the multivariate model (AUC=0.96; Sensitivity=100%, Specificity=88%), followed by 3D annular Area (AUC=0.79; Sensitivity=81%, Specificity=69%) and tenting height (AUC =0.86; Sensitivity=72%, Specificity=92%). Interestingly 2D annular diameter also predicted severe preoperative FTR (AUC=0.72; Sensitivity=50%, Specificity=81%) albeit less significantly so than 3D echo measurements. The intra and inter-observer variability for the annular measurements is shown in table 6. For both surgical and 3D TEE measurements, the inter and intraobserver reproducibility was good for area and perimeter but lower for linear diameter.
|
Univariate analysis |
Multivariate analysis |
|||||
|
Estimate |
Std.Error |
P.Value |
Estimate |
Std.Error |
P.Value |
|
|
Tenting.Height |
0.85 |
0.12 |
<0.001 |
0.62 |
0.26 |
0.024 |
|
RV diastolic area |
0.29 |
0.07 |
<0.001 |
|||
|
ES.Circumference |
0.96 |
0.24 |
<0.001 |
7.17 |
1.63 |
0.01* |
|
ES - LL diameter |
3.19 |
0.82 |
<0.001 |
|||
|
LS.SA- Diameter |
2.81 |
0.8 |
0.001 |
|||
|
LS. 3D Area. |
0.47 |
0.14 |
0.001 |
11.71 |
4.18 |
0.01 |
|
RV. Basal diameter. |
0.22 |
0.06 |
0.002 |
|||
Table 4: Results from Uni and Multivariate regression analysis for the preoperative FTR.
RV= right ventricle; ES=Early Systole; LL= Latero-lateral; LS= Late Systole; SA=Septal Anterior;
*After control for multicollinearity Circumference was exclude by the final model.
|
Threshold |
Sensitivity |
Specificity |
Accuracy |
|
|
Full model |
6.7 |
1 |
0.88 |
0.92 |
|
3D Circumference |
10.8 |
0.82 |
0.69 |
0.78 |
|
3D Area |
9 |
0.82 |
0.69 |
0.78 |
|
Tenting Heigth |
4.1 |
0.73 |
0.92 |
0.81 |
|
2D-echo SA diam |
42.5 |
0.5 |
0.8 |
0.75 |
Table 5: Cut-off results from the ROC analysis
3D= 3 dimensional; 2D= 2 dimensional; SA= Septal Anterior
|
Intra observer variability ICC |
Inter observer variability ICC |
|
|
In vivo: |
||
|
Area |
0.85 (0.74-0.91) |
0.81 (0.73-0.91) |
|
3D TEE: |
||
|
Area |
0.89 (0.75-0.95) |
0.81 (0.59-0.92) |
|
Perimeter |
0.87 (0.725-0.95) |
0.80 (0.58-0.91) |
|
SA diameter |
0.81(0.58-0.92) |
0.72 (0.43-0.88) |
|
LL diameter |
0.79 (0.56-0.91) |
0.59 (0.22-0.81) |
Table 6: Intra and intra observer variability.
ICC= Intra Class Correlation: 3D= 3 dimensional; TEE=Trans oesophageal echocardiography; SA= Septal Anterior; LL= Latero-lateral
4. Discussion
The aim of the present study was to compare in vivo 2D and 3D echo measurements of the TA and leaflets with their corresponding intraoperative equivalents. Our results can be summarized as follows:
- 3D echo and intraoperative measurements of the TA area and perimeter were similar and correlated well.
- Two-dimensional TA diameters significantly differed between 3D echo and intraoperative measurements. These measures were also poorly correlated.
- Systolic leaflet area were similar by the two methods, but also poorly correlated.
- By multivariate analysis, annulus area, perimeters and tenting height, but not diameters, were significant predictors of the severity of preoperative tricuspid regurgitation.
Tricuspid annulus is a complex saddle shaped non-circular structure, whose septal-anterior dimensions usually are 30% smaller than its latero-lateral dimensions. In the presence of FTR, this phenomenon becomes exaggerated, the anterior dimension dilating more than the septal one. Theoretically, this should make it difficult to identify a single diameter that accurately reflects the overall dilatation of the TA. To test this, we measured TA dimensions using 2D and 3D echo and validated these measurements against direct intraoperative sizing of the tricuspid annulus. Our study demonstrates for the first time that area and perimeter measurements of TA not only correlate better than diameters with in vivo measurements, but also correlate better with the severity of FTR than 2D diameters. Similar findings, i.e. poor correlation between 3D echo and intraoperative TA diameters, were recently reported by Dreyfus et al. [5] Unfortunately, these authors did not report on the measurements of TA area and perimeter.
Some other studies compared 2D- and 3D-echo measurements of the TA. Anwar et al. [6] and Volpato et al. [7] both reported that 2D-echo TA measurements were significantly smaller than those measured using 3D-echo. These authors also demonstrated a low correlation between 2D-echo TA diameter compared to 3D-echo and MRI (r=0.5). However, none of these studies attempted to validate their measurements against an in vivo reference standard. They nonetheless underline the limits of the 2D methodology in assessing complex 3D objects, such as the TA. Recent valve treatment guidelines [1] recommend performing tricuspid valve annuloplasty in the mere presence of tricuspid annular dilatation irrespective of the severity of concomitant FTR. In this context, accurate quantification of annular dimensions becomes of paramount importance, as underestimation of these dimensions could lead to an increased risk of late FTR development, heart failure symptoms, and RV dysfunction [8], whereas overestimation could lead to an unnecessary overtreatment. The threshold recommended by the current guidelines to indicate tricuspid surgery (i.e. septal-anterior diameter ≥ 40 mm) was initially proposed by Chopra et al [9] in 1989. Those authors studied 90 patients undergoing left heart valve surgery and observed that 88% of patients with severe TR exhibited a maximum diastolic SA diameter ≥ 38 mm or 21 mm/m². The present study confirms that an SA diameter ≥ 42 mm modestly predicts severe FTR with a sensitivity of 50% and a specificity of 81%, thus corroborating the cut-off value proposed by the guidelines. Our results nonetheless show that 3D-echo measurements of annular area/perimeter and tenting height provide a much better prediction of FTR severity and should be therefore preferred as compared to 2D-echo.
4.1 Study limitations
Our paper has several limitations. First, in the absence of an analysis software dedicated to the tricuspid valve, we used a vendor-independent software primarily designed for the mitral valve. This forced us to consider the tricuspid valve as a two-commissure structure rather than a three-commissure structure; accordingly, we were obliged to fuse the anterior and posterior leaflet and to consider them as a single leaflet. This probably explains the poor correlation found between 3D echo and in vivo leaflet measurements. Yet we don’t believe this affected the measurements of annular area and perimeter, as demonstrated by the good correlation between 3D echo and in vivo measurements. Second, the in vivo evaluation was done on a flaccid heart while gently retracting the right atrium wall to optimize the exposure. This probably explains the modest correlations found between 3D echo and in vivo annular diameter measurements. It also probably explains the better correlation found between areas and perimeters by the two methods. Lastly, the absence of intraoperative TR severity measurements could be viewed as limitation. However, TR severity is known to be load dependent and significantly underestimated under general anesthesia. This is the reason why preoperative and not intraoperative echo measurements were used in our analysis.
5. Conclusion
Our work demonstrates the superiority of 3D- compared to 2D-echo in quantifying the degree of TA dilatation and in predicting the severity of FTR. Among the quantitative parameters derived from 3D-echo, TA area and perimeter were found to best correlate both with their intraoperative counterparts and baseline FTR severity. This suggests that 3D-echo should be the preferred method to evaluate TA dilatation and eventually indicate tricuspid surgery.
References
- Vahanian A, Iung B, Hamm C, et al. 2017 ESC/EACTS Guidelines for the management of valvular heart disease. Eur Heart J 38 (2017): 2739-2791.
- Pettinari M, De Kerchove L, Lazam S, et al. Mid-term results of a randomized trial of tricuspid annuloplasty for less-than-severe functional tricuspid regurgitation at the time of mitral valve surgery. Eur J Cardio-Thoracic Surg 21 (2019): 21-29.
- Hahn RT. State-of-the-art review of echocardiographic imaging in the evaluation and treatment of functional tricuspid regurgitation. Circ Cardiovasc Imaging 14 (2016): 13-21.
- Martin Bland J, Altman DG. Statistical methods for assessing agreement between two methods of clinical measurement. Lancet 11 (1986): 29-32.
- Dreyfus J, Durand-Viel G, Raffoul R, et al. Comparison of 2-dimensional, 3-dimensional, and surgical measurements of the tricuspid annulus size clinical implications. Circ Cardiovasc Imaging 12 (2015): 11-21.
- Anwar AM, Geleijnse ML, Cate FJ, et al. Assessment of tricuspid valve annulus size, shape and function using real-time three-dimensional echocardiography. Interact Cardiovasc Thorac Surg 5 (2006): 683-687.
- Volpato V, Lang RM, Yamat M, et al. Echocardiographic Assessment of the Tricuspid Annulus: The Effects of the Third Dimension and Measurement Methodology. J Am Soc Echocardiogr 19 (2019): 34-45.
- Chikwe J, Adams DH. The donkey’s shadow. J Thorac Cardiovasc Surg 154 (2017): 125-126.
- Chopra HK, Nanda NC, Fan P, et al. Can two-dimensional echocardiography and Doppler color flow mapping identify the need for tricuspid valve repair? J Am Coll Cardiol 14 (1989): 1266-1274.

