Comparative Study of CT Chest Imaging Spectrum and CT- Severity Scores of Covid-19 Pneumonia Among Patients With and Without Comorbidities
Article Information
Kavya N1, Sharanayya2, M. Bharathi3
1Post graduate student, Department of Radiodiagnosis, Navodaya Medical College and Hospital, Raichur, Karnataka, India
2Assistant Professor, Department of Radiodiagnosis, Navodaya Medical College and Hospital, Raichur, Karnataka, India 3Professor and Head of Department, Department of Radiodiagnosis, Navodaya Medical College and Hospital, Raichur, Karnataka, India
*Corresponding Author: Kavya N, Junior resident, Department of Radiodiagnosis, Navodaya Medical College and Hospital, Raichur 584103, Karnataka, India
Received: 10 May 2021; Accepted: 17 May 2021; Published: 4 June 2021
Citation: Kavya N, Sharanayya, M. Bharathi. Comparative Study of CT Chest Imaging Spectrum and CT- Severity Scores of Covid-19 Pneumonia Among Patients with and without comorbidities. Journal of Radiology and Clinical Imaging 4 (2021): 067-080.
Share at FacebookAbstract
Aim: The present study aimed at comparing the severity of COVID-19 infection on high- resolution chest computed tomography (CT) and spectrum of disease between patients with and without comorbidities.
Methods: It is a Retrospective study comprising 110 RT-PCR Covid positive patients who underwent HRCT chest on-day 3-5 of admission. Among 110 patients 55 patients with various comorbidites were taken as Group A. 55 patients without comorbidities were taken as Group B. Both groups were in the similar range of age-group. The subjects were categorized into mild, moderate & severe based on the CT-severity score. Distribution, extent & type of abnormal lung findings were recorded.
Results: Among 110 subjects, 4 patients in Group A & 9 patients in Group B did not show any lung abnormalities. Extensive & multiple patches of GGO’s, Multiple patches of consolidation were more in Group A than Group B. Whereas scattered and few patches of GGO’s were present more in Group B. Fibrotic changes like carzy- paving & subpleural bands, vascular dilatation, bronchiectasis were more among Group A than Group B. In both Group A & Group B patients extensive GGO’s, multiple patches of consolidation were present in severe patients. Mild to moderate type patients showed scattered patches of GGO’s, few patchy consolidations. Fibrotic changes were more among severe patients.
Conclusion: High CT severity was noted among patients with comorbidities. CT chest findings show that there is extensive involvement of lungs among patients with comorbidities in comparison to patients without comorbidities.
Keywords
Chest computed tomography; Imaging Spectrum; Lung abnormalities
Covid-19 articles
Chest computed tomography articles Chest computed tomography Research articles Chest computed tomography review articles Chest computed tomography PubMed articles Chest computed tomography PubMed Central articles Chest computed tomography 2023 articles Chest computed tomography 2024 articles Chest computed tomography Scopus articles Chest computed tomography impact factor journals Chest computed tomography Scopus journals Chest computed tomography PubMed journals Chest computed tomography medical journals Chest computed tomography free journals Chest computed tomography best journals Chest computed tomography top journals Chest computed tomography free medical journals Chest computed tomography famous journals Chest computed tomography Google Scholar indexed journals Imaging Spectrum articles Imaging Spectrum Research articles Imaging Spectrum review articles Imaging Spectrum PubMed articles Imaging Spectrum PubMed Central articles Imaging Spectrum 2023 articles Imaging Spectrum 2024 articles Imaging Spectrum Scopus articles Imaging Spectrum impact factor journals Imaging Spectrum Scopus journals Imaging Spectrum PubMed journals Imaging Spectrum medical journals Imaging Spectrum free journals Imaging Spectrum best journals Imaging Spectrum top journals Imaging Spectrum free medical journals Imaging Spectrum famous journals Imaging Spectrum Google Scholar indexed journals Lung abnormalities articles Lung abnormalities Research articles Lung abnormalities review articles Lung abnormalities PubMed articles Lung abnormalities PubMed Central articles Lung abnormalities 2023 articles Lung abnormalities 2024 articles Lung abnormalities Scopus articles Lung abnormalities impact factor journals Lung abnormalities Scopus journals Lung abnormalities PubMed journals Lung abnormalities medical journals Lung abnormalities free journals Lung abnormalities best journals Lung abnormalities top journals Lung abnormalities free medical journals Lung abnormalities famous journals Lung abnormalities Google Scholar indexed journals COVID-19 articles COVID-19 Research articles COVID-19 review articles COVID-19 PubMed articles COVID-19 PubMed Central articles COVID-19 2023 articles COVID-19 2024 articles COVID-19 Scopus articles COVID-19 impact factor journals COVID-19 Scopus journals COVID-19 PubMed journals COVID-19 medical journals COVID-19 free journals COVID-19 best journals COVID-19 top journals COVID-19 free medical journals COVID-19 famous journals COVID-19 Google Scholar indexed journals RT-PCR articles RT-PCR Research articles RT-PCR review articles RT-PCR PubMed articles RT-PCR PubMed Central articles RT-PCR 2023 articles RT-PCR 2024 articles RT-PCR Scopus articles RT-PCR impact factor journals RT-PCR Scopus journals RT-PCR PubMed journals RT-PCR medical journals RT-PCR free journals RT-PCR best journals RT-PCR top journals RT-PCR free medical journals RT-PCR famous journals RT-PCR Google Scholar indexed journals HRCT articles HRCT Research articles HRCT review articles HRCT PubMed articles HRCT PubMed Central articles HRCT 2023 articles HRCT 2024 articles HRCT Scopus articles HRCT impact factor journals HRCT Scopus journals HRCT PubMed journals HRCT medical journals HRCT free journals HRCT best journals HRCT top journals HRCT free medical journals HRCT famous journals HRCT Google Scholar indexed journals intensive care unit articles intensive care unit Research articles intensive care unit review articles intensive care unit PubMed articles intensive care unit PubMed Central articles intensive care unit 2023 articles intensive care unit 2024 articles intensive care unit Scopus articles intensive care unit impact factor journals intensive care unit Scopus journals intensive care unit PubMed journals intensive care unit medical journals intensive care unit free journals intensive care unit best journals intensive care unit top journals intensive care unit free medical journals intensive care unit famous journals intensive care unit Google Scholar indexed journals Image articles Image Research articles Image review articles Image PubMed articles Image PubMed Central articles Image 2023 articles Image 2024 articles Image Scopus articles Image impact factor journals Image Scopus journals Image PubMed journals Image medical journals Image free journals Image best journals Image top journals Image free medical journals Image famous journals Image Google Scholar indexed journals hypothyroidism articles hypothyroidism Research articles hypothyroidism review articles hypothyroidism PubMed articles hypothyroidism PubMed Central articles hypothyroidism 2023 articles hypothyroidism 2024 articles hypothyroidism Scopus articles hypothyroidism impact factor journals hypothyroidism Scopus journals hypothyroidism PubMed journals hypothyroidism medical journals hypothyroidism free journals hypothyroidism best journals hypothyroidism top journals hypothyroidism free medical journals hypothyroidism famous journals hypothyroidism Google Scholar indexed journals diabetes mellitus articles diabetes mellitus Research articles diabetes mellitus review articles diabetes mellitus PubMed articles diabetes mellitus PubMed Central articles diabetes mellitus 2023 articles diabetes mellitus 2024 articles diabetes mellitus Scopus articles diabetes mellitus impact factor journals diabetes mellitus Scopus journals diabetes mellitus PubMed journals diabetes mellitus medical journals diabetes mellitus free journals diabetes mellitus best journals diabetes mellitus top journals diabetes mellitus free medical journals diabetes mellitus famous journals diabetes mellitus Google Scholar indexed journals
Article Details
1. Introduction
Coronavirus disease 2019 (COVID-19), which is caused by the novel coronavirus (2019- nCoV has rapidly spread in different parts of country. (WHO) report, by 4 April 2020, there were 1,000,000 confirmed Group A globally, including 82,574 in China, and 56,985 deaths worldwide [1]. Management of critically ill patients is important to reduce the mortality of COVID-19. Several studies showed mortality was more in the patients with comorbidities than patients without comorbidities and CT is a useful imaging modality in the diagnostic evaluation of abnormal lung changes in the patients [2-5]. Larger proportion of intermediate (87%) and medial (62%) areas were involved in critically ill patients, which was in contrast with the predominant peripheral involvement in the mild and moderate patients [2, 6-8]. The predominant symptoms of COVID-19 are fever, cough, fatigue, myalgia, expectoration, shortness of breath and sore throat [9]. Other few symptoms related to gastrointestinal tract like anorexia, nausea, vomiting, abdominal pain, diarrhoea and mesenteric ischemia are seen in few of the patients [10, 11]
Hence this retrospective comparative study investigated chest HRCT findings in patients with comorbidities suffering from COVID-19 and between those without comorbidities.
2. Material and Methods
2.1 Patients and study design
This was a retrospective study, conducted in Navodaya Medical college, Raichur, Karnataka India, which was a designated COVID-19 hospital with separate inpatient, intensive care unit (ICU) and quarantine facilities. 110 consecutive symptomatic patients referred to our hospital from various districts were subjected to chest CT after obtaining nasopharyngeal swab for RT-PCR.
We reviewed the medical record of 110 RT-PCR positive patients who underwent the CT Chest. Out of which 55 patients were with comorbidities like hypertension, diabetes, IHD, hypothyroidism and asthma were considered as Group A and 55 patients without any known comorbidities were considered as Group B. The patients were categorized in to mild, moderate and severe categories based on the CT- severity score.
2.2 CT Chest examination
All the 110 subjects underwent CT Chest on day 3 to 5 days of admission. The patients were scanned in the supine position on a 16-slice scanner, during inspiratory breath hold. The scanning range was from the apex to the base of the lungs. Scanning parameters were as follows: tube voltage 100–120 kV, tube current 100–250, data acquisition of 1,25 mm, pitch of 1.2. Volume data was reconstructed with a slice thickness of 1.0 mm for each scan.
2.3 Chest CT evaluation
All the CT images were independently analysed by 2 senior radiologists (Dr. M. Bharathi, Dr. Sharanayya with 20years and 9 years of experience). The inter observer variation was very minimal (kappa coefficient 0.89). The following CT characteristics were recorded: (a) involvement of the pulmonary lobes and distribution of the lesion; (b) presence of lesion in terms of imaging appearances, such as ground-glass opacities (GGO), consolidation, and linear opacities; (c) accompanying signs such as crazy-paving pattern, air bronchogram, and margin of the lesion; (d) presence of underlying lung disease such as emphysema, fibrosis, and calcification; (e) presence of other abnormalities, including pleural effusion, pericardial effusion, and thoracic lymphadenopathy.
The terms of abnormal imaging appearances were defined according to the guidelines provided by the Fleischner Society [12].
- GGO was defined as hazy increased lung density, with indistinct margins of bronchus and pulmonary
- Consolidation was defined as increased pulmonary parenchymal attenuation, with the margins of the bronchus and the pulmonary vessels being obscured.
- Crazy-paving pattern was defined as GGO combined with reticulation or/and interlobular septal
- An air bronchogram is an air-filled bronchus seen clearly with low density on a background of GGO or consolidation
- The margin of the lesion was defined as sharp or
- Thoracic lymphadenopathy was defined as the short-axis dimension of lymph node ≥ 10 mm
To further assess the abnormalities in CT images, the following parameters were analyzed: Degree of involvement of lungs by GGO was classified as
- Extensive if more than 75% lung fields involved, multiple patches (50-75%) and scattered if less than 50%involvement.
- Consolidation was considered as none (0%), multiple patches (> 50% lung fields showed), Scattered (< 50%).
2.4 Statistical analysis
The present hospital based, retrospective study conducted on 110 COVID-19 patients at Navodaya Medical College Hospital, Raichur, to study the clinical manifestation, co morbid status, HRCT chest characteristics and clinic-radiological progression of disease for emerging COVID-19 infection at, Navodaya Medical college Raichur Karnataka. The descriptive statistics for quantitative data was expressed as mean and standard deviation and qualitative data was expressed as proportions.
3.Results
3.1 Demographics and clinical characteristics
Among the total retrospective study of 110 RT-PCR Covid positive patients, 55 patients (50%) were with comorbidities, and they were taken as Group A. 55 (50%) patients were without any associated comorbidities were taken as Group B.
Group A
Among 55 Group A, 22 (40%) were females and 33 (60%) were males with mean age of 55.9 ± 10.20 years in (range of 30-70yrs). 36 (65.45%) Were known case of hypertension, 30 (54.54%) diabetes mellitus, 8 (24.54%) hypothyroidism, 2 (3.63%) asthma, 4 (7.27%) ischemic heart disease, 1 (1.87%) COPD and CLD and CVA cases. (Above findings are summarized in Table 1).
Group B
Among 55 Group B, 16.13 (23.63%) were females and 13 (42%) were males with mean age of 47.2 ± 16.13 SD years in (range of 30-70yrs). (Above findings are summarized in Table 2).
3.2 CT chest features
3.2.1 Comparison of spectrum and distribution of covid CT chest finding among Group A and Group B: Among 110 subjects, 4 Group A & 9 Group B patients RT-PCR covid positive did not show any lung abnormalities. We observed higher percentage of extensive and multiple patches of GGO, s was in Group A than Group B (P < 0.05, respectively).
Whereas scattered GGO’S were predominant in Group B (45.0%) than Group A (29.0%) (P < 0.05, respectively).
We observe that multiple patches of consolidation were high in number in Group A than Group B (P < 0.05, respectively), whereas few patches of consolidation were predominant among Group B (P < 0.05, respectively).
Group A had showed more crazy paving, subpleural bands, vascular dilatation, and bronchial thickening in comparison to Group B (P < 0.05, respectively). (Above findings are summarized in Table 3).
3.3 Distribution of the CT- Chest findings among Group A and Group B according to the CT-severity score
3.3.1 Categorization of Group A according to CT-severity score: Among 55 Group A, 4 (7.27%) Group A patients did not show any chest findings, 11 (20%) were categorised as mild, 15 (27.27%) were moderate and 25 (45.45%) were severe (Above findings are summarized in Table 4).
3.3.2 CT severity score distribution among the comorbidities: Among the hypertensives 19 (52.77%) were severe, 10 (27.7%) were moderate, 7 (19.4%) were mild. Among the diabetes 17 (56.6%) were severe, 9 (30%) were moderate, 4 (13.3%) were mild. Among the Hypothyroidism 2 (25%) were severe, 2 (25%) were moderate, 4 (50%) were mild. Among the IHD 4 (100%) were severe. Among the asthma patients 1 (50%) was moderate, 1 (50%) was mild. COPD and CVA patients 1(100%) were moderate patients. (Above findings are summarized in Table 5).
3.3.3 Categorization of Group B: Among Group B, 9 (16.36%) Group B did not show any findings, 24 (43.63%) were, categorized as mild, 13 (23.63%) were moderate and 9 (16.36) were severe. Above findings are summarized in (Table 6).
3.3.4 Distribution of the CT- Chest findings among Group A according to the CT- severity score: High percentage of extensive GGO’s were present in severe, Moderate had more of multiple patches of GGO’s and mild Group A patients showed more of scattered GGO’s. Severe category Group A patients showed more of multiple patches of consolidation, moderate category Group A patients had more of few patches of consolidation. Crazy Paving, subpleural bands, vascular dilatation, bronchiectasis, bronchial thickening, and cardiomegaly were more among the severe category Group A patients. Above findings are summarized in (Table 7).
3.3.5 Distribution of the CT- Chest findings among Group B according to the CT- severity score: High percentage of extensive GGO’s were present in severe, Moderate had more of multiple patches of GGO’s and mild Group B patients showed more of scattered GGO’s. Severe category Group B patients showed more of multiple patches of consolidation, moderate category had more of few patches of consolidation.Crazy Paving, subpleural bands, vascular dilatation, bronchiectasis, bronchial thickening were more among the severe category Group B patients. Above findings are summarized below (Table 8).
|
Patient demographics |
N=55 |
% |
|
Mean age |
55.9+/10.20 |
|
|
Female |
22 |
40 |
|
MALE |
33 |
60 |
|
Comorbidities |
||
|
HTN |
36 |
65.45 |
|
Diabetes mellitus |
30 |
54.54 |
|
Hypothyroidism |
8 |
24.54 |
|
Asthma |
2 |
3.63 |
|
Ischemiac heart disease |
4 |
7.27 |
|
COPD |
1 |
1.81 |
|
CVA |
1 |
1.81 |
|
CLD |
1 |
1.81 |
Table 1: Demographic data of group A.
|
Patient demographics |
N = |
% |
|
Mean age female male |
47.2+/-16.13 |
|
|
Comorobidities |
13 |
|
|
42 |
23.63 |
|
|
0 |
76.36 |
|
|
0 |
Table 2. Demographic data of Group B.
|
CT-Chest findings |
GROUP A |
GROUP B |
|||
|
N=55 (4 group A no findings) |
N=55 (9 group A no findings) |
Inference |
|||
|
NO |
% |
NO |
% |
||
|
1.GCO’s |
|||||
|
1.Extensive |
19 |
34.5 |
6 |
10.9 |
Group A> Group B |
|
2.multiple |
16 |
29.09 |
15 |
27.27 |
Group A>Group B |
|
3.scattered patches |
16 |
29.09 |
25 |
45.45 |
Group B> Group A |
|
2.Consolidation |
17 |
30.9 |
11 |
20 |
Group A> Group B |
|
a. Multiple patches |
11 |
20 |
12 |
21.81 |
Group B> Group A |
|
b. Few patches |
13 |
23.63 |
23 |
41.81 |
Group A> Group B |
|
c. NIL |
14 |
24.45 |
9 |
16.36 |
|
|
4.Subpleural bands |
27 |
49.09 |
7 |
12.72 |
Group A> Group B |
|
5.Vascular dilatation |
22 |
40 |
7 |
12.72 |
Group A>Group B |
|
6.Bronchiectasis |
13 |
23.63 |
3 |
5.45 |
Group A> Group B |
|
7.Pleural effusion |
3 |
5.45 |
1 |
1.81 |
Group A> Group B |
|
8.Bronchial thickening |
7 |
12.72 |
0 |
0 |
Group A> Group B |
|
9.Cardiomegaly |
12 |
21.81 |
1 |
1.81 |
Group A> Group B |
|
10.Lung cyst / emphysema |
1 |
1.8 |
1 |
1.81 |
Group A> Group B |
Table 3. Comparison of spectrum and distribution of covid CT chest finding among Group A and Group B.
|
Severity |
N= 55 |
% |
|
Mild |
11 |
20 |
|
Moderate |
15 |
27.27 |
|
Severe |
25 |
45.45 |
|
Nil |
4 |
7.27 |
Table 4. Categorization of GROUP A According to CT-severity score.
|
Comorbidities |
Mild |
Moderate |
Severe |
|||
|
N |
% |
N |
% |
N |
% |
|
|
Hypertension |
7 |
19.44 |
10 |
27.77 |
19 |
52.77 |
|
Diabetes mellitus |
4 |
9 |
9 |
13.3 |
17 |
56.6 |
|
Hypothyroidism |
4 |
50 |
2 |
25 |
2 |
25 |
|
IHD |
0 |
0 |
0 |
0 |
4 |
100 |
|
Asthma |
1 |
50 |
1 |
0 |
0 |
0 |
|
COPD |
0 |
0 |
1 |
100 |
0 |
0 |
|
CVA |
0 |
0 |
1 |
100 |
0 |
0 |
|
CLD |
1 |
100 |
0 |
0 |
0 |
0 |
Table 5. CT severity score distribution among the patients with comorbidities.
|
Severity |
N= |
% |
|
Mild |
24 |
43.63% |
|
Moderate |
13 |
23.63% |
|
Severe |
9 |
16.36% |
|
Nil |
9 |
16.36% |
Table 6. Categorization of GROUP B according to CT-severity score.
|
CT CHEST FINDINGS |
MILD |
MODERATE |
SEVERE |
|||
|
N=11 |
N=15 |
N=25 |
||||
|
GGO’S |
N |
% |
n |
% |
n |
% |
|
Extensive GGO’S |
0 |
0 |
2 |
13.3 |
17 |
68 |
|
Multiple GGO’S |
1 |
9.09 |
10 |
66.6 |
5 |
20 |
|
Scattered Patches |
10 |
90.9 |
3 |
20 |
3 |
12 |
|
Nil |
0 |
0 |
0 |
0 |
0 |
0 |
|
CONSOLIDATION |
||||||
|
Multiple patches |
0 |
0 |
5 |
33.3 |
22 |
88 |
|
Few Patches |
3 |
27.2 |
7 |
46.66 |
1 |
4 |
|
NIL |
8 |
72.72 |
3 |
20 |
2 |
8 |
|
Crazy paving |
0 |
0 |
11 |
73.33 |
15 |
60 |
|
Sub pleuiral bands |
4 |
36.36 |
10 |
66.66 |
13 |
52 |
|
Vascular dilatation |
1 |
9.09 |
4 |
26.6 |
17 |
68 |
|
Bronchiectasis |
1 |
9.09 |
2 |
13.33 |
7 |
28 |
|
Pleural effusion |
1 |
9.09 |
1 |
6.66 |
1 |
4 |
|
Bronchial thickening |
0 |
0 |
2 |
13.3 |
5 |
20 |
|
Cardiomegaly |
1 |
9.09 |
4 |
26.6 |
7 |
28 |
|
Lung cyst / emphysematous changes |
1 |
9.09 |
0 |
0 |
0 |
0 |
Table 7. Distribution of the CT- Chest findings among Group A according to the CT severity Score.
|
CT CHEST FINDINGS |
MILD N=24(43.63%) |
MODERATE N=13(23.63) |
SEVERE N=9(16.36%) |
|||
|
GGO’S |
N |
% |
n |
% |
n |
% |
|
Extensive GGO’S |
0 |
0 |
0 |
0 |
6 |
66.6 |
|
Multiple GGO’S |
0 |
0 |
12 |
92.30 |
3 |
33.33 |
|
Scattered Patches |
24 |
100 |
1 |
7.69% |
0 |
0 |
|
Nil |
0 |
0 |
0 |
0 |
0 |
0 |
|
CONSOLIDATION |
||||||
|
Multiple patches |
0 |
0 |
4 |
33.33 |
7 |
77.77 |
|
Few Patches |
4 |
16.66 |
8 |
61.53 |
0 |
0 |
|
NIL |
20 |
83.33 |
1 |
7.69 |
2 |
22.22 |
|
CRAZY PAVING |
0 |
0 |
3 |
23.07 |
6 |
66.66 |
|
SUB PLEUIRAL BANDS |
1 |
4.1 |
3 |
23.07 |
3 |
33.3 |
|
VASCULAR DILATATION |
0 |
0 |
4 |
30.76 |
2 |
22.22 |
|
BRONCHIECTASIS |
0 |
0 |
0 |
0 |
0 |
0 |
|
PLEURAL EFFUSION |
0 |
0 |
0 |
0 |
1 |
11.11 |
|
BRONCHIAL THICKENING |
0 |
0 |
0 |
0 |
0 |
0 |
|
CARDIOMEGALY |
0 |
0 |
1 |
7.69 |
0 |
0 |
|
LUNG CYST/ EMPHYSEMATOUS CHANGES |
0 |
0 |
1 |
7.69 |
0 |
0 |
Table 8: Distribution of the CT- Chest findings among Group B according to the CT-severity score.
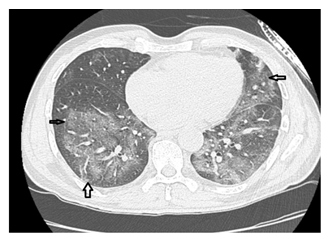
Figure 1: Image in a 52yr old male patient with past history of hypertension, on 3rd day of the admission, axial Chest HRCT without intravenous contrast material show typical findings of corona virus, with peripheral and lower lobe predominance showing extensive ground glass opacities involving more than 75% of bilaterallower lobes.
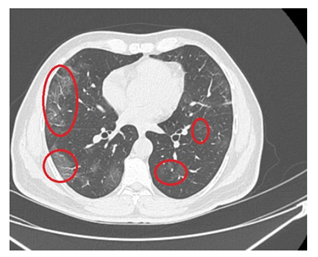
Figure 2: Image in a 60yr old female patient, known diabetic and hypertensive presented with breathlessness, corresponding axial Chest CT scan showed Multiple patches of sub pleural ground glass opacities in bilateral lower lobes.
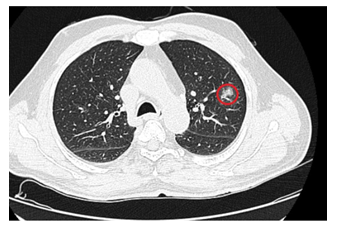
Figure 3: Image in a 35yr old male patient who presented with mild cough and fever, axial non contrast CT chest demonstrated a single rounded peripheral patch of GGO in the left upper lobe.
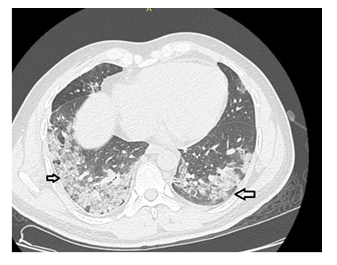
Figure 4: Image in a 65yr old male patient, with past history of diabetes presented with severe breathlessness and fever, axial non contrast HRCT demonstrated multiple patches of consolidation surrounded by sub pleural peripheral ground glass opacities involving bilateral lower zones involving more than 75% of lung fields.
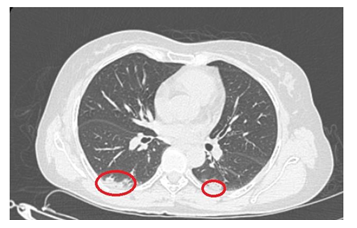
Figure 5: Image in a 40yr old female patient with no past history of comorbidities presented with mild fever and cough. Axial non contrast HRCT chest showed scattered patches of sub pleural consolidations surrounded by ground glass opacities in bilateral lower zones.
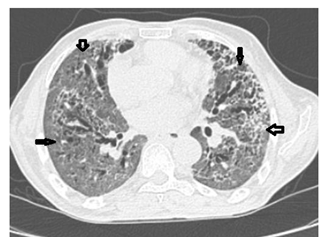
Figure 6: Image in a 55yr old male patient with past history of diabetes mellitus, Ischemaic heart disease. On axial non contrast HRCT chest demonstrated extensive Ground glass opacities involving, more than 75 % of lung fields with interpresed inter lobular septal thickening, Crazy paving pattern predominantly in bilateral lower lobes.
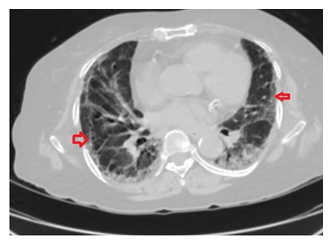
Figure 7: Image in a 45 yr old male patient with no past history presented with severe breathlessness. On axial non contrast HRCT chest on 4th day of admission showed sub pleural bands, and peripheral ground glass opacities with scattered patches of consolidation involving bilateral lower lobes with Mild cardiomegaly.
4. Discussion
The dreadful virus COVID-19 had begun in Wuhan, China and it has spread like wildfire out across the globe. Confirmed COVID-19 cases is being reported from all corners of the world and subsequently World Health Organization (WHO) officially declared COVID-19 a pandemic on March 11, 2020 [13]. Few studies suggest that 2019-nCoV is more likely to infect older people with chronic comorbidities as a result of the weaker immune functions of these patients [14-17].
Our study is a Retrospective Case control study study analysis comprising 110 RT-PCR positive patients who underwent HRCT chest on-day 3-5 of admission. Among 110 patients 55 patients with comorbidities were taken as Group A. 55 patients without any known comorbidities were taken as Group B. The subjects were categorized into mild, moderate & severe based on the CT-severity score. Distribution, extent & type of abnormal lung findings were recorded.
The study showed, among 110 subjects, 4 Group A & 9 Group B RT-PCR covid positive did not show any lung abnormalities. Diseased lungs were seen among 51 Group A and 46 Group B. We observed higher percentage of extensive and multiple patches of GGO, s was in Group A than Group B. Whereas scattered GGO’S were predominant in control group than Group A. We observe that multiple patches of consolidation were high in number in Group A than Group B, whereas few patches of consolidation were predominant among Group B. Group A had showed more crazy paving, subpleural bands, vascular dilatation and bronchial thickening in comparison to Group B. Patients belonging to severe and moderate category were highest among Group A, whereas control group showed more number of mild category patients.
More prevalent comorbidity among case group were hypertension followed by diabetes mellitus, hypothyroidism, IHD, COPD, asthma, CLD. Patient with underlying comorbidities mainly hypertension, DM and IHD had high percentage of lung disease, and most were belonged to severe category. So, the study shows patient with underlying comorbidities had highest degree of involvement of lung.
The study also showed distribution of findings according to the CT-severity score, among both Group A and Group B patients’ highest percentage of extensive GGO’s were present in severe category, Moderate had more of multiple patches of GGO’s and mild category showed more of scattered GGO’s. Severe category showed more of multiple patches of consolidation, moderate category had more of few patches of consolidation. Other associated features like crazy paving, sub pleural bands, features which indicate fibrosis, bronchiectasis, pleural effusion, vascular changes, bronchial thickening were high in severe category patients.
A study conducted by comorbidity and its impact on 1590 patients with Covid-19 in China: A Nationwide Analysis showed that Among laboratory-confirmed Group A of Covid-19, patients with any comorbidity yielded poorer clinical outcomes than those without. A greater number of comorbidities also correlated with poorer clinical outcomes [18].
5. Conclusion
High CT severity was noted among patients with comorbidities. Extensive GGO’S multiple patches of consolidation & fibrotic changes like crazy- paving & subpleural bands, vascular dilatation, bronchiectasis was more among Group A than Group B. CT chest findings show that there is extensive involvement of lungs among patients with comorbidities in comparison to patients without comorbidities.
Conflicts of Interest
The authors declared there are no financial conflicts of interest.
References
- World Health Organization. Novel coronavirus (2019-nCoV) situation report-75 (2020).
- Pan Feng, Ye Tianhe, Sun Peng, et al. Time Course of Lung Changes at Chest CT during Recovery from Coronavirus Disease 2019 (COVID-19) Radiology. 295 (2020): 715–721.
- Xie X, Zhong Z, Zhao W, et al. Chest CT for typical 2019- n CoV pneumonia: relationship to negative RT-PCR testing. Radiology (2020): 200343.
- Fang Y, Zhang H, Xie J, et al. Sensitivity of chest CT for COVID-19: comparison to RT-PCR. Radiology (2020): 200432.
- Huang P, Liu T, Huang L, et al. Use of chest CT in combination with negative RT-PCR assay for the 2019 novel coronavirus but high clinical suspicion. Radiology 12 (2020): 200330.
- Chung M, Bernheim A, Mei X, et al. (2020) CT imaging features of 2019 novel coronavirus (2019-nCoV). Radiology (2020): 200230.
- Ai T, Yang Z, Hou H, et al. (2020) Correlation of chest CT and RT-PCR testing in coronavirus disease 2019 (COVID-19) in China: a report of 1014 Group A. Radiology (2020): 200642.
- Song F, Shi N, Shan F, et al. Emerging coronavirus 2019-nCoV pneumonia. Radiology 6 (2020):200274.
- Guan WJ, Ni ZY, Hu Y, et al. Clinical characteristics of coronavirus disease 2019 in China. N Engl J Med 382 (2020): 1708–1720.
- Jin X, Lian JS, Hu JH, et al. Epidemiological, clinical, and virological characteristics of 74 Group A of coronavirus-infected disease 2019 (COVID-19) with gastrointestinal symptoms. Gut 69 (2020): 1002–1009.
- Parry AH, Wani AH, Yaseen M. Neurological dysfunction in coronavirus Disease- 19 (COVID-19. Acad Radiol (2020).
- Kui L, Fang YY, Deng Y, et al. Clinical characteristics of novel coronavirus Group A in tertiary hospitals in Hubei Province. Chin Med J 133 (2020): 1025–1031.
- Coronavirus (COVID-19) events as they happen(n.d.). https://who.int/emergencies/diseases/novel-coronavirus-2019/events-as-they-happen (2020).
- A Badawi, SG Ryoo. Prevalence of comorbidities in the Middle East respiratory syndrome coronavirus (MERS-CoV): a systematic review and meta-analysis Int J Infect Dis 49 (2016): pp. 129-133.
- R Channappanavar, C Fett, M Mack, et al. Sex- based differences in susceptibility to severe acute respiratory syndrome coronavirus infection J Immunol 198 (2017): pp. 4046-4053
- S Jaillon, K Berthenet, C Garlanda. Sexual dimorphism in innate immunity Clin Rev Allergy Immunol 56 (2019): pp. 308-321
- M Dryden, M Baguneid, C Eckmann, et al. Pathophysiology and burden of infection in patients with diabetes mellitus and peripheral vascular disease: focus on skin and soft- tissue infections Clin Microbiol Infect 21 (2015): pp. S27-S32
- Wei-Jie Guan, Wen H Liang, Yi Zhao, et al. Comorbidity and its impact on 1590 patients with COVID-19 in China: a nationwide analysis. European Respiratory Journal 55 (2020): 2000547.
