Comparative Effects of α-Tocopherol and Ascorbic Acid Pre-Treatment on Paracetamol-Induced Liver Damage in Wistar Albino Rats
Article Information
Saidul Islam Khan1, Mahmuda Begum2, Rama Chowdhury3, Tahmina Yeasmin4, Mizanur Rahman5, Hasina Akter6
1Assistant Professor, Department of Physiology, International Medical College, Tongi, Gazipur, Bangladesh
2Professor and Head, Department of Physiology, Sir Salimullah Medical College, Dhaka, Bangladesh
3Professor, Department of Physiology, Sir Salimullah Medical College, Dhaka, Bangladesh
4Professor, Department of Physiology, Mugda Medical College, Dhaka, Bangladesh
5Associate Professor, Department of Physiology, Ad Din Akij Medical College, Khulna, Bangladesh
6Associate Professor, Department of Physiology, International Medical College, Tongi, Gazipur, Bangladesh
*Corresponding author: Saidul Islam Khan, Assistant Professor, Department of Physiology, International Medical College, Tongi, Gazipur, Bangladesh.
ORCHID ID: https://orcid.org/0000-0003-2393-9769
Received: 01 October 2023; Accepted: 10 October 2023; Published: 20 November 2023
Citation: Saidul Islam Khan, Mahmuda Begum, Rama Chowdhury, Tahmina Yeasmin, Mizanur Rahman, Hasina Akter. Comparative Effects of α-Tocopherol and Ascorbic Acid Pre-Treatment on Paracetamol-Induced Liver Damage in Wistar Albino Rats.Fortune Journal of Health Sciences. 6 (2023): 464-472.
Share at FacebookAbstract
Background: Paracetamol administration at toxic doses can lead to liver damage, characterized by elevated liver function markers and centrilobular hepatic necrosis. α-Tocopherol and ascorbic acid are known antioxidants that may have hepatoprotective effects against paracetamol-induced liver damage. However, there is limited comparative research on the effects of α-tocopherol and ascorbic acid pretreatment in Wistar albino rats.
Aim: This study aimed to compare the hepatoprotective effects of α-tocopherol and ascorbic acid pretreatment in Wistar albino rats with paracetamol-induced liver damage.
Methods: An animal model experimental study was conducted at the Department of Physiology, Sir Salimullah Medical College, Dhaka, Bangladesh. Forty apparently healthy male Wistar albino rats aged 90-120 days and weighing 160-200g were divided into four groups: Group I (baseline control, n=10), Group II (paracetamol-treated control, n=10), Group III (α-tocopherol pretreated & paracetamol treated, n=10), and Group IV (ascorbic acid pretreated & paracetamol treated, n=10). α-Tocopherol at a dose of 100 mg/kg body weight and ascorbic acid at 200 mg/kg body weight were administered orally as pre-exposure prophylaxis. Data were analyzed using MS Excel and SPSS version 22.0.
Results: Mean serum levels of total bilirubin, ALT, and AST were significantly elevated in Groups II, III, and IV compared to Group I. Moreover, the mean MDA concentration in liver tissue significantly increased in Groups II and IV compared to Group I, while Group III showed an increase that was not statistically significant. Notably, the mean serum levels of total bilirubin, ALT, AST, and MDA concentration in liver tissue significantly decreased in Groups III and IV compared to Group II, with the exception of serum AST levels in Group IV, which showed a non-significant decrease. Histological analysis revealed 100% normal liver findings in Group I, 100% abnormal findings in Group II, 30% abnormal findings in Group III, and 50% abnormal findings in Group IV.
Conclusion: Although α-tocopherol pretreatment in paracetamol-treated Wistar albino rats resulted in significantly lower levels of total bilirubin, ALT, AST, and MDA concentration in liver tissue compared to ascorbic acid pretreatment, a relatively lower proportion of abnormal histological findings was observed in the α-tocopherol pretreated group.
Keywords
α-Tocopherol, Ascorbic acid, Paracetamol, Liver damage, Wister albino rats
Article Details
1. Introduction
The liver, the largest gland in the human body, plays a pivotal role in executing a wide array of intricate biochemical and metabolic processes that are essential for sustaining life. These multifaceted functions encompass the synthesis and secretion of bile, metabolism of nutrients and vitamins, detoxification of various toxins, synthesis of critical plasma proteins, including clotting factors, and the pivotal task of neutralizing diverse drugs and endogenous compounds [1]. In clinical practice, severe acute liver diseases that culminate in acute or fulminant liver failure pose significant challenges [2]. Full-blown hepatic failure is most commonly triggered by drug or toxin-induced hepatic injuries or viral hepatitis [3]. Hepatotoxicity can also be instigated by chronic alcohol consumption, prolonged malnutrition, advanced age, genetic factors, and concomitant use of medications that induce hepatic cytochrome P450 (CYP), especially through idiosyncratic reactions. This presents a considerable conundrum for both the pharmaceutical industry and physicians alike [4,5]. Drug-induced liver injury is not an infrequent adverse event encountered in clinical settings, given the plethora of compounds available, including herbal remedies and alternative medications [6]. Among these substances, paracetamol (also known as acetaminophen or N-acetyl-p-aminophenol) stands as a common antipyretic and non-opioid analgesic drug, widely employed to alleviate fever and mild to moderate pain. It is readily accessible as an over-the-counter medication [7]. Despite its generally acknowledged safety and efficacy, overdose, idiosyncratic reactions, or synergistic effects with alcoholic liver disease, particularly in populations with preexisting liver conditions, can lead to fatal outcomes [8]. One key player in mitigating the adverse effects of oxidative stress is α-tocopherol, commonly referred to as vitamin E. Its primary function lies in countering the detrimental impact of free radicals by preventing the oxidation of polyunsaturated fatty acids within cell membranes. Furthermore, it aids in restoring a normal lipid profile and has the capacity to reduce oxidative modifications of LDL cholesterol, a consequence of paracetamol administration [9]. α-tocopherol, part of the vitamin E family, is a group of fat-soluble compounds that was first discovered in 1922 by Evans and Bishop. These compounds possess unique antioxidant properties crucial for maintaining health [11]. While various tocopherols and tocotrienols exist in nature, α-tocopherol stands out as the predominant form found in animal tissues, responsible for at least 90% of its biological activity [12]. Food sources rich in α-tocopherol include wheat germ oil, peanut oil, maize oil, sunflower oil, cottonseed oil, as well as green leafy vegetables, almonds, sunflower seeds, beets, meat, milk, butter, and eggs [13]. In developing countries, the risk of α-tocopherol deficiency is heightened due to limited vitamin intake and a higher prevalence of oxidative stressors. Insufficient storage of α-tocopherol in the human body can manifest as recurrent abortions, degenerative changes in the spinal cord, peripheral neuropathy, ataxia, muscle weakness, vision problems, and hemolytic anemia [14]. Additionally, ascorbic acid, or vitamin C, a water-soluble ketolactone, is an independent antioxidant crucial for protecting cells against oxidative stress-induced cell death [16]. Some studies suggest that the hepatoprotective activity of α-tocopherol and ascorbic acid occurs through the modulation of antioxidant pathways, which scavenge harmful free radicals, thus mitigating redox imbalances. The primary goal of this study was to compare the effects of α-tocopherol and ascorbic acid pre-treatment in mitigating paracetamol-induced liver injury in Wistar albino rats, owing to their potential antioxidant mechanisms of hepatoprotective action [17].
2. Methodology
This experimental investigation was carried out utilizing an animal model at the Department of Physiology, Sir Salimullah Medical College, Dhaka, Bangladesh. A total of 40 seemingly healthy male Wistar albino rats, aged 90 to 120 days, and weighing between 160 and 200g were selected and categorized into four groups: Group I (baseline control group, n=10), Group II (paracetamol-treated control group, n=10), Group III (α-tocopherol pretreated & paracetamol-treated group, n=10), and Group IV (ascorbic acid pretreated & paracetamol-treated group, n=10). The study received ethical approval from the relevant medical college's ethical committee. The entire experiment was conducted in accordance with the principles of animal research outlined by the Institutional Animal Care & Use Committee (IACUC) [18]. Inclusion criteria for this study encompassed rats that were seemingly healthy, male, Wistar albino, aged between 90 to 120 days, and with a weight falling within the range of 160 to 200g. Conversely, rats with preexisting illnesses were excluded from participation. The experimental protocol was as follows:Group I: Rats were administered a basal diet for a duration of 30 days and received propylene glycol (MERCK Chemicals, Germany at 2 ml/Kg body weight, orally) on days 28, 29, and 30.Group II: Rats were subjected to a basal diet for 30 days and were administered paracetamol (Amico laboratories Ltd, Bangladesh at 1500mg/kg body weight, orally) on days 28, 29, and 30.Group III: In addition to the basal diet, rats in this group received α-tocopherol (Drug International Ltd, Bangladesh) at a dosage of 100 mg/kg body weight orally for 30 days and paracetamol (1500mg/kg body weight, orally) on days 28, 29, and 30.Group IV: Rats were fed a basal diet and supplemented with ascorbic acid (Sigma-Aldrich, USA) at a dosage of 200 mg/kg body weight orally for 30 days. Additionally, they were administered paracetamol (1500mg/kg body weight, orally) on days 28, 29, and 30 except group I. Furthermore, a pilot study was conducted to ascertain the toxic dose of paracetamol required to induce liver damage in nine Wistar albino male rats, aged 120 to 150 days, with weights ranging from 200 to 240g. After an acclimatization period of 10 days, blood samples were collected from the tail vein. Subsequently, the rats were orally administered paracetamol solution at varying doses of 1, 1.5, or 2 g per kg of body weight once daily in the morning for three consecutive days. They were then sacrificed 24 hours after the last dose of paracetamol administration. Serum levels of alanine aminotransferase (ALT) were measured both before (as a control) and after paracetamol administration. Histological assessments of the liver were also conducted to determine the optimal toxic dose for inducing liver damage. Ultimately, a paracetamol dose of 1500 mg/kg body weight once daily for three consecutive days was selected for the induction of liver toxicity.
2.1 Study procedure
All animals underwent a 10-day acclimatization period before the initiation of interventions. This period was maintained at a room temperature of 28 ± 2°C, with a 12-hour light/12-hour dark cycle. During this acclimatization phase, the animals were provided with free access to standard food pellets and water. Following the acclimatization phase, the study period spanned 30 consecutive days. On day 1 of the study, the initial body weight of all rats was recorded, and this was repeated at the conclusion of the study to determine the final body weight. On day 31, all rats were sacrificed. At the beginning of the study (day 1), blood samples were collected from the tail vein of all rats to assess liver function. Serum levels of alanine aminotransferase (ALT) were measured, and only rats with normal ALT levels falling within the range of 10-40 U/L were included in the experiment. Hepatotoxicity was induced in all groups, except for Group I, by administering a single daily morning dose of paracetamol (1500 mg/kg body weight, orally) through intragastric gavage on days 28, 29, and 30, following an overnight fast. In the experimental groups, α-tocopherol (100 mg/kg body weight) and ascorbic acid (200 mg/kg body weight) were orally administered in the morning between 9:00 to 10:00 am for 30 consecutive days. After the rats were sacrificed, blood samples were collected from the heart, and the liver was removed and weighed for further analysis. Serum levels of total bilirubin, ALT, and AST were measured to assess liver function. The measurements of total bilirubin, ALT, and AST were conducted in the Department of Biochemistry at BSMMU using the Wroblewski and LaDue principle and Backman Culter AU 680 system. The assessment of Malondialdehyde (MDA) content in liver tissue homogenate was performed using standard laboratory kits in the Department of Biochemistry and Molecular Biology at Jahangirnagar University, Dhaka. Histopathological examination of liver tissue was carried out by preparing histological slides stained with hematoxylin-eosin. These slides were observed under a microscope, and photomicrographs were captured using standard laboratory procedures in the Department of Pathology at Sir Salimullah Medical College, Dhaka, Bangladesh. After a 24-hour interval following the last paracetamol administration, all rats were anesthetized with 30% chloroform and then sacrificed. Blood samples (5ml) were collected from the heart using disposable syringes, placed in separate labeled and dry test tubes, and allowed to clot in an upright position. Subsequently, the blood was centrifuged at 3000 rpm for 10 minutes, and the supernatant serum was collected in labeled Eppendorf tubes and preserved in the refrigerator for the estimation of all biochemical parameters.
2.2 Statistical analysis
The numerical data were expressed as the mean values. Statistical analysis was conducted using the one-way analysis of variance (ANOVA) test. Subsequently, a post hoc Bonferroni test was applied to make comparisons between different groups. For the histological analysis, Fisher's exact test was employed. Additionally, paired 't' tests were conducted where applicable. A significance level of P ≤ 0.05 was considered as the threshold for statistical significance. All statistical analyses were performed utilizing the Statistical Package for the Social Sciences (SPSS) version 22.0.
3. Results
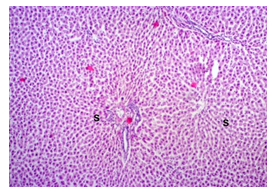
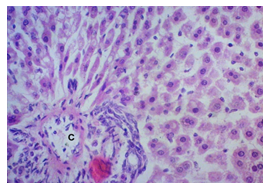
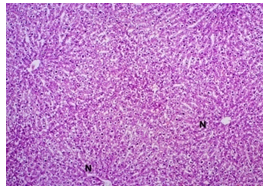
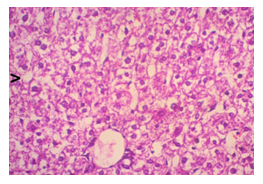
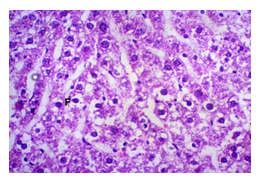
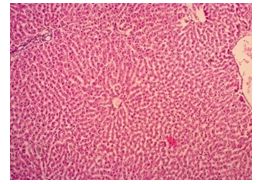
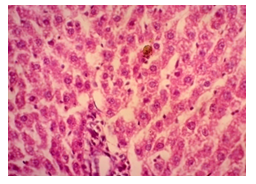
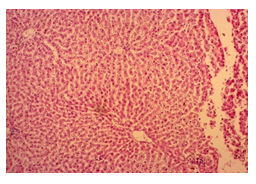
In this study, the initial body weights of the rats on day 1 were as follows: 181.60 ± 6.08 gm for Group I, 183.20 ± 7.04 gm for Group II, 180.90 ± 10.25 gm for Group III, and 187.20 ± 8.34 gm for Group IV. Conversely, the final body weights on day 31 were 222.90 ± 17.22 gm for Group I, 220.40 ± 16.02 gm for Group II, 228.10 ± 18.14 gm for Group III, and 232.50 ± 19.03 gm for Group IV. Initial body weights among the groups were comparable, showing no statistically significant differences. Similarly, no statistically significant differences were observed among the final body weights in the different groups. The mean percentage change in body weight from final to initial measurements was 22.62 ± 6.25% for Group I, 20.21 ± 5.34% for Group II, 25.99 ± 4.69% for Group III, and 24.04 ± 5.47% for Group IV. Furthermore, the final body weights of all rats were significantly higher than their initial body weights within each group. The mean liver weights of the rats were as follows: 3.88 ± 0.53 gm for Group I, 6.13 ± 1.28 gm for Group II, 4.66 ± 0.85 gm for Group III, and 5.20 ± 1.02 gm for Group IV. In this study, Group III showed an increase in liver weight compared to Group I, although this difference was not statistically significant. However, Group II had a significantly increased liver weight compared to Group I (P < 0.001). Additionally, liver weight significantly decreased in Group I (P < 0.001) and Group III (P ≤ 0.05) compared to Group II. Group IV also had a decreased liver weight compared to Group II, but this difference was not statistically significant. There were no statistically significant differences observed between Group III and Group IV. The mean serum total bilirubin levels were 0.68 ± 0.30 mg/dl for Group I, 2.41 ± 0.59 mg/dl for Group II, 1.46 ± 0.31 mg/dl for Group III, and 1.79 ± 0.21 mg/dl for Group IV. In this study, the serum total bilirubin levels were significantly increased in Group II (P < 0.001), Group III (P < 0.001), and Group IV (P < 0.001) compared to Group I. However, these levels significantly decreased in Group III (P < 0.001) and Group IV (P < 0.01) compared to Group II. No statistically significant differences were observed between Group III and Group IV. The mean serum ALT levels were 35.90 ± 9.10 U/L for Group I, 94.10 ± 16.93 U/L for Group II, 54.70 ± 12.56 U/L for Group III, and 70.30 ± 12.66 U/L for Group IV. In this study, the serum ALT levels were significantly increased in Group II (P < 0.001), Group III (P ≤ 0.05), and Group IV (P < 0.001) compared to Group I. While the serum ALT levels were higher in Group III and Group IV than in Group I, these differences were not statistically significant. However, these levels significantly decreased in Group III (P < 0.001) and Group IV (P < 0.01) compared to Group II. The mean serum AST levels were 58.10 ± 13.67 U/L for Group I, 138.30 ± 28.28 U/L for Group II, 97.60 ± 22.29 U/L for Group III, and 120.20 ± 28.22 U/L for Group IV. In this study, the serum AST levels were significantly increased in Group II (P < 0.001), Group III (P ≤ 0.05), and Group IV (P < 0.001) compared to Group I. Additionally, the serum AST levels were significantly decreased in Group III (P < 0.01) compared to Group II. No statistically significant differences were observed between Group II and Group IV or between Group III and Group IV. The mean MDA concentration in the liver of the rats was 3.93 ± 2.31 nmol/mg protein for Group I, 10.23 ± 1.53 nmol/mg protein for Group II, 5.23 ± 2.16 nmol/mg protein for Group III, and 7.31 ± 1.89 nmol/mg protein for Group IV. In this study, the MDA concentration in the liver significantly increased in Group II (P < 0.001) and Group IV (P < 0.01) compared to Group I. However, no statistically significant differences were significantly decreased in group III (P<0.001) and group IV (P≤0.05) than that of group II. In this study, histological examination of liver revealed normal findings in 100% of rats in group I, whereas abnormal histological findings were observed in100% of rats in group II. Again, 70% of rats in group III and 50% of rats in group IV showed normal histological findings. In this study, statistically significant differences in histological findings of rat liver were observed between group I vs II (P<0.001), I vs IV (P<0.001) and no statistically significant changes was observed in group I vs III. Again, statistically significant differences of histological findings were observed between group II vs III (P<0.01) and II vs IV(P<0.001). Moreover, no statistically significant changes were present between group III vs IV.
Table 1: Body weight and percent change of body weight in different groups of rats. (N=40)
|
Groups |
Body weight (gm) |
P- value |
Change (%) |
|
|
Initial (I) |
Final (F) |
|||
|
(Day-1) |
(Day-30) |
[(F-I)/Ix100] |
||
|
I (n=10) |
181.60 ± 6.08 |
222.90 ± 17.22 |
<0.001 |
22.62 ± 6.25 |
|
II (n=10) |
183.20 ± 7.04 |
220.40 ± 16.02 |
<0.001 |
20.21 ± 5.34 |
|
III (n=10) |
180.90 ± 10.25 |
228.10 ± 18.14 |
<0.001 |
25.99 ± 4.69 |
|
IV (n=10) |
187.20 ± 8.34 |
232.50 ± 19.03 |
<0.001 |
24.04 ± 5.47 |
|
Statistical analysis |
||||
|
Groups |
P-value |
|||
|
Initial (I) |
Final (F) |
Change (%) |
||
|
I vs II vs III vs IV |
0.436 |
0.596 |
0.194 |
|
|
I vs II |
1 |
1 |
1 |
|
|
I vs III |
1 |
1 |
1 |
|
|
I vs IV |
1 |
1 |
1 |
|
|
II vs III |
1 |
1 |
0.255 |
|
|
II vs IV |
1 |
1 |
1 |
|
|
III vs IV |
0.866 |
1 |
1 |
|
Table 2: Liver weight of rat in different groups. (N=40)
|
Groups |
Liver weight |
|
(gm) |
|
|
I (n=10) |
3.88 ± 0.53 |
|
(3.10 - 5.05) |
|
|
II (n=10) |
6.13 ± 1.28 |
|
(4.72 - 8.12) |
|
|
III (n=10) |
4.66 ± 0.85 |
|
(3.54-6.11) |
|
|
IV (n=10) |
5.20 ± 1.02 |
|
(4.21-7.12) |
|
|
Statistical analysis |
|
|
Groups |
P-value |
|
I vs II vs III vs IV |
<0.001 |
|
I vs II |
<0.001 |
|
I vs III |
0.674 |
|
I vs IV |
0.026 |
|
II vs III |
0.01 |
|
II vs IV |
0.319 |
|
III vs IV |
1 |
Table 3: Serum total bilirubin level in different groups of rats. (N=40)
|
Groups |
Serum total bilirubin |
|
(mg/dl) |
|
|
I (n=10) |
0.68 ± 0.30 |
|
(0.29-1.05) |
|
|
II(n=10) |
2.41 ± 0.59 |
|
(1.11-3.02) |
|
|
III(n=10) |
1.46 ± 0.31 |
|
(0.94-1.94) |
|
|
IV(n=10) |
1.79 ± 0.21 |
|
(1.52-2.10) |
|
|
Statistical analysis |
|
|
Groups |
P-value |
|
Serum total bilirubin |
|
|
I vs II vs III vs IV |
<0.001 |
|
I vs II |
<0.001 |
|
I vs III |
<0.001 |
|
I vs IV |
<0.001 |
|
II vs III |
<0.001 |
|
II vs IV |
0.004 |
|
III vs IV |
0.48 |
Table 4: Serum alanine aminotraferase (ALT) level in different groups of rats. (N=40)
|
Groups |
Serum ALT |
|
(U/L) |
|
|
I (n=10) |
35.90 ± 9.10 |
|
(26.00-58.00) |
|
|
II (n=10) |
94.10 ± 16.93 |
|
(72.00-129.00) |
|
|
III (n=10) |
54.70 ± 12.56 |
|
(41.00-72.00) |
|
|
IV (n=10) |
70.30 ± 12.66 |
|
(52.00-94.00) |
|
|
Statistical analysis |
|
|
Groups |
P-value |
|
I vs II vs III vs IV |
<0.001 |
|
I vs II |
<0.001 |
|
I vs III |
0.013 |
|
I vs IV |
<0.001 |
|
II vs III |
<0.001 |
|
II vs IV |
0.001 |
|
III vs IV |
0.066 |
Table 5: Serum aspartate aminotraferase (AST) level in differentgroups of rats. (N=40)
|
Groups |
Serum AST |
|
(U/L) |
|
|
I (n=10) |
58.10 ± 13.67 |
|
(42.0-90.0) |
|
|
II (n=10) |
138.30 ± 28.28 |
|
(100.0-190.0) |
|
|
III (n=10) |
97.60 ± 22.29 |
|
(72.0-140.0) |
|
|
IV (n=10) |
120.20 ± 28.22 |
|
(80.0-161.0) |
|
|
Statistical analysis |
|
|
Groups |
P-value |
|
I vs II vs III vs IV |
<0.001 |
|
I vs II |
<0.001 |
|
I vs III |
0.003 |
|
I vs IV |
<0.001 |
|
II vs III |
0.002 |
|
II vs IV |
0.823 |
|
III vs IV |
0.316 |
Table 6: Malondialdehyde (MDA) concentration in liver in different groups of rats. (N=40)
|
Groups |
MDA |
|
(nmol/mg protein) |
|
|
I (n=10) |
3.93 ± 2.31 |
|
(0.09-7.16) |
|
|
II (n=10) |
10.23±1.53 |
|
(8.08-12.39) |
|
|
III (n=10) |
5.23 ± 2.16 |
|
(3.43-10.27) |
|
|
IV (n=10) |
7.31 ± 1.89 |
|
(4.45-9.75) |
|
|
Statistical analysis |
|
|
Groups |
P-value |
|
MDA |
|
|
I vs II vs III vs IV |
<0.001 |
|
I vs II |
<0.001 |
|
I vs III |
1 |
|
I vs IV |
0.002 |
|
II vs III |
<0.001 |
|
II vs IV |
0.01 |
|
III vs IV |
0.158 |
Table 7: Distribution of rats by histological changes in liver. (N=40)
|
Groups |
Histological findings |
|
|
Normal |
Abnormal |
|
|
n(%) |
n(%) |
|
|
I (n=10) |
10(100.0) |
0(0) |
|
II (n=10) |
0(0) |
10(100.0) |
|
III (n=10) |
7(70) |
3(30) |
|
IV (n=10) |
5(50) |
5(50) |
4. Discussion
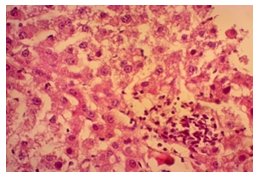
The primary objective of this study was to assess and compare the effects of α-tocopherol and ascorbic acid pre-treatment on liver damage induced by paracetamol in Wistar albino rats. Baseline control group animals exhibited values within the physiological range for the study parameters, including serum levels of total bilirubin, ALT, AST, and MDA concentration in the liver. Additionally, histological examination of their livers showed normal architecture, aligning with previous findings reported by researchers in different countries [16,19]. Throughout the study, it was observed that the final body weights of all rats significantly increased compared to their initial body weights in each respective group. This increase is consistent with findings from other studies on hepatotoxicity [20,21]. Liver weight was significantly higher in the paracetamol-treated control group and the ascorbic acid pretreated & paracetamol-treated group compared to the baseline control group. A similar trend was observed in the α-tocopherol pretreated & paracetamol-treated group, although the increase was not statistically significant [22]. The serum total bilirubin levels of rats were significantly elevated in both the α-tocopherol pretreated and paracetamol-treated group and the ascorbic acid pretreated and paracetamol-treated group, as well as in the paracetamol-treated control group when compared to the baseline control group. These results were consistent with findings reported by other researchers [23], although Bhavsar et al. found non-significant increases in bilirubin in rats treated with ethanol extract of Citrus limon [24]. Serum ALT levels were significantly higher in the paracetamol-treated control group, the α-tocopherol pretreated and paracetamol-treated group, and the ascorbic acid pretreated and paracetamol-treated group compared to the baseline control group. These findings align with those of previous investigators [25,26]. In this study, serum AST levels were significantly elevated in all experimental groups when compared to the baseline control group. This observation was in line with similar findings by other researchers [27,28]. The MDA concentration in liver tissue homogenate was significantly increased in the paracetamol-treated control group and the ascorbic acid pretreated and paracetamol-treated group compared to the baseline control group. However, the MDA concentration in the α-tocopherol pretreated and paracetamol-treated group was higher than that of the baseline control group but did not reach statistical significance. These findings were consistent with observations made by other researchers [29,30]. Histological examination revealed abnormal changes in liver tissue in 100% of rats in the paracetamol-treated control group. These changes included centrilobular necrosis, disorganization of hepatic sinusoids, infiltration of lymphocytes and Kupffer cells, fatty changes, and ballooning degeneration. Furthermore, elevated serum levels of total bilirubin, ALT, AST, and MDA concentration in liver tissue were observed in paracetamol-treated rats. Moderate histological changes in the liver were also evident upon microscopic examination. The toxic effects of paracetamol are attributed to its conversion into N-acetyl-p-benzoquinone imine (NAPQI), a highly reactive compound, in the liver. When NAPQI combines with glutathione, it typically becomes harmless. However, at higher paracetamol doses, the synthesis of cytochrome P-450 is increased, exposing hepatocytes around the portal triad to higher concentrations of toxic intermediates, leading to cell necrosis [31].Additionally, liver disease is a significant cause of elevated serum transaminase activity, with ALT activity generally higher than AST. Serum ALT and AST levels can increase before the onset of clinical symptoms in various liver diseases, particularly those associated with acute hepatic necrosis. Patients with severe liver cell damage and degeneration often exhibit significantly higher levels of mitochondrial AST activity in their serum [32].
Limitation of the Study
The study had certain limitations. The study did not investigate the levels of antioxidant enzymes like superoxide dismutase (SOD) and glutathione peroxidase (GPx). Serum enzyme levels of α-tocopherol and ascorbic acid were also not assessed. Furthermore, this was a single-center study with a relatively small sample size.
Conclusion & Recommendation
Based on the findings of this study, it can be inferred that both α-tocopherol and ascorbic acid individually have the potential to alleviate oxidative damage caused by paracetamol-induced liver injury in male Wistar albino rats. Furthermore, the administration of α-tocopherol demonstrates superior hepatoprotective effects compared to ascorbic acid in mitigating hepatic damage. To obtain more precise and comprehensive results, we recommend conducting almost similar studies in human in multiple locations with larger sample sizes.
References
- Barrett KE, Barman SM, Brooks HL, Yuan JJ, Transport and Metabolic Function of the Liver. Ganong’s review of Medical physiology, 26th ed, Tata McGraw Hill Companies Inc, India 497-506.
- Penman D, Ralston SH, Strachan MWJ, Hobson RP. Hepatology. In: William MJ, Gordon-Walker TT. Davidson's Principle and Practice of Medicine 24th ed.; Elsevier (2022): 862-918.
- Lidofsky S. Liver transplantation for fulminant hepatic failure. Gastroenterology clinics of North America 22 (1993):257-269.
- Pezzia C, Sanders C, Welch S, Bowling A, Lee WM, “Psychosocial and behavioral factors in acetaminophen-related acute liver failure and liver injury,Journal of Psychosomatic Research101 (2017):51–57.
- Garcia-Cortes M, Robles-Diaz M, Stephens C, et al. Drug induced liver injury: an update. Arch Toxicol 94 (2020):3381.
- Bunchorntavakul C, Reddy KR. Acetaminophen-related Hepatotoxicity. ‘Clin Liver Dis 17 (2013):587-607.
- Thornton C, Manson JC. Drugs for inflammation and joint disease. In: Bennett PN, Brown MR, Sharma P. Clinical pharmacology 11th ed 4 (2012):240-259.
- Mirochnitchenko O, Weisbrot-Lefkowitz M, Reuhl K, Chen L, Yang C, Inouye M. Acetaminophen toxicity opposite effects of two forms of glutathione peroxidase. Journal of Biological Chemistry 274 (1999):10349-10355.
- Bijlani RL. Functions of the liver and their laboratory assessment. In: Understanding Medical physiology, 3rd ; Jaypee brother’s medical publishers (P) ltd.: New Delhi (2004): 422-429.
- Al-Jowari SA. Protective Effect of Vitamin E on Acetaminophen- Induced Hyperlipidemia in Female Rabbits. Iraqi Journal of Science 52 (2011): 300-305.
- Niki E, Traber MG. A history of vitamin E. Annals of Nutrition and Metabolism 61 (2012):207-12.
- Marcus R, Coulston AM. Fat-soluble vitamins: Vitamins A, E and K. In: Hardman JG, Limibird LE, (eds). Goodman and Gulman’s the Pharmacological basis of Therapeutics, 11th ; McGraw Hill Co.: New York (1996): 1573-1590.
- Satayanarayana U, Chakrapani U. Chemical constituents of life. In: Biochemistry with Clinical Concepts & case Study, 4th ed (2013): 1-163.
- Tripathi, KD. Miscellaneous Drugs’, Essentials of Medical pharmacology. 7th ed 67 (2013): 911-913.
- Li Y, Darwish WS, Chen Z, Hui T, Wu Y, Hirotaka S, et al. Identification of lead-produced lipid hydroperoxides in human HepG2 cells and protection using rosmarinic and ascorbic acids with a reference to their regulatory roles on Nrf2-Keap1 antioxidant pathway. Biol. Interact314 (2019): 108847.
- Guaiquil VH, Vera JC, Golde DW. Mechanism of vitamin C inhibition of cell death induced by oxidative stress in glutathione-depleted HL-60 cells. J Biol Chem 276 (2001): 40955-40961.
- Ganesh E, Chowdhury A, Malarvani T, Ashok-vardhan N. Hepatoprotective effect of Vitamin–E & C in Albino rats. Int J Adv Lif Sci 3 (2012): 21-26.
- The Guide for The Care and Use of Laboratory Animals. Science, Medicine, and Animals, Committee to Update Science, Medicine, and Animals, National Research Council (2004): 28-38.
- Sabiu S, Sunmonub TO, Emmanuel O, Ajani A, Taofeek, O, Ajiboye B. Combined administration of silymarin and vitamin C stalls acetaminophen-mediated hepatic oxidative insults in Wistar rats. Revista Brasileira de Farmacognosia 25 (2015):29-34.
- Maheswari E, Rajalekshmi SG, Thakur S. Influence of Vitamin on Hepatotoxicity and Oxidative stress’, Internation Journal of Research in Pharmacy and Biosciences 2 (2015):30-38.
- Amiri H, Ghodrati N, Noyani A, Abbasi S, Ghafouri HB, Salehi BS. Evaluation of the protective effect of vitamin C on hepatic damage caused by formaldehyde in rats. Bioscience & Biotechnology Research Communications 1 (2017):213-217.
- Otuechere CA, Abarikwu SO, Rufai MA, Ohiozoje AE, Martins E, Farombi EO. Protective effects of vitamin C against propanil-induced hepatotoxicity in Wistar rats. Asian Pacific Journal of Tropical Disease 2 (2012): S212-S217.
- El-Ridi MR, Rahmy TR. Action of vitamin C against acetaminophen-induced hepatorenal toxicity in rats. Toxin Review 19 (2000):275-278.
- Bhavsar SK, Joshi P, Shah MB, Santani DD. Investigation into Hepatoprotective Activity of Citrus limon. Pharmaceutical Biology 45 (2007):303-311.
- Ezeala CC, Nweke IN, Unekwe PC, El-Safty IA, Nwaegerue E. Fresh garlic extract protects the liver against acetaminophen-induced toxicity. The Internet Journal of Pharmacology 7 (2009):12-16.
- Siahkoohi S, Anvari M, Tafti MA, Hosseini-sharifabad M. The effects of vitamin E on the liver integrity of mice fed with acrylamide diet. Iranian Journal of Pathology 9 (2014): 89-98.
- Adeneye AA, Olagunju JO. Protective Effect of Oral Ascorbic Acid (Vitamin C) Against AcetaminophenInduced Hepatic Injury in Rats’, African Journal of Biomedical Research 11 (2007):183-190.
- Ghassam BJ, Ghaffari H, Prakash HS, Kini KR. Antioxidant and hepatoprotective effects of Solanum xanthocarpum leaf extracts against CCl4- induced liver injury in rats. Pharmaceutical Biology 52 (2014):1060–1068.
- Al-Sayed E, Martiskainen O, Seif el-Din SH, Sabra AN, Hammam OA, El-Lakkany NM, et al. Hepatoprotective and antioxidant effect of Bauhinia hookeri extract against carbon tetrachloride-induced hepatotoxicity in mice and characterization of its bioactive compounds by HPLC-PDA-ESI-MS/MS. Biomed Res Int (2014): 245171.
- Mohamad NE, Yeap SK, Lim KL, Yusof HM, Beh BK, Tan SW, et al. Antioxidant effects of pineapple vinegar in reversing of paracetamol-induced liver damage in mice. Chin Med 10 (2015): 3.
- Davis ME, Reasor MJ. Principles of Toxicology. In: Craig C R, Stitzel R E. Mordern Pharmacology with Clinical Application, 6th (ed), Lippincott Williams & Wilkings (2004): 63-72.
- Dufour DR. Vitamin and Trace Elements. In: Burtis, CA, Ashood ER, Bur DE (eds), Tietz Textbook of Clinical Chemistry and Molecular Diagnostics, 6th (ed), Saunders, Elsevier, Philadelphia (2012): 1637-1694.

