Association between Biofilm Formation and Virulence Genes Expression and Antibiotic Resistance Pattern in Proteus mirabilis, Isolated from Patients of Dhaka Medical College Hospital
Article Information
Nafisa Jabin Mishu1*, Shamsuzzaman SM2, Khaleduzzaman HM3, Modina Ansary Nabonee4, Nigha zannat dola4, Azmeri haque4
1MBBS, M-Phil (Microbiology), Department of microbiology, Army Medical College Bogura, Bangladesh
2M-Phil, PhD Microbiology, Head, Department of microbiology, Dhaka Medical College, Bangladesh
3MBBS, FCPS (Medicine) Classified Medicine specialist Combined Military Hospital Bogura, Bangladesh
4M-Phil Microbiology, Department of microbiology, Dhaka Medical College, Bangladesh
*Corresponding author: Nafisa Jabin Mishu, MBBS, M-Phil (Microbiology), Department of microbiology, Army Medical College Bogura, Bangladesh
Received: 05 May 2022; Accepted: 13 May 2022; Published: 19 May 2022
Citation: Nafisa Jabin Mishu, Shamsuzzaman SM, Khaleduzzaman HM, Modina Ansary Nabonee, Nigha zannat dola, Azmeri haque. Association between Biofilm Formation and Virulence Genes Expression and Antibiotic Resistance Pattern in Proteus mirabilis, Isolated from Patients of Dhaka Medical College Hospital. Archives of Clinical and Biomedical Research 6 (2022): 418-434.
Share at FacebookAbstract
Multidrug resistance (MDR) and extensive drug resistance (XDR) Proteus mirabilis are great threat to public health. Along with the drug resistance the biofilm forming capacity of these bacteria further complicate the treatment of infections caused by it. Furthermore, emergence of multidrug resistant Proteus mirabilis is increasing day by day. This study analyzed the relationship between antibiotic resistance and biofilm formation among the isolated Proteus mirabilis. It was a cross-sectional study over a period of one year from July 2019 to June 2020 at Dhaka Medical College Hospital. In this study we found that biofilm producing Proteus mirabilis were more antibiotic resistant than non-biofilm producing Proteus mirabilis. The biofilm formation was significantly higher in extended spectrum beta lactamase (ESBL) producing strains than non- extended spectrum beta lactamase (ESBL) producing strains but no significant relationship was observed between biofilm formation with MDR and XDR Proteus mirabilis. Indeed multidrug-resistant isolates did not show a trend to being greater biofilm producers than non-multidrug resistant isolates.
Keywords
Proteus mirabilis; Antimicrobial resistance; Virulence gene; MDR; XDR; ESBL; Biofilm
Article Details
1. Background
Multidrug resistant (MDR) P. mirabilis is increasing day by day at an alarming rate. So it is making treatment difficulty. Biofilm producing P. mirabilis make it more difficult to treat. This study was done to investigate the association between biofilm formation and virulence gene expression and antibiotic resistance pattern in P. mirabilis isolates collected from patients of Dhaka medical College Hospital between July 2019 and June 2020.
2. Introduction
The proteus genus is ciliated, gram-negative rods, facultative anaerobe members of the Enterobacteriaceae family [1]. Among the human gut micro biota, Proteus species comprise <0.05% in a healthy subjects [2]. Proteus species ranks third as the cause of hospital-acquired infections [3]. The biofilms of P. mirabilis can cause serious complications in patients with long-term bladder catheterization [4]. It also causes opportunistic infections. Biofilm formation facilitates bacterial survival under many hostile conditions and contributes in the persistence of infection [5]. Among the Proteus strains, the formation of biofilms by P. mirabilis on catheter material has been well-documented [6] although the gene responsible for biofilm development remains to be identified. Gene products that are important for biofilm development are also important for pathogenesis. P. mirabilis is believed to be the most common cause of infection related kidney stones [7]. Biofilm producing P. mirabilis are the increasing source of catheter associated UTI in the hospital [8]. Biofilm protects these bacteria from the host defense system and from antibiotics; often leading to repeated UTI infection. Selecting the correct antibiotics for right treatment of bacterial infection is becoming increasingly complicated because most of the gram negative bacteria pathogens carry multiple resistance genes that make them responsible for global drug resistance problems.
3. Material and Methods
A cross sectional study was conducted from July 2019 to June 2020 among 570 samples of urine, wound swab, pus and blood of adult patients having clinically suspected infections admitting in Dhaka Medical College Hospital or were received in the microbiology department for culture and sensitivity after taking informed written consent irrespective of sex and antibiotic intake. Patients who did not give consent were excluded from this study.
4. Antimicrobial Susceptibility Test
Susceptibility to antimicrobial agents of all isolated organisms were determined by Kirby-Bauer modified disc diffusion technique using Mueller-Hinton plates and zones of inhibition were interpreted according to clinical and laboratory standards institute (CLSI) guidelines [9]. The criteria “United States Food and Drug Administration” was used for the interpretation of zone of inhibition of tigecycline. Antibiotic discs were obtained from commercial sources (Oxoid Ltd, UK). Following antimicrobial discs were used: amikacin (30μg), piperacillin-tazobactam (100/10μg), imipenem (10μg), ciprofloxacin (30μg), cefepime (30μg), ceftazidime (30μg), ceftriaxone (30μg), cefoxitin (30μg), amoxiclav (amoxicillin 20μg & clavulanic acid 10μg), Sulphamethoxazole/ Trimethoprim and aztreonam (10μg). Fosfomycin and tigecycline susceptibility were tested by agar dilution method of minimum inhibitory concentration (MIC).
5. Agar Dilution Method of MIC
MIC of tigecycline (Incepta Pharma Limited, Dhaka), and fosfomycin (Beximco Pharma Limited) were determined by agar dilution method [10].
6. Inoculums Preparation & Inference of MIC
As 0.5 McFarland turbidity standard contains 1×10⁸ cfu/ml [11]. 10 times dilution of test inoculums was done to achieve 1× 10⁷ cfu/ml. All the inoculated plates were incubated aerobically at 37ºC overnight. The lowest concentration of antibiotic impregnated Mueller-Hinton agar showing no visible growth on agar media was considered as MIC of the drug of that strain of bacteria. Escherichia coli ATCC 25922 were used as control organisms.
7. Method of Detection of Biofilm
7.1 Tissue culture plate method (TCP)
This quantitative test is considered as the gold standard method for biofilm detection. Organism isolated from fresh agar plates were inoculated in 10 ml of tripticase soya broth with 1% glucose. Broths were incubated at 37ºC for 24 hours. The cultures were diluted 1:100 with fresh medium. Individual wells of sterile 96 well flat bottom polystyrene tissue culture treated plates were filled with 200 µl of the diluted cultures. Negative control wells contained inoculated sterile broth. The plates were incubated at 37ºC for 24 hours. After incubation, contents of each well were washed 0.2ml of phosphate buffer saline (p H 7.2) (Appendix-XI) four times. Biofilm formed by microorganisms were adherent to the well were fixed with sodium acetate (2%) and stained with crystal violate (0.1% w/v). Excess stain was removed by deionized water and plates were kept for drying. Optical density (OD) of stained adherent biofilm was obtained by using micro ELISA auto reader at wavelength 570 mm. The experiment was performed in triplicate and repeated three times [12].
8. Calculation of OD Values
The average OD values were calculated for all tested strains and negative controls, since all tests were performed in triplicate and repeated three times. Second, the cut off value (ODc) was established. It was defined as three standards (SD) above the mean OD of the control: ODc=average OD of negative controls + (3 × SD of negative control). Final OD value of a tested strain was expressed as average OD value of the strain reduced by ODc value (OD= average OD of a strain-ODc). ODc value was calculated for each microliter plate separately. If a negative value is obtained, it should be present as zero, while any positive value indicates biofilm [13].
|
Average OD value |
Biofilm production |
|
OD≤ODC |
No biofilm producer |
|
ODc<OD≤2×ODc |
Weak biofilm producer |
|
2×ODc<OD≤4×ODc |
Moderate biofilm producer |
|
4×ODc<OD |
Strong biofilm producer |
Interpretation of biofilm production by TCP method.
8.1 Molecular method
Polymerase chain reaction (PCR) was done for the detection of multidrug resistance genes in Proteus mirabilis
8.2 Procedure of bacterial pellet formation
A loop full of bacterial colonies from Mueller Hinton Agar (MHA) media was inoculated into a micro centrifuge tube having sterile trypticase soya broth (TSB) and incubated overnight at 37ºC. Incubated tube was centrifuged at 4000g for 10 minutes. Supernatant was discarded and tubes containing bacterial pellets were kept at -20ºC for DNA extraction.
8.3 DNA extraction
Three hundred microliter of sterile distilled water was added to micro centrifuge tubes having pellets and vortexes until mixed well. Then the mixture was heated at 100°C for 10 minutes in a heat block. After heating, tubes were immediately placed on ice for 5 minutes and centrifuged at 14000 g for 6 minutes at 4ºC.
Finally, the supernatant was taken into another micro centrifuge tube. This extracted DNA was preserved at 4ºC for 7-10 days and -20ºC for a long time.
8.4 Mixing of mastermix with primer and DNA template
PCR was performed in a final reaction volume 25 µl in a PCR tube, containing 12.5 µl of master mix (mixture of dNTP, taq polymerase, MgCl2 and PCR buffer), 2 µl forward primer, 2 µl reverse primer (Promega Corporation, USA) , 2 µl of extracted DNA and 6.5 µl of nuclease free water. After a brief vortex, the tubes were centrifuged.
8.5 Amplification in thermal cycler (Gene Atlas, Master cycler gradient, Japan, Model 482)
PCR assays were performed in a DNA thermal cycler. After amplification products were processed for gel documentation or kept at -20ºC till tested.
8.6 Agarose gel electrophoresis and visualization
PCR products were detected by electrophoresis on 1.5% agarose gel. Gel was prepared with 1 X TBE buffer (Tris EDTA). For 1.5% agarose gel preparation, 0.18 gram agarose powder (LE, analytic grade, Promega, Madison, USA) was mixed with a 1.25 ml TBE buffer. A comb was placed in a gel tray, the gel was poured. After solidification, 1 µl of loading dye and 5 µl of amplicon was mixed on parafilm and was loaded in agarose well.
Similarly, 2 µl of 100bp DNA ladder was mixed with 1µl loading dye and was loaded. Gel electrophoresis was done in 230 voltages for 30 minutes. After electrophoresis, the gel was stained with ethidium bromide (20µl ethidium bromide in 200 ml distilled water). The gel was observed under UV transilluminator (Gel Doc, Major Science, Taiwan) for DNA bands. The DNA bands were identified according to their molecular size by comparing with the molecular weight marker (100bp DNA ladder) loaded in a separated lane.
|
Gene |
Primer Sequence (5' to 3') |
Product Size (bp) |
Reference |
|
ureC |
F-GTT ATT CGT GAT GGT ATG GG R-GTA AAG GTG GTT ACG CCA GA |
316 |
Stankowska et al., 2008 |
|
LuxS |
F-GTA TGT CTG CAC CTG CGG TA R-TTT GAG TTT GTC TTC TGG TAG TGC |
464 |
Shankar et al., 1999 |
|
mrpA |
F-TTC TTA CTG ATA AGA CAT TG R-ATT TCA GGA AAC AAA AGA TG |
565 |
Barbour et al., 2012 |
|
zapA |
F-ACC GCA GGA AAA CAT ATA GCC C R-GCG ACT ATC TTC CGC ATA ATC A |
540 |
Stankowska et al., 2008 |
|
hpmA |
F-TGG TAT CGA TGT TGG CGT TA R-GTG GTG CCC ACT TTC AGA TT |
717. |
Shi et al., 2016 |
|
flaA |
F-AGG ATA AAT GGC CAC ATT G R-CGG CAT TGT TAA TCG CTT TT |
417 |
Barbour et al., 2012 |
|
rsmA |
F-TAG CGA GTG TTG ACG AGT GG R-AGC GAG GTG AAG AAC GAG AA |
562 |
Shi et al., 2016 |
|
fliL |
F-CTC TGC TCG TGG TGG TGT CG R-GCG TCG TCA CCT GAT GTG TC |
770 |
Barbour et al., 2012 |
|
ucaA |
F-GTA AAG TTG TTG CGC AAA C R-TTG AGC CAC TGT GGA TAC A |
560 |
Sosa et al., 2006. |
|
pmfA |
F-CAA ATT AAT CTA GAA CCA CTC R-ATT ATA GAG GAT CCC TTG AAG GTA |
618 |
Zunino et al., 2003 |
|
atfA |
F-CAT AAT TTC TAG ACC TGC CCT AGC A R-CTG CTT GGA TCC GTA ATT TTT AAC G |
382 |
Zunino et al., 2000 |
|
Esp |
F-TTGCTAATGCTAGTCCACGACC R-GCGTCAACACTTGCATTGCCGAA |
955 |
Shankar et al., 1997 |
Primers used in this study.
9. Statistical Analysis
Data were analyzed by using SPSS 25 software.
10. Result
A total of 570 samples were included in the present study. Among them, 277 were urine, 248 were wound swab and pus and 45 were blood samples. From the 570 samples, 413 (72.45%) were culture positive which is shown in Table 1. Among those culture yielded growth 183 (73.79%) were found from wound swabs and pus, 200 (72.20%) from urine samples and 30 (66.66%) from blood samples.
|
Samples |
Number of samples |
Culture positive n (%) |
|
Urine |
277 |
200 (72.20) |
|
Wound swab and pus |
248 |
183 (73.79) |
|
Blood |
45 |
30 (66.67) |
|
Total |
570 (100) |
413 (72.45) |
N= total number of samples. n= total number of culture positive samples.
Table 1: Culture positive among various clinical samples (N=570).
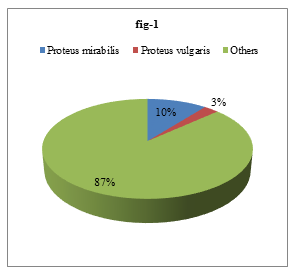
Isolated organisms were identified by different biochemical tests. Out of the 413 isolated bacteria, 44 (10.65%) were Proteus mirabilis and 11 (2.66%) were Proteus vulgaris (Figure 1).
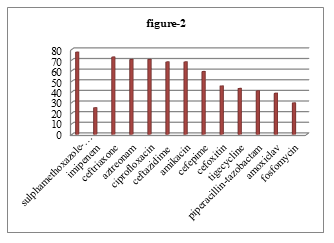
Among 183 cultures positive sample 11.48%, 10% and 10 % P. mirabilis found from wound swab or pus, urine and blood respectively. Among 44 isolated P. mirabilis, highest proportion of organism 77.27% showed resistance to sulphamethoxazole-trimethoprim and 25% showed lowest resistance to imipenem. But 32 (72.73%) were resistant to ceftriaxone, 31 (70.45%) were resistant to aztreonam and ciprofloxacin, 30 (68.18%) were resistant to ceftazidime and amikacin, 26 (59.10%) were resistant to cefepime, 20 (45.45%) were resistant to cefoxitin, 19 (43.18%) were resistant to tigecycline, 18 (40.91%) were resistant to piperacillin-tazobactam, 17 (38.64%) were resistant to amoxiclav, 13 (29.55%) were resistant to fosfomycin (Figure 2).
|
Antimicrobial drugs |
Biofilm producers (N=29) Showing resistance |
Non-biofilm producers (N=15) showing resistance |
Chi square /Fisher exact test |
p-value |
|
Cefoxitin |
13(44.83) |
7(46.67) |
0.28 |
0.87 |
|
Ceftazidime |
23(79.31) |
7(46.67) |
4.91 |
0.09 |
|
Ceftriaxone |
22(75.86) |
10(66.67) |
0.43 |
0.81 |
|
*Cefepime |
22(75.86) |
4(26.67) |
10.18 |
0.01 |
|
*Aztreonam |
25(86.21) |
6(40.00) |
12.45 |
0.002 |
|
Amoxiclav |
10(34.48) |
2(13.33) |
0.62 |
0.43 |
|
Imipenem |
9(31.03) |
2(13.33) |
1.65 |
0.20 |
|
PTZ |
14(48.28) |
4(26.67) |
2.85 |
0.24 |
|
*Ciprofloxacin |
25(86.21) |
6(40.00) |
10.17 |
0.01 |
|
Amikacin |
23(79.31) |
7(46.67) |
5.01 |
.082 |
|
Fosfomycin |
10(34.48) |
13(86.67) |
0.10 |
0.32 |
|
*Tigecycline |
17(58.62) |
2(13.33) |
9.02 |
0.01 |
|
SXT |
23(79.31) |
11(73.33) |
0.99 |
0.61 |
N=Total number of isolated P. mirabilis. n= Number of positive cases.
*denotes significant association found between antibiotic resistance and biofilm formation.
Table 2: Association between biofilm production and antibiotic resistance pattern in isolated Proteus mirabilis (N=44).
Amikacin shows minimum inhibitory concentration (MIC) in 128 µg/ml dilution whereas piperacillin-tazobactam showed the MIC in 64 µg/ml dilutions and imipenem showed the MIC in 08 µg/ml dilutions to resistant P. mirabilis in agar dilution method in vitro. P. mirabilis was susceptible to tigecycline not bellow 128 µg/ml dilutions whereas in case of fosfomycin P. mirabilis showed resistance in any concentration. Among 44 resistant P. mirabilis 29 (65.91%) were biofilm producers all of which could be detected by tissue culture plate method (TCP) but only 14 (31.82%) were detected by tube method (TM).
Among 29 biofilm producers, 25 (86.21%) were resistant to aztreonam and ciprofloxacin; 23 (79.31%) were resistant to ceftazidime, amikacin and sulphamethoxazole/trimethoprim; 22 (75.86%) were resistant to ceftriaxone and cefepime; 17 (58.62%) were resistant to tigecycline; 14 (48.28%) were resistant to piperacillin/tazobactam, 13 (44.83%) were resistant to cefoxitin; 10 (34.48%) were resistant to amoxiclav and fosfomycin whereas out of 15 non-biofilm producers 13 (86.67%) were resistant to fosfomycin and 11 (73.33)%) were resistant to sulphamethoxazole/trimethoprim (Table 2).
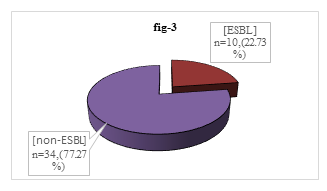
Among 44 isolated P. mirabilis, 34(77.27%) were non-ESBL producer though 10 (22.73%) were ESBL producer (Figure 3).
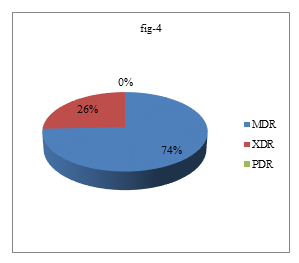
Most of the ESBL producing proteus mirabilis were found in wound and pus which were 70%. All ESBL producing P. mirabilis 10(100%) were biofilm producer but not all biofilm producing P. mirabilis were not ESBL producer which was statistically significant (p<0.05). Among 44 P. mirabilis, 29(65.91%) were MDR, 10(22.73%) were XDR and no PDR was detected (Figure 4)
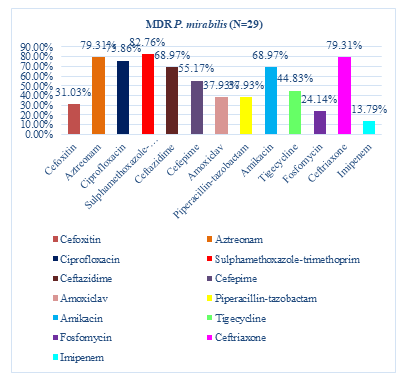
Among 29 MDR P. mirabilis, the highest resistance showed to sulfamethoxazole-trimethoprim that were 24(82.76%), followed by 23(79.31%) were resistant to aztreonam and ceftriaxone, 22(75.86%) were resistant to ciprofloxacin, 20(68.97%) were resistant to ceftazidime and amikacin, 16(55.17%) were resistant to cefepime, 13(44.83%) were resistant to tigecycline, 11(37.93%) were resistant to Piperacillin/tazobactam and amoxiclav, 9(31.03%) were resistant to cefoxitin and 7(24.14%) were resistant to fosfomycin. The lowest resistance showed to imipenem (13.79%) (Figure 5).
|
Type of biofilm formation |
MDR (N=29) n (%) |
XDR (N=10) n (%) |
Sensitive (N=5 ) n (%) |
|
Biofilm producer (N=29) |
22(75.86%) |
7(24.14%) |
0(0.00%) |
|
Biofilm non producer (N=15) |
7(24.14%) |
3(20.00%) |
5(33.33%) |
|
Total (N=44) |
29(65.91%) |
10(22.73%) |
5(11.36%) |
N=Total number of isolated P. mirabilis. n= Number of positive cases.
Table 3: The relationship between MDR, XDR and biofilm formation among the isolated P. mirabilis.
Among biofilm producers, 22(75.86%) were MDR, 7(24.14%) were XDR. Among the non-biofilm producer, 7(24.14%) were MDR and 3(20%) were XDR (Table 3). Among 29 biofilm producing bacteria, 25 (86.21%) had fliL gene; 23 (79.31%) had rsmA gene, zap A gene, hpmA gene; 20 (68.97%) had ureC gene, LuxS gene, UcaA gene; 16 (55.17%) had mrpA gene, flaA gene; 15 (51.72%) had esp gene, 14 (48.28%) had atfA gene and 10 (34.48%) had pmfA gene. Among 15 non biofilm producers, 12 (80.00%) had ureC gene, 10 (66.67%) had LuxS gene, 8 (53.33%) had mrpA gene and zapA gene; 9 (60.00%) had hpmA gene, pmfA gene; 6 (40.00%) had fliL gene; 5 (33.33%) had atfA gene, 4 (26.67%) had rsmA gene, 3 (20.00%) had UcaA gene, flaA gene, 2 (13.33%) had esp gene. Significant association found between rsmA, flaA, esp, fliL, UcaA and biofilm formation (p < 0.05) (Table 4).
|
Virulence Genes |
Biofilm producer (N=29) n% |
Biofilm non-producer (N=15) n% |
Total (N=44) n% |
Chi-square value/ Fisher exact test |
p-value |
|
ureC |
20 (68.97) |
12 (80.00) |
32 (72.73) |
0.61 |
0.44 |
|
LuxS |
20 (68.97) |
10 (66.67) |
30 (68.18) |
0.02 |
0.88 |
|
mrpA |
16 (55.17) |
8 (53.33) |
24 (54.55) |
0.01 |
0.91 |
|
*rsmA |
23 (79.31) |
4 (26.67) |
27 (61.36) |
11.56 |
0.001* |
|
zapA |
23 (79.31) |
8 (53.33) 8 (53.33) |
31 (70.45) |
3.21 |
0.07 |
|
*flaA |
16 (55.17) |
3 (20.00) |
19 (43.18) |
4..99 |
0.03* |
|
hpmA |
23 (79.31) |
9 (60.00) |
32 (72.73) |
1.86 |
0.17 |
|
*esp |
15 (51.72) |
2 (13.33) |
17 (38.64) |
6.15 |
0.01* |
|
*fliL |
25 (86.21) |
6 (40.00) |
31 (70.45) |
10.14 |
0.004* |
|
atfA |
14 (48.28) |
5 (33.33) |
19 (43.18) |
1.10 |
0.29 |
|
pmfA |
10 (34.48) |
9 (60.00) |
19 (43.18) |
2.34 |
0.13 |
|
*UcaA |
20 (68.97) |
3 (20.00) |
23 (52.27) |
9.50 |
0.002* |
* denotes significant association found between virulence genes and biofilm formation.
N=Total number of isolated P. mirabilis. n= Total number of virulence genes.
Table 4: Association between biofilm formation and expression of virulence genes in isolated P. mirabilis (N=44).
Among 10 ESBL producing bacteria, 9 (90.00%) had rsmA gene, hpmA gene, fliL gene, 8 (80.00%) had LuxS gene, 7 (70.00%) had ureC gene, esp gene, UcaA gene, 6 (60.00%) had mrpA gene, zapA gene, 5 (50.00%) had flaA gene, 4 (40.00%) had atfA gene, pmfA gene. Among 34 non-ESBL producer producers, 32 (94.12%) had hpmA gene, fliL gene, 25 (73.53%) had ureC gene, zapA gene, 22 (64.71%) had LuxS gene, 18 (52.94%) had rsmA gene, mrpA gene, 16 (47.06%) had ucaA gene, 15 (44.12%) had pmfA gene, atfA gene, 14 (14.18%) had flaA gene, 10 (29.41%) had esp gene. Significant association found between rsmA, esp gene with ESBL producer P. mirabilis isolates (p < 0.05) (Table 5).
|
Virulence Genes |
ESBL producer (N=10) n% |
Non-ESBL producer (N=34) n% |
p- value |
|
ureC |
7 (70.00) |
25 (73.53) |
0.83 |
|
LuxS |
8 (80.00) |
22 (64.71) |
0.36 |
|
mrpA |
6 (60.00) |
18 (52.94) |
0.69 |
|
*rsmA |
9 (90.00) |
18 (52.94) |
0.03 |
|
zapA |
6 (60.00) |
25 (73.53) |
0.41 |
|
flaA |
5 (50.00) |
14 (14.18) |
0.62 |
|
hpmA |
9 (90.00) |
32 (94.12) |
0.16 |
|
*esp |
7 (70.00) |
10 (29.41) |
0.02 |
|
fliL |
9 (90.00) |
32 (94.12) |
0.12 |
|
atfA |
4 (40.00) |
15 (44.12) |
0.76 |
|
pmfA |
4 (40.00) |
15 (44.12) |
0.76 |
|
ucaA |
7 (70.00) |
16 (47.06) |
0.20 |
N=Total number of isolated P. mirabilis.
Table 5: Proportion of virulence genes among ESBL producer and non- ESBL producer P. mirabilis isolates.
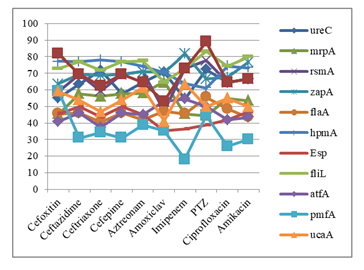
In case of cefoxitin and piperacillin-tazobactam (PTZ) resistant P. mirabilis the showed highest expression of LuxS gene. Ceftazidime, cefepime and ciprofloxacin resistant P. mirabilis showed highest expression of hpmA and fliL gene. In case of ceftriaxone and aztreonam resistant P. mirabilis showed highest expression of fliL and ureC gene. Fosfomycin resistant P. mirabilis showed highest expression of LuxS and zapA gene. In case of tigecycline resistant P. mirabilis showed highest expression of zapA and hpmA gene. Sulphamethoxazole-trimethoprim (SXT) resistant P. mirabilis showed highest expression of hpmA gene. In case of imipenem resistant P. mirabilis showed highest expression of zapA gene. All the antibiotic resistant P. mirabilis showed lowest expression of pmfA gene except PTZ which showed lowest expression of esp gene (Figure 6).
N=Total number of resistant P. mirabilis
n= Total number of virulence gene in resistant P. mirabilis.
11. Discussion
mirabilis causes various infections in urinary tract, burns and wounds. They show resistance to various antimicrobial. The pathogenesis of this species depends on its ability to manifest virulence factors, such as biofilms, adhesion molecules, urease, proteases, siderophores and toxins [14].
In this study, 72.45% samples yielded culture positive results which were similar to the in DMCH by [15] reported 70% samples as culture positive. Among them 11.48% P. mirabilis were isolated from wound swab and pus followed by 10% from urine and blood which is similar to the study by [15] at DMCH and it was 10.65% whereas 13.3% from wound samples in the study by [16] in Pakistan. Here we found 65.91% biofilm producing P. mirabilis were detected by TCP method which is similar to [17] where reported 52.32%. We found P. mirabilis exhibited 77.27% resistance against sulfamethoxazole-trimethoprim which is close (74.1%) to the study [18] in Nigeria.
Among the isolated P. mirabilis 72.73% P. mirabilis were resistant to ceftriaxone, followed by ceftriaxone 70.45% were resistant to aztreonam and ciprofloxacin, 68.18% were resistant to ceftazidime and amikacin. In a study by [15] in DMCH, resistance to ceftriaxone, aztreonam and ciprofloxacin were 71.88%, 68.75% and 75% respectively. Here 59.10% P. mirabilis were resistant to cefepime and 45.45% P. mirabilis were resistant to cefoxitin. Similar observations were found 60% in study done by [19] and 54.9% by [20] in Iraq respectively.
In this study 43.18% P. mirabilis were resistant to tigecycline, 40.91% were resistant to piperacillin-tazobactam, and 25% were resistant to imipenem. Study by [15] in DMCH observed resistant to tigecycline, piperacillin-tazobactam and imipenem were 43.75%, 34.38% and 25% respectively which is similar to the present study. In this study, 29.55% P. mirabilis were resistant to fosfomycin which is approximately similar to the observation of [15] in DMCH and the result was 24.32%.
Here it has been observed that P. mirabilis is resistant to several antibiotics including aztreonam, cefepime, ciprofloxacin and tigecycline which were significantly higher (p<0.05) among biofilm producers than non-biofilm producers. In this study, 86.21% biofilm producers were resistant to aztreonam whereas 40% non-biofilm producers were resistant to aztreonam. In case of cefepime, 75.86% resistant P. mirabilis were biofilm producers and 26.67% were non biofilm producers. Among the biofilm producers, 86.21% were resistant to ciprofloxacin whereas only 40% non-biofilm producers were resistant to ciprofloxacin. Among tigecycline resistant P. mirabilis, 58.62% were biofilm producers and 13.33% non-biofilm producers. These results showed that there is significant association with biofilm formation and resistance pattern of these antibiotics (p<0.05). Study by [21] in China found significant association between biofilm formation and antibiotic resistance. Other antibiotics showed no significant association between biofilm formation with drug resistance in this study (p>0.05). It might be due to the fact that different resistance mechanisms are likely to be responsible for the differences in antibiotic resistance and biofilm formation in various bacteria.
In this study, among the virulence genes rsmA, flaA, fliL, esp and ucaA, genes were found significantly higher in biofilm producers than non-biofilm producer P. mirabilis. In the present study, 79.31% biofilm producers had rsmA gene which is responsible for swarming behavior and it was significantly higher (p<0.05) than non-biofilm producers rsmA positive isolates. So, there might be an association between rsmA and biofilm formation of P. mirabilis. This result coincides with the data reported by [21] where 80.64% were rsmA positive in biofilm producing P. mirabilis. In this study, 55.17% biofilm producer P. mirabilis had flaA gene which encodes flagellar protein and it was significantly higher (p<0.05) than flaA positive non-biofilm producer isolates. Study by [22] reported 86.66% flaA gene positive P. mirabilis which is higher than this study.
In the current study, esp gene were positive in 51.72% among biofilm producing isolates and it was significantly higher (p<0.05) than esp positive non-biofilm producers. So, there might be an association between esp and biofilm formation of P. mirabilis which was also consistent with several previous studies that had suggested a link between esp gene and ability of a given strain to produce biofilm [23].
Here we found that among the 29 biofilm producing P. mirabilis, 86.21% had fliL gene and it was significantly higher (p<0.05) than fliL positive non-biofilm producer isolates. Study by [21] reported that 64.1% fliL positive P. mirabilis are biofilm producers.
In this study, 68.97% biofilm producer P. mirabilis had ucaA gene and it was significantly higher (p<0.05) than non-biofilm producers ucaA positive isolates. Study by [21] reported 22.58% ucaA positive in biofilm producer which is lower than this study.
In the current study, ureC and atfA gene were positive in 68.97% and 48.28% in biofilm producing P. mirabilis isolates respectively. There was no significant correlation between the presence of ureC and atfA gene and biofilm formation [21] reported 93.54% and 64.52% biofilm producing P. mirabilis had ureC and atfA genes respectively and found significant correlation (p<0.05) with biofilm formation which is higher than this study. In the current study, the prevalence of zapA genes among biofilm producers were 79.31% which was not statistically significant (p>0.05) [21] from China reported that 83.87% biofilm producing isolates had zapA genes which was statistically significant (p=0.037). This difference may be due to the geographical distributions or different strains in same species.
In the present study, LuxS gene and mrpA genes were present in 68.97% and 55.17% biofilm producing P. mirabilis isolates respectively. There was no significant correlation (p>0.05) between the presence of LuxS gene and mrpA gene and biofilm formation.
Here we found that hpmA gene among the biofilm producing isolates was 79.31% which was not significantly higher (p>0.05) than hpmA gene present in biofilm non-producing isolates [21] reported that 77.42% biofilm producing isolates had hpmA gene which is close to the present study. In the present study, pmfA gene among the biofilm producing isolates were 34.48% which was not significantly higher (p>0.05) than hpmA gene present in biofilm non-producing isolates. Study by [21] reported that 61.29% biofilm producing isolates had pmfA gene which was higher than the present study. These variations in the results due to difference in sample sizes and numbers of isolates [24].
In the present study, relationship between resistance pattern of antibiotics and virulence genes were observed. In case of cefoxitin and piperacillin-tazobactam resistant P. mirabilis showed highest expression of LuxS gene. Ceftazidime, cefepime and ciprofloxacin resistant P. mirabilis showed highest expression of hpmA and fliL genes. In case of ceftriaxone and aztreonam resistant P. mirabilis showed highest expression of fliL and ureC genes. Fosfomycin resistant P. mirabilis showed highest expression of LuxS and zapA genes. In case of tigecycline resistant P. mirabilis s highest expression of zapA and hpmA genes were observed. Sulphamethoxazole-trimethoprim resistant P. mirabilis showed highest expression of hpmA gene. In case of imipenem resistant P. mirabilis highest expression of zapA gene was seen. All the antibiotic resistant P. mirabilis lowest expression of pmfA gene except PTZ which showed lowest expression of esp gene. From this result it can’t be concluded any relationships between antibiotic resistance and virulence genes.
It was found that 22.73% P. mirabilis were detected as ESBL producers by DDS test. Study by [15] in DMCH detected 18.92% ESBL producing P. mirabilis which is approximately similar with the present findings [25] from India showed that 40% P. mirabilis were ESBL producers. In this study, all the biofilm producing P. mirabilis were ESBL producers. The ability of biofilm formation was significantly higher in ESBL producing strains than ESBL non-producing strains (p<0.05). It has been postulated that during occurrence of the large numbers of the chromosomal gene rearrangements upon acquisition of the ESBL plasmids the bacteria express several virulence genes [26]. In this study, rsmA gene (p=0.03) and esp gene (p=0.02) were significantly higher in ESBL producing P. mirabilis than non ESBL producing P. mirabilis.
Here 29.55% P. mirabilis were resistant to fosfomycin. Clinical use of fosfomycin in Bangladesh is rare and there are very few data regarding fosfomycin resistance. Study by (15) in DMCH showed 100% sensitivity of fosfomycin to P. mirabilis. The reason behind such finding in present study might be due to horizontal transfer of resistance genes between different species. Plasmids containing ESBL and fos genes may facilitate the dissemination of antibiotic resistance [27].
12. Conclusion
In this study, among the virulence genes flaA, esp, rsmA, fliL and ucaA gene were more prevalent in biofilm producing isolates than non-biofilm producing isolates. Presence of rsmA and esp gene might be responsible for more ESBL producer in P. mirabilis. Biofilm producing P. mirabilis showed more resistance to all tested antibiotics than non-biofilm producers but all were not statistically significant.
References
- Classification, Identification, and Clinical Significance of Proteus, Providencia, and Morganella. caroline Mohr Ohara' Frances W Brenner, J Michael Miller. Clinical microbiology review (2000): 534-546.
- Human gut microbiome viewed across age and geography. Yatsunenko T, Rey FE, Manary MJ, Trehan I, Dominguez-Bello MG, Contreras M, et al. Nature (2012): 222-227.
- Antibiogram Study of Proteus spp. Bacterial Isolates from Uropathogenic Infections in University of Benin Teaching Hospital, Nigeria. Philips, Orhue O. Science Alert (2014): 2-21.
- An in-situ infection detection sensor coating for urinary catheters. scarlet milo, Naing Tun Thet,et al. Biosensor and Bioelectronics (2016): 166-172.
- Evolving concepts in biofilm infections. Stoodley, launne Hall. Cellular microbiology (2009): 1034-1043.
- Molecular Epidemiology of Proteus mirabilis Infections of the Catheterized Urinary Tract. N A Sabbuba, E Mahenthiralingam, D J Stickler. Journal of clinical Microbiology (2003): 4961-4965.
- Genetic analysis of Escherichia coli biofilm formation: roles of flagella, motility, chemotaxis and type I pili. leslie A.Pratt, Roberto Kolter. Molecular microbiology (2002): 285-293.
- Economic analysis of alternative nutritional management of dual-purpose cow herds in central coastal Veracruz, Mexico. Absalón-Medina, Victor Antonio, et al. Tropical animal health and production (2012): 1143-1150.
- Clinical and Laboratory Standards Institute (CLSI) Performance standards for antimicrobial susceptibility testing. Wayne PA. Twenty Second Inf Suppl (2012): 1-278.
- Determination of minimum inhibitory concentrations. Andrews JM. Journal of antimicrobial Chemotherapy (2001): 5-16.
- Cheesbrough M. Anti microbial susceptibility testing, District library practice in tropical countries. cambridge : cambridge university press (2009).
- Adherence of coagulase-negative staphylococci to plastic tissue culture plates: a quantitative model for the adherence of staphylococci to medical devices. Christensen, Gordon D, et al. Journal of clinical microbiology (1985): 996-1006.
- Quantification of biofilm in microtiter plates: overview of testing conditions and practical recommendations for assessment of biofilm production by staphylococci. Stepanovi?, Srdjan, et al. Apmis (2007): 891-899.
- Virulence, resistance and clonality of Proteus mirabilis isolated from patients with community-acquired urinary tract infection (CA-UTI) in Brazil. de Oliveira, Wellington Danilo, et al. Microbial Pathogenesis (2021): 104642.
- Quick Identification and Differentiation of Proteus spp. by PCR and RFLP Along with Their Antibiotic Resistance Pattern. H Jannat, Samsuzzaman SM. Mymensing medical journal (2021): 355-361.
- Characterization of Proteus mirabilis Isolated from Patient Wounds at Bolan Medical Complex Hospital, Quetta. Zafar, Umbreen, et al. Jundishapur Journal of Microbiology (2019): 1-6.
- Preparation and evaluation of liquid fertilizer from Turbinaria ornata and Ulva reticulata. Karthik T, et al. Biocatalysis and Agricultural Biotechnology (2020): 101712.
- Molecular screening of antibiotic-resistant determinants among multidrug-resistant clinical isolates of Proteus mirabilis from SouthWest Nigeria. Alabi, Olumuyiwa Samuel, et al. African health sciences (2017): 356-365.
- Biofilm formation, antibiotic resistance and detection of mannose-resistant Proteus-like (MR/P) fimbriae genes in Proteus mirabilis isolated from UTI. Ghaima, Kais Kassim, Hiba Hazim Hamid, and Hasan SF. International Journal of ChemTech Research (2017): 964-971.
- Proteus species: Characterization and herbal antibacterial: A review. Mohammed, Ghaidaa Jihadi, Mohanad Jawad Kadhim, and Imad Hadi Hameed. International Journal of Pharmacognosy and Phytochemical Research (2016): 1844-1854.
- Association among biofilm formation, virulence gene expression, and antibiotic resistance in Proteus mirabilis isolates from diarrhetic animals in Northeast China. Sun, Yadong, et al. BMC Veterinary Research (2020): 1-10.
- Correlation between virulence factor and biofilm formation in Proteus spp. Qaddoorri, Sarah S., et al. Iraqi Journal of Science (2015): 1675-1681.
- Molecular study of biofilm and some antibiotic resistance gene in Proteus mirabilis isolated from children with UTI patients in Al-najaf Governorate. Sayal, Raad Ajam, et al. 2018, Journal of Pharmaceutical Sciences and Research (2018): 1986-1990.
- The isolation and characterization of Proteus mirabilis from different clinical samples. Al-Bassam, Wasan W, Abdul-Kareem Al-Kazaz. Journal of Biotechnology Research Center (2013): 24-30.
- Indigenous probiotic Lactobacillus isolates presenting antibiotic like activity against human pathogenic bacteria. Halder, Debashis, et al. Biomedicines (2017): 31.
- Antimicrobial activity and preliminary phytochemical screening of Justicia gendarussa (Burm. f.) against human pathogens. Subramanian N, Jothimanivannan C, Moorthy K. Asian Journal of Pharmaceutical and Clinical Research (2012): 229-233.
- Chromosomal location of the fosA3 and blaCTX-M genes in Proteus mirabilis and clonal spread of Escherichia coli ST117 carrying fosA3-positive IncHI2/ST3 or F2: A-: B-plasmids in a chicken farm. He, Dandan, et al. International journal of antimicrobial (2017): 443-448.
ata. Karthik T, et al. Biocatalysis and Agricultural Biotechnology (2020): 101712.

