Angiographic Findings in Unstable Angina and Prediction of 1-Year Risk of Recurrent Acute Coronary Syndrome or Death: A Nationwide Machine Learning Study
Article Information
Truls Råmunddal1, 2 , Araz Rawshani1,2, 3, Björn Redfors1,2, Petur Petursson2, Oskar Angerås2, Geir Hirlekar2, Dan Ioanes2, Jacob Odenstedt2, Christian Dworeck2, Sebastian Völz2, Anna Myredal2*
1Department of Molecular and Clinical Medicine, University of Gothenburg, Institute of Medicine, Sweden
2Department of Cardiology, Sahlgrenska University Hospital, Gothenburg, Sweden
3The Swedish Cardiopulmonary Resuscitation Registry, Centre of Registries, Västra Götaland, Gothenburg, Sweden
*Corresponding author: Anna Myredal, Department of Cardiology, Sahlgrenska University Hospital, Gothenburg, Sweden.
Received: 16 May 2023; Accepted: 23 May 2023; Published: 22 June 2023
Citation:
Truls Råmunddal, Araz Rawshani, Björn Redfors, Petur Petursson, Oskar Angerås, Geir Hirlekar, Dan Ioanes, Jacob Odenstedt, Christian Dworeck, Sebastian Völz, Anna Myredal. Angiographic Findings in Unstable Angina and Prediction of 1-Year Risk of Recurrent Acute Coronary Syndrome or Death: A Nationwide Machine Learning Study. Cardiology and Cardiovascular Medicine. 7 (2023): 198-210.
Share at FacebookAbstract
Background: We studied whether machine learning could predict survival, risk of future acute coronary syndrome (ACS) and coronary angiographic (CAG) findings in patients with unstable angina (UA). We also studied whether high-sensitivity troponin levels within normal range can predict the presence of obstructive coronary lesions, risk of future ACS and death.
Methods: We used the SWEDEHEART registry to include patients admitted to the coronary care unit due to chest pain, with normal highsensitivity cardiac troponin T or I (hs-cTnI, hs-cTnT), who underwent CAG and did not receive a final diagnosis of acute myocardial infarction (AMI). We studied CAG findings on segmental level, developed machine learning models predicting the risk of ACS or death within 1-year, and angiographic findings. The latter model predicted CAG resulting in interventions (any) or eliciting further assessments after CAG. Models for ACS and death included 130 candidate predictors and models for angiographic findings included 110 predictors.
Results: We included 9’314 patients; 1-year rate of death was 0.9% (n=78) and ACS was 2.7% (n=251). A total of 5455 (61.5%) of CAG resulted in no intervention and no further assessment afterwards, with 40% without significant stenosis. There was a strong association between hscTnI (within normal range) and severity of coronary atherosclerosis; e.g 32.4% in patients with hs-cTnI 26-35 ng/L had >50% stenosis in segment 6, as compared with 12.6% in those with hs-cTnI 0-5 ng/L. All segments displayed similar associations with troponin levels. Among 17 predictors for atherosclerosis, hs-cTnI was the strongest predictor of having >50% stenosis in the left anterior descending artery (LAD). Mortality increased at hs-cTnI levels above 10 ng/L for men, but not women. Age and sex adjusted hazard ratio for hs-cTnI 25-35 vs hs-TnI 0-5 was 5.73 (2.14- 15.35) for 1-year mortality. No association was noted for hs-cTnT. The strongest predictors of 1-year mortality were C-reactive protein, body mass index, estimated glomerular filtration rate.
Conclusion: Troponin levels within normal range exhibit a strong association with obstructive CAD and survival.
Keywords
Machine learning; ACS
Article Details
1. Introduction
Non-ST-segment elevation acute coronary syndromes (NSTE-ACS) present several clinical challenges, including strategies for preventing myocardial injury, predicting short- and long-term risk of adverse outcomes. Unstable angina (UA), first described 85 years ago, [1,2] is currently defined as symptomatic ischemia at rest or minimal exertion in the absence of evidence of myocardial necrosis [3]. UA exists along the continuum between stable angina and acute myocardial infarction (MI) [4] and the introduction of increasingly sensitive and specific biomarkers of myocardial necrosis have consistently redefined this entity, shifting a large proportion of patients from UA to non-ST-segment elevation myocardial infarction (NSTEMI). The recent transition to high-sensitivity troponin assays has resulted in a 20% increase in the diagnosis NSTEMI, with a reciprocal decrease in UA. The remarkable advances in the detection of myocyte necrosis have resulted in a 50% reduction in the fraction of patients with UA in the past few decades [1,3,5]. At the same time, early CAG in NSTE-ACS has increased from 9% in 1995 to 60% in 2015, with similar increases in the rate of PCI [6]. A substantial proportion of patients with UA lack objective signs of ischemia, or present with ambiguous symptoms. Risk-stratification of these patients remains a difficult clinical challenge. We studied patients with UA to elucidate whether hs-troponin levels within the upper limit of the normal range can predict the presence of obstructive coronary lesions, as well as quantifying the relative importance of over 100 predictors of angiographic findings, recurrent ACS and death.
2. Materials and Methods
Data sources
The Swedish Web based system for Enhancement and Development of Evidence based care in Heart disease Evaluated According to Recommended Therapies (SWEDEHEART) includes virtually all patients admitted to Swedish coronary care units (CCU) or other specialized facilities due to symptoms suggestive of ACS [7]. The registry prospectively and systematically collects data on hundreds of variables, describing demographics, coexisting condition, risk factors, biomarkers, admission logistics, pre- and in-hospital treatments including coronary angiography and revascularization procedures, in-hospital complications, discharge medications, and a range of final diagnoses. Data quality is assessed continuously with standardized procedures to validate the data quality. We assessed all observations in SWEDEHEART during 2015 to 2021 throughout Sweden. Access to data is available for research by application to the SWEDEHEART steering group.
Ethics
The study used register data from the SWEDEHART. All the data was censored and only variables that couldn’t identify the individual was provided. All the data is stored in secure locations. The study was approved by the Swedish Ethical Review Authority Gothenburg Region, In accordance with Swedish legislation and due to the fact that data were anonymized before analysis the Swedish Ethical Review Authority Gothenburg Region waived the need for written informed consent from the participants. All methods were carried out in accordance with Declaration of Helsinki.
Data availability
The data that support the findings of this study are available from SWEDEHEART but restrictions apply to the availability of these data, which were used under license for the current stud. Data are however available from the authors upon reasonable request and with permission of SWEDEHEART.
Patient selection
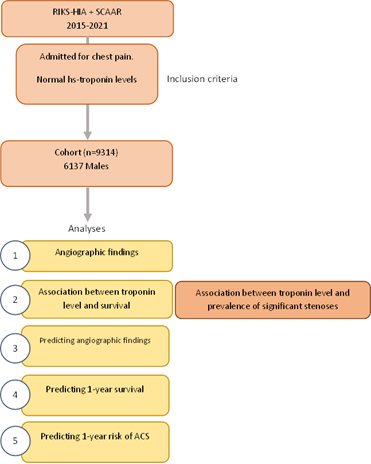
We included all cases admitted to the CCU due to chest pain, with normal hs-troponins, who underwent CAG but without receiving a final diagnosis of AMI. Normal hs-troponin was defined as peak values below the 99th percentile for healthy individuals. There were assays for troponin I (hs-cTnI) and troponin T (hs-cTnT); hs-cTnT was measured using Roche Diagnostic and hs-cTnI was measured using Abbott Architext Stat. For hs-cTnT the 99th percentile for healthy controls was 14 ng/L for men and women. For hs-cTnI the 99th percentile for healthy female controls was 15 ng/L, and for men 35 ng/L. Individuals with peak values below these limits were considered eligible.
Outcomes
The outcomes studied were 1-year mortality, ACS within 1 year (ACS defined as UA, NSTEMI or STEMI within one year after discharge for index hospitalization) and CAG findings (during index hospitalization). The purpose of predicting CAG findings was to evaluate whether it is possible to predict the likelihood that CAG results in revascularization. Revascularization were defined as any ad-hoc or planned PCI or CABG, and further assessments were defined as any evaluation recommended by the operator as a result of the CAG. Hence, with regards to CAG findings, we predict whether CAG resulted in revascularization or prompted further investigation. If not, we defined it as CAG without revascularization (CAWR).
2.1 Statistical analyses
2.1.1 Association between troponins and obstructive coronary artery stenoses – The association between hs-troponins and angiographic findings were described using continuous and categorized hs-troponin levels. Angiographic findings of interest were 1 vessel disease (VD) defined as ≥50% stenosis, 2 VD, 3 VD, left main disease (LMD), or combinations of these, as well as the presence of ≥50% stenosis in any coronary artery segment.
2.1.2 Best predictors of obstructive coronary artery stenoses – To compare the predictive value (with regards to predicting the presence of ≥50% stenosis) we compared the relative importance of hs-cTnI, hs-cTnT, age, diabetes status, sex, HbA1c, glucose, total cholesterol, HDL cholesterol, LDL cholesterol, LDL/HDL ratio, ApoB, ApoA1, ApoB/ApoA1, C-reactive protein (CRP), triglycerides and hemoglobin.
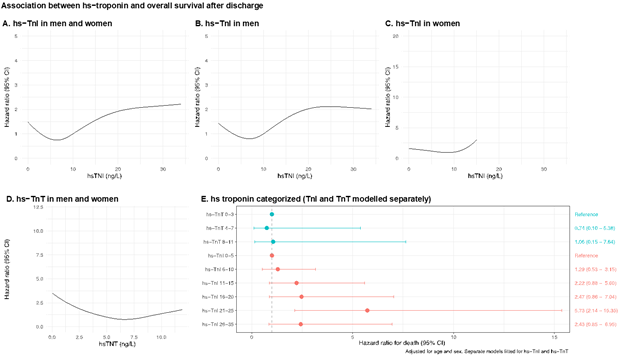
2.1.3 Troponins and overall survival – The association between normal hs-cTnI and hs-cTnT levels and overall survival was studied using Cox proportional hazards model, with adjustment for age and sex. Troponins were modelled using restricted cubic splines with 4 knots, as well as in categories.
2.2 Machine learning for 1-year mortality, 1-year risk of ACS, and CAWR
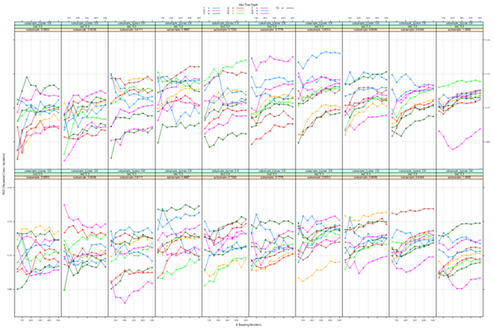
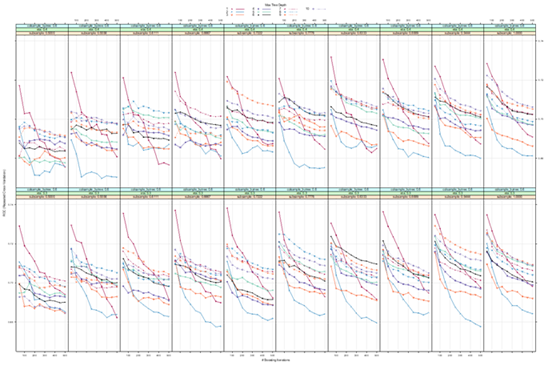
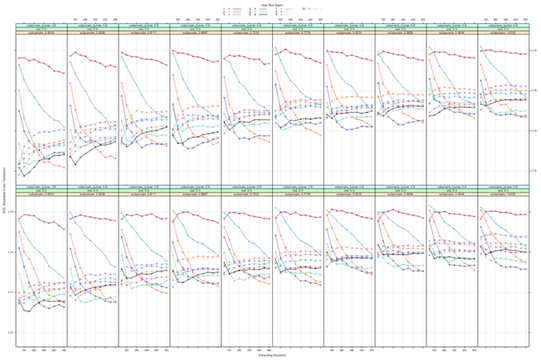
We evaluated the following machine learning frameworks: Gradient boosting,8 extreme gradient boosting,9 random forest,10 artificial neural networks,11 and logistic regression. Hyperparameter tuning was performed for all models except for logistic regression. Tuning was performed using racing methods,12 and manual specification of tune grids. Gradient boosting entails an intrinsic measure of variable importance, reflecting the predictive performance of the variable of interest.8 Hyperparameter tuning was done using a manual grid search, mounting >200 models, with shrinkage fixed to 0.01 and number of trees varying from 50 to 1500, interaction depth ranging from 1 to 16. Model selection was done using 5-fold cross validation repeated 5 times.
Variable selection – Models predicting 1-year risk of recurrent ACS, 1-year survival included 130 candidate predictors, and models for CAG findings included 110 predictors. Models for CAWR did not include any variables temporally recorded after the decision to perform CAG. Models for survival and future ACS included all variables recorded until discharge for index UA.
2.2.1 Data partitioning and sampling methods – For each prediction task we created training and testing partitions of the study population. We used 70% for training mortality and ACS models and 80% in training for CAG findings. Because the rate of death and ACS within 1 year were low, yielding highly unbalanced data that may affect the performance of tree-based ensemble methods, we downsampled the number of individuals with non-positive outcomes (i.e. those who survived in mortality models or those who did not experience an ACS within 1 year); for each event, we randomly sampled 10 individuals without an event. Downsampling was only performed in the training set.
2.2.2 Evaluating model performance – All models were trained in the training set for each task. Owing to the grid search a large number of models were computed. Model performance was evaluated in the training set using 5-fold cross-validation repeated 5 times. The area under the curve for receiver operating characteristics (AUC-ROC) was used to drive model selection. Test sets were not downsampled, thus challenging the model with the true event distribution in the population.
2.2.3 Relative variable importance – When the best performing model allowed for computation of relative variable importance, we derived such measures.13 Study design is presented in Supplementary Figure 1.
3. Results:
3.1 Study population characteristics
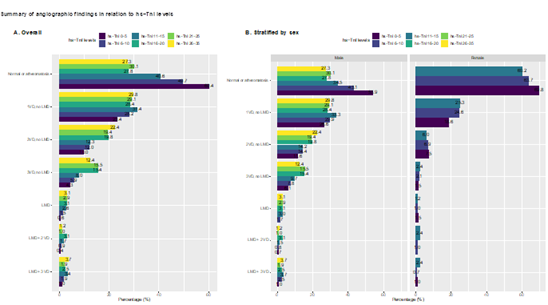
Baseline characteristics are presented in Table 1. The mean age was 62 years in men and 65 years in women. Approximately 35% of all men had a history of acute MI, compared to 25% of women. Corresponding figures for previous PCI were 39% versus 25%. Reduced left ventricular ejection fraction was observed in 7.6% of men and 4.3% of women. One in five had diabetes and around 60% had hypertension. ST-segment elevations, ST-segment depressions and pathological T-wave changes were noted in 8%, 7% and 10%, respectively, among men. Corresponding figures for women were 4%, 12% and 13%. CAG showed normal findings (or atheromatosis) in 43% of men and 62% of women. 1 VD was the most common pathology, being present in 27.7% of men and 21.5% of women. PCI ad hoc or electively, CABG and PCI, and CABG were all more common in men.
Table 1: Characteristics of 9314 patients admitted for unstable angina
|
Male |
Female |
p |
SMD |
|
|
6137 |
3177 |
|||
|
PATIENT CHARACTERISTICS |
||||
|
Age years - mean (SD) |
62.4 (10.8) |
64.6 (10.6) |
<0.001 |
0.207 |
|
Occupational status |
<0.001 |
0.253 |
||
|
Employed |
2523 (44.2) |
955 (32.8) |
||
|
Sick leave sickness compensation |
280 (4.9) |
190 (6.5) |
||
|
Unemployed |
139 (2.4) |
54 (1.9) |
||
|
Retired |
2661 (46.6) |
1670 (57.3) |
||
|
Student other |
109 (1.9) |
44 (1.5) |
||
|
Smoking status |
<0.001 |
0.146 |
||
|
Never smoker |
2432 (40.5) |
1475 (47.7) |
||
|
Ex smoker for 1 month |
2646 (44.0) |
1207 (39.0) |
||
|
Current smoker |
932 (15.5) |
412 (13.3) |
||
|
Body Mass Index (BMI) kg/m2 - mean (SD) |
27.98 (6.76) |
27.90 (13.02) |
0.709 |
0.007 |
|
S-creatinine mg L - mean (SD) |
84.11 (21.67) |
69.26 (21.53) |
<0.001 |
0.687 |
|
COEXISTING CONDITIONS |
||||
|
History of myocardial infarction |
2146 (35.0) |
760 (23.9) |
<0.001 |
0.245 |
|
History of heart failure or reduced LV function |
<0.001 |
0.15 |
||
|
No HF / reduced LV function |
5579 (92.4) |
3009 (95.7) |
||
|
LVEF 40-49 % |
310 (5.1) |
106 (3.4) |
||
|
LVEF 30-39 % |
109 (1.8) |
23 (0.7) |
||
|
LVEF <30 % |
25 (0.4) |
4 (0.1) |
||
|
LVEF unknown |
14 (0.2) |
2 (0.1) |
||
|
History of PCI |
2374 (38.7) |
805 (25.3) |
<0.001 |
0.289 |
|
History of cardiac surgery |
<0.001 |
0.159 |
||
|
No |
5545 (90.5) |
3002 (94.6) |
||
|
CABG |
531 (8.7) |
163 (5.1) |
||
|
Other surgery |
54 (0.9) |
10 (0.3) |
||
|
History of diabetes, any |
1337 (21.9) |
618 (19.5) |
0.008 |
0.059 |
|
History of hypertension |
3572 (58.3) |
1888 (59.5) |
0.266 |
0.025 |
|
History of stroke |
238 (3.9) |
141 (4.4) |
0.213 |
0.028 |
|
CLINICAL STATUS AT ADMISSION |
||||
|
Admission ECG rhythm |
0.002 |
0.081 |
||
|
Sinus rhythm |
5804 (94.9) |
3053 (96.2) |
||
|
AF / AFL |
248 (4.1) |
106 (3.3) |
||
|
Other |
67 (1.1) |
15 (0.5) |
||
|
QRS abnormality |
<0.001 |
0.196 |
||
|
Normal |
4967 (81.3) |
2660 (83.9) |
||
|
Pacemaker |
82 (1.3) |
25 (0.8) |
||
|
LBBB |
231 (3.8) |
199 (6.3) |
||
|
Pathological Q wave |
257 (4.2) |
78 (2.5) |
||
|
RBBB |
265 (4.3) |
75 (2.4) |
||
|
Other |
308 (5.0) |
135 (4.3) |
||
|
Previously unknown left bundle branch block |
93 (43.7) |
104 (56.2) |
0.016 |
0.253 |
|
ST T segment changes |
<0.001 |
0.262 |
||
|
Normal |
3893 (63.7) |
1898 (59.9) |
||
|
ST segment elevation |
494 (8.1) |
116 (3.7) |
||
|
ST segment depression |
447 (7.3) |
394 (12.4) |
||
|
Pathological T wave |
635 (10.4) |
400 (12.6) |
||
|
Other |
641 (10.5) |
361 (11.4) |
||
|
Heart rate bpm - mean (SD) |
72.82 (15.48) |
75.04 (15.01) |
<0.001 |
0.146 |
|
Systolic blood pressure mmHg - mean (SD) |
148.04 (22.36) |
152.45 (24.09) |
<0.001 |
0.19 |
|
Diastolic blood pressure mmHg - mean (SD) |
84.81 (12.97) |
82.39 (13.39) |
<0.001 |
0.184 |
|
MEDICATIONS AT ADMISSION |
||||
|
RAAS blockade |
<0.001 |
0.18 |
||
|
None |
3233 (53.0) |
1816 (57.4) |
||
|
A2 blocker |
1281 (21.0) |
759 (24.0) |
||
|
ACEi |
1553 (25.5) |
575 (18.2) |
||
|
A2 blocker and ACEi |
34 (0.6) |
13 (0.4) |
||
|
Oral anticoagulants |
0.171 |
0.067 |
||
|
None |
5581 (91.5) |
2910 (92.1) |
||
|
Warfarin |
195 (3.2) |
90 (2.8) |
||
|
Dabigatran Pradaxa |
32 (0.5) |
17 (0.5) |
||
|
Rivaroxaban |
72 (1.2) |
25 (0.8) |
||
|
Apixaban |
217 (3.6) |
116 (3.7) |
||
|
Edoxaban |
1 (0.0) |
3 (0.1) |
||
|
Other |
4 (0.1) |
0 (0.0) |
||
|
Aspirin |
3041 (49.8) |
1360 (43.0) |
<0.001 |
0.137 |
|
Other anti platelet agent at adission |
0.002 |
0.096 |
||
|
None |
5181 (84.9) |
2772 (87.7) |
||
|
Clopidogrel |
447 (7.3) |
185 (5.9) |
||
|
Prasugrel |
21 (0.3) |
6 (0.2) |
||
|
Ticagrelor |
448 (7.3) |
191 (6.0) |
||
|
Other |
6 (0.1) |
7 (0.2) |
||
|
Beta blocker at admission |
2773 (45.5) |
1442 (45.6) |
0.907 |
0.003 |
|
CCB at admission |
1241 (20.3) |
654 (20.7) |
0.708 |
0.009 |
|
Insulin therapy |
449 (7.4) |
228 (7.2) |
0.827 |
0.006 |
|
Oral hypoglycemic agents at admission |
835 (16.4) |
367 (13.3) |
<0.001 |
0.086 |
|
SGLT2i at admission |
44 (4.0) |
10 (2.2) |
0.098 |
0.106 |
|
GLP1 RA at admission |
10 (0.9) |
1 (0.2) |
0.246 |
0.093 |
|
DPP4i at admission |
38 (3.5) |
12 (2.6) |
0.475 |
0.05 |
|
Lipidlowering therapy |
3313 (54.3) |
1468 (46.4) |
<0.001 |
0.158 |
|
Statins |
3212 (52.7) |
1412 (44.7) |
<0.001 |
0.16 |
|
BIOMARKERS |
||||
|
S-cholesterol total - mean (SD) |
4.47 (1.32) |
4.95 (1.34) |
<0.001 |
0.362 |
|
S-triglycerides - mean (SD) |
1.71 (1.17) |
1.51 (0.86) |
<0.001 |
0.201 |
|
HDL cholesterol - mean (SD) |
1.16 (0.36) |
1.48 (0.45) |
<0.001 |
0.787 |
|
LDL cholesterol - mean (SD) |
2.58 (1.14) |
2.84 (1.18) |
<0.001 |
0.221 |
|
LDL cholesterol manual - mean (SD) |
2.81 (1.11) |
3.19 (1.21) |
<0.001 |
0.333 |
|
LDL cholesterol mandatory - mean (SD) |
2.79 (1.21) |
3.02 (1.25) |
<0.001 |
0.186 |
|
LDL HDL ratio - mean (SD) |
2.37 (1.17) |
2.07 (1.08) |
<0.001 |
0.272 |
|
Apolipoprotein B - mean (SD) |
0.90 (0.42) |
1.00 (0.30) |
0.342 |
0.276 |
|
Apolipoprotein A1 - mean (SD) |
1.21 (0.41) |
1.48 (0.37) |
0.012 |
0.692 |
|
B-Glucose - mean (SD) |
6.87 (2.51) |
6.69 (2.49) |
0.003 |
0.07 |
|
HbA1c - mean (SD) |
43.43 (13.20) |
42.50 (12.53) |
0.127 |
0.072 |
|
C reactive protein CRP - mean (SD) |
5.61 (14.46) |
5.25 (12.99) |
0.273 |
0.026 |
|
Hemoglobin - mean (SD) |
145.09 (12.84) |
134.05 (11.78) |
<0.001 |
0.896 |
|
hs Troponin I ng L - mean (SD) |
7.92 (2.16) |
7.31 (2.23) |
<0.001 |
0.279 |
|
hs Troponin T ng - mean (SD) |
11.50 (7.83) |
7.27 (3.71) |
<0.001 |
0.69 |
|
CORONARY ANGIOGRAPHY AND PCI |
||||
|
Presence of >50% obstructive lesions |
||||
|
SEGMENT1 |
569 (9.3) |
207 (6.5) |
<0.001 |
0.102 |
|
SEGMENT 2 |
689 (11.2) |
226 (7.1) |
<0.001 |
0.143 |
|
SEGMENT 3 |
353 (5.8) |
112 (3.5) |
<0.001 |
0.106 |
|
SEGMENT 4 |
338 (5.5) |
76 (2.4) |
<0.001 |
0.16 |
|
SEGMENT 5 |
317 (5.2) |
106 (3.3) |
<0.001 |
0.091 |
|
SEGMENT 6 |
1193 (19.4) |
382 (12.0) |
<0.001 |
0.205 |
|
SEGMENT 7 |
1281 (20.9) |
461 (14.5) |
<0.001 |
0.167 |
|
SEGMENT 8 |
281 (4.6) |
65 (2.0) |
<0.001 |
0.142 |
|
SEGMENT 9 |
633 (10.3) |
213 (6.7) |
<0.001 |
0.13 |
|
SEGMENT 10 |
150 (2.4) |
30 (0.9) |
<0.001 |
0.116 |
|
SEGMENT 11 |
673 (11.0) |
163 (5.1) |
<0.001 |
0.216 |
|
SEGMENT 12 |
616 (10.0) |
152 (4.8) |
<0.001 |
0.202 |
|
SEGMENT 13 |
264 (4.3) |
66 (2.1) |
<0.001 |
0.127 |
|
SEGMENT 14 |
343 (5.6) |
100 (3.1) |
<0.001 |
0.12 |
|
SEGMENT 15 |
53 (0.9) |
9 (0.3) |
0.002 |
0.077 |
|
SEGMENT 16 |
37 (0.6) |
6 (0.2) |
0.008 |
0.066 |
|
SEGMENT 17 |
218 (3.6) |
52 (1.6) |
<0.001 |
0.121 |
|
SEGMENT 18 |
187 (3.0) |
46 (1.4) |
<0.001 |
0.108 |
|
SEGMENT 19 |
2 (0.0) |
1 (0.0) |
1 |
0.001 |
|
SEGMENT 20 |
12 (0.2) |
4 (0.1) |
0.613 |
0.017 |
|
Angiographic summary |
<0.001 |
0.414 |
||
|
Normal or atheromatosis |
2515 (43.1) |
1891 (62.3) |
||
|
1 VD no LMD |
1617 (27.7) |
651 (21.5) |
||
|
2 VD no LMD |
817 (14.0) |
248 (8.2) |
||
|
3 VD no LMD |
564 (9.7) |
138 (4.5) |
||
|
LMD |
86 (1.5) |
40 (1.3) |
||
|
LMD 2 VD |
96 (1.6) |
29 (1.0) |
||
|
LMD 3 VD |
135 (2.3) |
37 (1.2) |
||
|
Ocklusion aged <3 months |
125 (70.2) |
38 (82.6) |
0.135 |
0.295 |
|
Angiographist’s primary decision |
0.367 |
|||
|
No intervention |
1343 (23.0) |
1144 (37.6) |
||
|
PCI ad hoc1 |
2782 (47.7) |
1068 (35.1) |
||
|
PCI electively |
59 (1.0) |
28 (0.9) |
||
|
Cotninued OMT (optimal medical treatment) |
855 (14.6) |
499 (16.4) |
||
|
Continued assessment |
404 (6.9) |
180 (5.9) |
||
|
CABG |
343 (5.9) |
92 (3.0) |
||
|
PCI and CABG |
0 (0.0) |
0 (0.0) |
||
|
Other |
52 (0.9) |
28 (0.9) |
||
|
1Includes 1040 diagnostic procedures without balloon inflation, stent implantation or other arterial interventions. These cases were classified as unnecessary angiographies. |
||||
3.2 Association between troponins and obstructive coronary artery stenoses
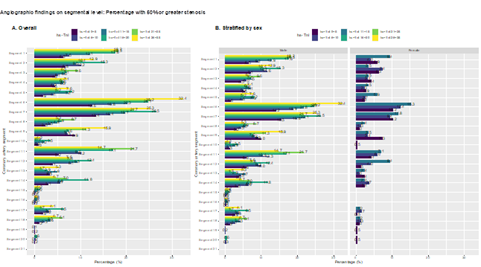
There was a clear and graded association between hs-troponins (within normal range) and the presence of obstructive coronary artery disease (Figure 1). In cases with hs-cTnI 26-35 ng/l 27.3% had normal angiography, compared with 60.4% among those with hs-cTnI 0-5 ng/L (Figure 1A). The association was stronger for more severe coronary artery disease; e.g there was a threefold difference in the rate of 3 VD comparing the lowest and highest hs-cTnI categories, and a twofold difference for 2 VD. The association was present in both men and women (Figure 1B). The same association was evident for presence of obstructive (>50% stenosis) in all coronary artery segments (Figure 2). In segment 6, cases with hs-cTnI 0-5 ng/L had >50% stenosis in 12.6% of cases, compared with 32.4% of cases in those with hs-cTnI 26-35 ng/L.
3.3 Troponins and overall survival
The associations between hs-cTnI and hs-cTnT levels and overall survival are presented in Figures 3A to 3E. Within the normal range of hs-cTnI we observed increased mortality at levels above 10 ng/L (which was set as the reference level; Figure 3A). Modelling hs-cTnI with restricted cubic splines suggests a hazard ratio around 2 at hs-cTnI 30 ng/L, compared with 10 ng/L. This association was driven by men (Figure 3B and 3C). We did not observe any association between hs-cTnT and survival (Figure 3D). Modelling the troponins as categorical variables revealed the same association, i.e a graded and positive association with death for hs-cTnI, but not for hs-cTnT (Figure 3E).
3.4 Best predictors of mortality
Extreme gradient boosting (XGB) outperformed all models for all three tasks (differences shown for 1-year mortality in Supplementary Figure 1). Henceforth, results are derived from the best performing XGB model.
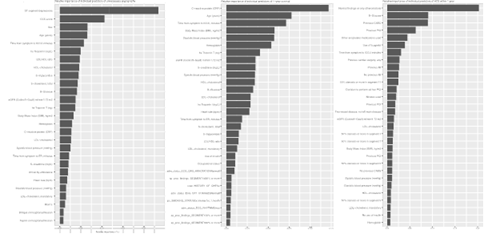
3.5 Relative importance for predicting death, ACS and CAG findings
Results from hyperparameter tuning are presented in Supplementary Figures 2 to 4. Relative importance of the top 30 predictors for each outcome is presented in Supplementary Figure 5. For CAG findings, ST segment depressions, Canadian Cardiovascular Society (CSS) score, sex, age, delay from symptom onset to CCU admission, hs-cTnI and LDL/HDL ratio, HDL cholesterol and triglycerides were the 10 strongest predictors of CAG findings. With regards to predicting ACS within 1 year, angiographic findings, glucose levels, history of CABG and PCI, use of antiplatelet drugs, history of MI or cardiac surgery, as well as presence of >50% stenosis in segment 11 were the strongest predictors. For death, C-reactive protein, age, delay to CCU admission, BMI, diastolic blood pressure, hemoglobin, hs-cTnI and eGFR were the best predictors.
4. Discussion
ACS are potentially life-threating conditions, and precise risk-stratification is pivotal to reducing the risk of recurrent events and adverse outcomes. At the same time, total mortality and nonfatal AMI rates are low in patients with UA[16]. In current study; 40% had no obstructive coronary disease and the majority of all CAG did not result in any revascularization (PCI or CABG) or prompt further investigations. We demonstrate that hs-troponin within upper normal range, notably hs-cTnI, represents a strong predictor of obstructive coronary disease and survival. Indeed, among 17 risk factors for atherosclerosis, hs-cTnI was the strongest predictor of significant stenoses in LAD. These findings challenge the definition of normal troponin levels. The findings that hs-troponins within normal range predict the presence of coronary stenosis have several plausible explanations. In a recent study, 25182 Swedish citizens aged 50–64 years with no previous myocardial infarction, underwent coronary computed tomography angiography (CCTA), and 42 % were found to have atherosclerosis, and stenosis ≥50% was observed in 5% [14]. This study population represents the Swedish background population, ie the same population engendering the reference values for troponins. While hs-troponins were not analyzed in that study, it can be speculated whether higher values (within normal range) reflect the presence of atherosclerotic disease. The normal range of hs-troponins in a population free from atherosclerotic coronary disease has not been established in Sweden. Nevertheless, our findings suggest that hs-troponins within normal range do carry information about risk. This is also supported by our finding that the association between hs-cTnI (within normal range) and the prevalence of >50% stenosis was stronger with increasing severity of atherosclerosis (1VD vs. 2VD vs. 3VD; Figure 1). Chest pain is one of the most common complaints in emergency departments and CCUs worldwide [15]. At the crux of the current study lies the challenge of assessing patients with chest pain. While the introduction high-sensitivity cardiac troponins have improved detection of myocardial infarction, patients with UA continue to represent a clinical dilemma. These patients often lack objective signs of ischemia and sometimes present with ambiguous symptoms. The majority of all cases studied did not require any intervention with PCI or CABG and 40% had normal coronary arteries. Unnecessary invasive procedures result in costs and constitutes a risk for the patient, therefor we will elaborate our models to create clinical prediction tools that is warranted to develop and validate prediction models that identify patients in need of CAG. We used efficient machine learning models to predict survival, risk of recurrent ACS and whether CAG would result in any revacularization, our data suggest that such models can be developed. With regards to CAG findings (i.e the likelihood of CAG resulting in revascularization with PCI or CABG or leading to further assessment), we achieved an AUC-ROC of 0.788, which equals a clinically meaningful model,[17–19] and a ROC-curve that indicates that a high sensitivity can be maintained while keeping false-positive rates lower than currently (recall that all patients underwent CAG in the current study population). We also demonstrate that 1-year risk of recurrent ACS and death can be predicted, and, importantly, that parsimonious models including the most widely available predictors are sufficient to achieve a high predictive performance. Among the 9’314 individuals admitted to the CCU due to chest pain with normal hs-TnI, we observed a low prevalence of ST-T segment changes. We also show that ST-T segment depression was amongst the strongest predictors of CAG findings, which supports previous knowledge and current guidelines. UA is a comparably low-risk population and the introduction of hs-cTn furthermore decreases the risk-profile in UA due to its high sensitivity in ruling out cardiac ischemia. CAG showed no obstructive coronary disease in 43% of men and 62% of women. Furthermore, we observed increased mortality at hs-cTnI levels above 10 ng/L, but still within normal range. These findings strongly suggest that we need to be cautious in assessing hs-cTnI in the upper quantiles of the normal range. It is advisable to consider the risk-profile and clinical presentation in every individual patient in conjunction to biomarkers. Moreover, this finding also challenges the notion of normal troponin levels. One could argue that the particular model was underadjusted, since it only accounted for age and sex. The purpose of this was to simulate the context in which normal troponin values are derived; indeed, they are derived in relation to just age and sex. The best predictors for CAG findings in the model was elevated cardiac biomarkers, ST segment depression, Canadian Cardiovascular Society (CSS) score, sex, and age. ST segment depression is an objective sign of cardiac ischemia and is known to be a prognostic factor. Increasing age and male sex are also known risk factors for coronary artery disease. The most important predictor for ACS within 1 year, was angiographic findings, followed by glucose levels, history of CABG or PCI. This suggests that the presence of any coronary artery disease should prompt clinicians to target modifiable risk factors and instigate evidence-based medications. For death, C-reactive protein (CRP) was the best predictor. CRP has been shown to be strongly predictive of long-term death or AMI for patients presenting with both stable and UA and should therefore be regarded as a coronary risk marker that may reflect either an acute phase reaction or chronic inflammation. A large body of evidence demonstrates that inflammation is causally linked to atherothrombosis [20,21].
Study limitations
This study is subject to the limitations of observational design. Our definition of UA is based on the fact that the patient was admitted to the CCU due to chest pain, with acquisition of hs-cTn (which was normal) and required CAG. One could argue that this differs from current guideline criteria. However, we argue that any chest pain requiring this management should be considered as UA, and furthermore, the diagnosis of UA is often not supported by objective findings. This study is based on a large number of patients, more than 9000, and in that way reflects a real-world setting.
In summary, we show that within the range of normal troponins lies the ability to predict the presence of coronary stenosis and death. We also show that the most important predictors of 1-year survival, risk of recurrent ACS and CAG findings in patients with UA are widely available and should be used to risk stratify these patients. Finally, we demonstrate that hs-cTnI was the strongest predictor of significant stenoses among other well-established risk factors for atherosclerosis.
References:
- Braunwald E, Morrow DA. Unstable Angina. Circulation 127 (2013): 2452–7.
- Freedberg AS, Blumgart HL, Zoll PM, Schlesinger MJ. Coronary Failure: The Clinical Syndrome of Cardiac Pain Intermediate Between Angina Pectoris and Acute Myocardial Infarction. Journal of the American Medical Association 138 (1948): 107–14.
- Collet JP, Thiele H, Barbato E, et al. 2020 ESC Guidelines for the management of acute coronary syndromes in patients presenting without persistent ST-segment elevation. Eur Heart J 42 (2020): 1289-1367.
- Fowler NO. “Preinfarctional” angina. A need for an objective definition and for a controlled clinical trial of its management. Circulation 44 (1971): 755–8.
- Shah ASV, Anand A, Strachan FE, et al. High-sensitivity troponin in the evaluation of patients with suspected acute coronary syndrome: a stepped-wedge, cluster-randomised controlled trial. The Lancet 392 (2018): 919–28.
- Puymirat E, Simon T, Cayla G, et al. Acute Myocardial Infarction: Changes in Patient Characteristics, Management, and 6-Month Outcomes Over a Period of 20 Years in the FAST-MI Program (French Registry of Acute ST-Elevation or Non-ST-Elevation Myocardial Infarction) 1995 to 2015. Circulation 136 (2017): 1908–19.
- Eggers KM, Lindahl B, Melki D, et al. Consequences of implementing a cardiac troponin assay with improved sensitivity at Swedish coronary care units: an analysis from the SWEDEHEART registry. Eur Heart J 37 (2016): 2417–24.
- Friedman JH. Stochastic gradient boosting. Computational Statistics & Data Analysis 38 (2002): 367–78.
- Chen T, Guestrin C. XGBoost: A Scalable Tree Boosting System. Proceedings of the 22nd ACM SIGKDD International Conference on Knowledge Discovery and Data Mining (2016): 785–94.
- Breiman L. Random Forests. Machine Learning 45 (2001): 5–32.
- Esteva A, Robicquet A, Ramsundar B, et al. A guide to deep learning in healthcare. Nat Med 25 (2019): 24–9.
- Maron O, Moore A. Hoeffding Races: Accelerating Model Selection Search for Classification and Function Approximation. In: Advances in Neural Information Processing Systems. Morgan-Kaufmann (1993).
- van der Laan M. Statistical Inference for Variable Importance. UC Berkeley Division of Biostatistics Working Paper Series (2005).
- Bergström G, Persson M, Adiels M, et al. Prevalence of Subclinical Coronary Artery Atherosclerosis in the General Population. Circulation 144 (2021): 916–29.
- Niska R, Bhuiya F, Xu J. National Hospital Ambulatory Medical Care Survey: 2007 Emergency Department Summary (2010).
- Serés L, Valle V, Marrugat J, et al. Usefulness of hospital admission risk stratification for predicting nonfatal acute myocardial infarction or death six months later in unstable angina pectoris. American Journal of Cardiology 84 (1999): 963–9.
- Steyerberg EW, van der Ploeg T, Van Calster B. Risk prediction with machine learning and regression methods. Biom J 56 (2014): 601–6.
- Steyerberg EW, Vergouwe Y. Towards better clinical prediction models: seven steps for development and an ABCD for validation. European Heart Journal 35 (2014): 1925–31.
- Shah ND, Steyerberg EW, Kent DM. Big Data and Predictive Analytics: Recalibrating Expectations. JAMA 320 (2018): 27.
- Libby P, Ridker PM, Hansson GK. Inflammation in Atherosclerosis: From Pathophysiology to Practice. Journal of the American College of Cardiology 54 (2009): 2129–38.
- Paul M Ridker, Brendan M Everett, Tom Thuren, et al. Antiinflammatory Therapy with Canakinumab for Atherosclerotic Disease. NEJM 377(2017).

