Analytical Anisotropic Algorithm Calculation in Total Body Irradiation: A Comparison with Monte Carlo Calculation and Dosimetry
Article Information
Aleksi Saikkonen1,2*, Jarkko Ojala3, Jani Keyrilainen1,2
1Department of Physics and Astronomy, University of Turku, Vesilinnantie 5, FIN-20521 Turku, Finland
2Department of Medical Physics and Department of Oncology and Radiotherapy, Turku University Hospital, Hämeentie 11, FIN-20521 Turku, Finland
3Department of Medical Physics and Department of Oncology, Tampere University Hospital, Teiskontie 35, FIN-33521 Tampere, Finland
*Corresponding Author: Aleksi Saikkonen, Department of Physics and Astronomy, University of Turku, Vesilinnantie 5, FIN-20521 Turku, Finland
Received: 04 November 2021; Accepted: 22 November 2021; Published: 06 December 2021
Citation:
Saikkonen A, Ojala J, Keyrilainen J. Analytical Anisotropic Algorithm Calculation in Total Body Irradiation: A Comparison with Monte Carlo Calculation and Dosimetry. Journal of Cancer Science and Clinical Therapeutics 5 (2021): 532-547.
Share at FacebookAbstract
Purpose: This study aimed to investigate the feasibility and accuracy of an analytical anisotropic algorithm calculation of the Varian Eclipse treatment planning system in the TBI treatment planning at an extended source-to-surface distance of 400 cm.
Materials and Methods: The TBI treatment was planned with the Varian Eclipse TPS using the AAA for the dose calculation. Monte Carlo calculations were performed using the EGSnrc code package. Percentage depth dose curves, central axis dose profiles and absolute doses of the 6 MV photon beams from the Varian TrueBeam linear accelerator were measured at an extended SSD of 400 cm in water, solid water and anthropomorphic phantoms.
Results: Calculated and measured PDD curves were in good agreement at the depths of 30.0 cm or less. Calculated and measured central axis dose profiles were clinically acceptable, observing the largest uncertainties close the field edges. Absolute dose measurements in water phantoms showed that the MC and AAA calculations overestimated doses by up to 2.2 % and 1.8 %, respectively. In the anthropomorphic phantom, the difference between measured and calculated mean doses in the whole body volume was 1.0 % and 6.2 % for MC and AAA, respectively. In the AAA calculation, the largest observed difference was 8.3 % in the head.
Conclusions: The Eclipse’s AAA calculation can be safely used for the TBI treatment planning at the extended SSD of 400 cm. However, in order to achieve a higher level of accuracy in the TBI planning, one must carefully validate the TPS at extended SSDs.
Keywords
Dose calculation; Monte Carlo; radiotherapy; Radiophotoluminescence; Total body irradiation
Dose calculation articles; Monte Carlo articles; radiotherapy articles; Radiophotoluminescence articles; Total body irradiation articles
Dose calculation articles Dose calculation Research articles Dose calculation review articles Dose calculation PubMed articles Dose calculation PubMed Central articles Dose calculation 2023 articles Dose calculation 2024 articles Dose calculation Scopus articles Dose calculation impact factor journals Dose calculation Scopus journals Dose calculation PubMed journals Dose calculation medical journals Dose calculation free journals Dose calculation best journals Dose calculation top journals Dose calculation free medical journals Dose calculation famous journals Dose calculation Google Scholar indexed journals Monte Carlo articles Monte Carlo Research articles Monte Carlo review articles Monte Carlo PubMed articles Monte Carlo PubMed Central articles Monte Carlo 2023 articles Monte Carlo 2024 articles Monte Carlo Scopus articles Monte Carlo impact factor journals Monte Carlo Scopus journals Monte Carlo PubMed journals Monte Carlo medical journals Monte Carlo free journals Monte Carlo best journals Monte Carlo top journals Monte Carlo free medical journals Monte Carlo famous journals Monte Carlo Google Scholar indexed journals radiotherapy articles radiotherapy Research articles radiotherapy review articles radiotherapy PubMed articles radiotherapy PubMed Central articles radiotherapy 2023 articles radiotherapy 2024 articles radiotherapy Scopus articles radiotherapy impact factor journals radiotherapy Scopus journals radiotherapy PubMed journals radiotherapy medical journals radiotherapy free journals radiotherapy best journals radiotherapy top journals radiotherapy free medical journals radiotherapy famous journals radiotherapy Google Scholar indexed journals Radiophotoluminescence articles Radiophotoluminescence Research articles Radiophotoluminescence review articles Radiophotoluminescence PubMed articles Radiophotoluminescence PubMed Central articles Radiophotoluminescence 2023 articles Radiophotoluminescence 2024 articles Radiophotoluminescence Scopus articles Radiophotoluminescence impact factor journals Radiophotoluminescence Scopus journals Radiophotoluminescence PubMed journals Radiophotoluminescence medical journals Radiophotoluminescence free journals Radiophotoluminescence best journals Radiophotoluminescence top journals Radiophotoluminescence free medical journals Radiophotoluminescence famous journals Radiophotoluminescence Google Scholar indexed journals Total body irradiation articles Total body irradiation Research articles Total body irradiation review articles Total body irradiation PubMed articles Total body irradiation PubMed Central articles Total body irradiation 2023 articles Total body irradiation 2024 articles Total body irradiation Scopus articles Total body irradiation impact factor journals Total body irradiation Scopus journals Total body irradiation PubMed journals Total body irradiation medical journals Total body irradiation free journals Total body irradiation best journals Total body irradiation top journals Total body irradiation free medical journals Total body irradiation famous journals Total body irradiation Google Scholar indexed journals Analytical anisotropic algorithm articles Analytical anisotropic algorithm Research articles Analytical anisotropic algorithm review articles Analytical anisotropic algorithm PubMed articles Analytical anisotropic algorithm PubMed Central articles Analytical anisotropic algorithm 2023 articles Analytical anisotropic algorithm 2024 articles Analytical anisotropic algorithm Scopus articles Analytical anisotropic algorithm impact factor journals Analytical anisotropic algorithm Scopus journals Analytical anisotropic algorithm PubMed journals Analytical anisotropic algorithm medical journals Analytical anisotropic algorithm free journals Analytical anisotropic algorithm best journals Analytical anisotropic algorithm top journals Analytical anisotropic algorithm free medical journals Analytical anisotropic algorithm famous journals Analytical anisotropic algorithm Google Scholar indexed journals Computed tomography articles Computed tomography Research articles Computed tomography review articles Computed tomography PubMed articles Computed tomography PubMed Central articles Computed tomography 2023 articles Computed tomography 2024 articles Computed tomography Scopus articles Computed tomography impact factor journals Computed tomography Scopus journals Computed tomography PubMed journals Computed tomography medical journals Computed tomography free journals Computed tomography best journals Computed tomography top journals Computed tomography free medical journals Computed tomography famous journals Computed tomography Google Scholar indexed journals Radiophotoluminescence articles Radiophotoluminescence Research articles Radiophotoluminescence review articles Radiophotoluminescence PubMed articles Radiophotoluminescence PubMed Central articles Radiophotoluminescence 2023 articles Radiophotoluminescence 2024 articles Radiophotoluminescence Scopus articles Radiophotoluminescence impact factor journals Radiophotoluminescence Scopus journals Radiophotoluminescence PubMed journals Radiophotoluminescence medical journals Radiophotoluminescence free journals Radiophotoluminescence best journals Radiophotoluminescence top journals Radiophotoluminescence free medical journals Radiophotoluminescence famous journals Radiophotoluminescence Google Scholar indexed journals Treatment planning system articles Treatment planning system Research articles Treatment planning system review articles Treatment planning system PubMed articles Treatment planning system PubMed Central articles Treatment planning system 2023 articles Treatment planning system 2024 articles Treatment planning system Scopus articles Treatment planning system impact factor journals Treatment planning system Scopus journals Treatment planning system PubMed journals Treatment planning system medical journals Treatment planning system free journals Treatment planning system best journals Treatment planning system top journals Treatment planning system free medical journals Treatment planning system famous journals Treatment planning system Google Scholar indexed journals Ionization chamber articles Ionization chamber Research articles Ionization chamber review articles Ionization chamber PubMed articles Ionization chamber PubMed Central articles Ionization chamber 2023 articles Ionization chamber 2024 articles Ionization chamber Scopus articles Ionization chamber impact factor journals Ionization chamber Scopus journals Ionization chamber PubMed journals Ionization chamber medical journals Ionization chamber free journals Ionization chamber best journals Ionization chamber top journals Ionization chamber free medical journals Ionization chamber famous journals Ionization chamber Google Scholar indexed journals
Article Details
Abbreviation:
AAA- Analytical anisotropic algorithm; AP- Anterior-posterior; BP2- Blue Phantom 2; CA- Collimator rotation angle; CT- Computed tomography; IC- Ionization chamber; MC- Monte Carlo; MU- Monitor unit; PA- Posterior-anterior; PDD- Percentage depth dose; RPL- Radiophotoluminescence; RT- Radiation therapy; SD- Standard deviation; SSD- Source-to-surface distance; TBI- Total body irradiation; TPS- Treatment planning system
1. Introduction
Total body irradiation (TBI) is a radiation therapy (RT) technique that plays an essential role in the treatment planning of patients with acute myeloid or lymphoid leukemia undergoing hematopoietic stem cell transplantation [1]. The purpose of treatment is the irradiation of whole bone marrow to reduce the number of viable cells and immuno-suppress the patient sufficiently to avoid rejection of the donor bone marrow transplant. In TBI in general, the uniformity of the dose distribution along the cranio-caudal body axis is of the order of ±10 % of the prescribed dose [2]. A fractionated TBI treatment can be performed either before or after the chemotherapy [1]. There are numerous techniques for delivering the TBI treatment: a technique can vary based on the way the dose is delivered, the beam energy is used, or the patient is orientated. For instance, one of the most recently studied techniques is a volumetric modulated arc therapy, where the patient is lying on the couch at the Source-to-Surface Distance (SSD) of around 200 cm [3,4]. More commonly used is an Anterior-Posterior (AP) / Posterior-Anterior (PA) technique with the extended SSD of approximately 400 cm, where the patient is lying on the couch either down supine or on his/her side or in a standing position [1,2]. Traditionally, the TBI treatment planning has been based on point (e.g. head, sternum, abdomen, pelvis/symphysis and ankles) dose measurements, while recently, also the computed tomography (CT) -based TBI treatment planning has become more widely used [1]. In the latter, the treatment planning systems (TPS) can give accurate information about the dose to critical organs, e.g. lungs. For TBI, the clinical TPSs such as the Eclipse (Varian Medical Systems Inc., Palo Alto, CA, USA) and its analytical anisotropic algorithm (AAA) have been studied earlier with relatively incoherent results [5-8]. The Monte Carlo (MC) calculation methods provide an efficient way to investigate the dosimetry in RT under non-reference conditions and they are considered to be the most accurate dose calculation methods [9,10]. Anyhow, the general-purpose MC codes, such as the one used in this work, are not intended for direct use in clinical treatment planning, but they are superb tools for dose validation, e.g., in the TBI planning [11,12]. The aim of this work was to investigate the feasibility and accuracy of the Varian Eclipse’s AAA calculation in the TBI treatment planning at an extended SSD of 400 cm by comparing it with MC calculation and different dosimetry methods. To our knowledge, this is the first time the EGSnrc MC calculation is used to evaluate the accuracy of AAA (version 15.6.04) calculation in the TBI treatments.
2. Materials and Methods
2.1. Dose calculation methods
The AAA (version 15.6.04) dose calculation was performed using the Eclipse TPS at the Department of Oncology and Radiotherapy of Turku University Hospital (Turku, Finland). The standard clinical TBI practice utilized at our department was used in all calculations: a photon beam with the nominal energy of 6 MV, a dose rate of 200 monitor units (MU)/min, a field size of 40.0 x 40.0 cm2 defined at the SSD of 100 cm, a collimator rotation angle (CA) of 45°, a gantry rotation angle of 90° and an extended SSD of 400 cm, the treatment parameters fed into the TrueBeam (Varian Medical Systems Inc., Palo Alto, CA, USA) linear accelerator (linac). No compensators were used in this study. MC calculations were performed with the EGSnrc (version 2018, National Research Council Canada, Ottawa, Ontario, Canada) code package, which is a software toolkit for modeling the transport of electrons and photons through the matter [13]. The EGSnrc-based BEAM simulations for the 6 MV photon beam from the TrueBeam linac were based on manufacturer’s phase-space files, which after concatenation were used as source in the subsequent treatment head simulations. The phase-space file data was collected at a plane above the jaws and the input file for the simulation contained the jaws, an approximation of the collimator baseplate, the multi-leaf collimator in a park position, the light field reticle, and the interface mount with the geometrical and material details provided by the manufacturer.
The EGSnrc-based phantom dose calculations were performed with the DOSXYZnrc, which is a code for calculating dose distributions in a rectilinear voxel phantom. The absolute dose calibration in the simulations followed the technique by Popescu et al. [14], assuming that the backscatter to the monitor chamber is small with the TrueBeam [15]. In all simulations, the used electron and photon transport cutoff parameters were 0.700 MeV and 0.01 MeV, respectively. Other EGSnrc parameters utilized were the same as those described in Partanen et al. [16]. The CT-based patient phantom geometry for the full MC simulations was reconstructed from the CT dataset, exported from the TPS, with the CTCREATE code in the MC code package. The CT number-to-material and density conversion curve was defined using the tissue characterization phantom (RMI Gammex 467, Middleton, WI, USA). The corresponding cross section data for the materials were applied in the MC dose calculation. The materials matched the material table in the TPS and the density ranges of the materials applied in the full MC simulations were specified by defining the halfway between the nominal densities of every two consecutive materials in the TPS’s material library [17]. For the couch surface (cork) and the material inside the couch (polystyrene), a single value of Hounsfield unit and densities were assigned and defined. The calculation grid size was set to 2.5 mm. In each DOSXYZnrc simulation, the number of particle histories used was selected, so that the statistical uncertainty in the high-dose voxels was about 0.5 % on average. The MC simulations produced inherently the dose distributions in dose report mode dose-to-medium. The dose calculations with MC and AAA, as well as the dose measurements were compared against each other in the standard conditions (the SSD of 100 cm and the field size of 10.0 x 10.0 cm2) and all results appeared to be within 1 % and 1 mm.
2.2. Dose measurement methods
The treatment field size for TBI is 40.0 x 40.0 cm2 defined at the SSD of 100 cm, which corresponds to the projected field size of 160.0 x 160.0 cm2 at the SSD of 400. Thus, with the CA 45°, the maximum (diagonal) width of the field is 226 cm, which makes the collection of field data quite challenging. For this reason, also small fields were studied to collect more data for the comparison. In this study, the dose rate of 400 MU/min was used in the measurements for speeding up the irradiation process and minimizing the errors.
2.2.1. Percentage depth dose curves and central axis dose profiles
Percentage depth dose (PDD) curves and profiles were measured in a water phantom (BP2, IBA Blue Phantom 2, IBA Dosimetry GmbH, Schwarzenbruck, Germany) using two identical ionization chambers (IC, IBA CC13, IBA Dosimetry GmbH, Schwarzenbruck, Germany); one for the field measurements in water and one for the reference measurements in air to correct the readout changes caused by the fluctuations in linac output. The main detector was placed in the middle of the field in the water phantom and the reference detector was placed in the air close to the treatment head. The phantom was set up at an SSD of 400 cm defined as a distance from an x-ray source to the plastic front wall of the phantom. The field size of 40.0 x 40.0 cm2 at the SSD of 100 cm and CA 45° were used in the PDD measurements (Figure 1).
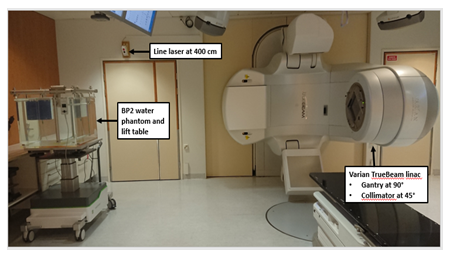
Figure 1: Varian TrueBeam linear accelerator (linac) in a standard clinical total body irradiation (TBI) configuration and IBA Blue Phantom 2 (BP2) set-up at the SSD of 400 cm measured from the x-ray source to the outer side of the phantom plastic wall (SSD: source-to-surface distance).
Because in the BP2 phantom the wall thickness is quite large (1.5 cm), the PDD curves were also measured using solid water slabs (Solid Water HE, Gammex - a Sun Nuclear Company, Middleton, WI, USA) with a density of 1.032 g/cm3. These measurements were performed together with a parallel plate IC (IBA PPC40) to get more precise results close to the depth dose maximum i.e. at the depths of 0.2-10.0 cm.
Additionally, the PDDs were measured with radiophotoluminescence (RPL) dosimeters and calculated with AAA and MC between the depths of 1.5 cm and 30.0 cm. Five RPL dosimeters were used at each depth. The utilized RPL dosimetry system (Dose Ace, AGC Techno Glass Co., Shizuoka, Japan) included cylindrical RPL dosimeters 1.5 mm in diameter and 12.0 mm in length. The effective atomic number of dosimeters is 12.04 and their density is 2.61 g/cm3. The used RPL dosimeter (Dose Ace GD-302M) can be operated at a wide dose range from 10 μGy to 100 Gy, which makes it suitable for various applications. An RPL dosimetry reader (Dose Ace FGD-1000) was used to record the absorbed dose [18].
Central axis dose profiles were measured in the BP2 phantom using two ICs (IBA CC13). Measurements were performed for the field sizes of 2.5 x 2.5 cm2, 5.0 x 5.0 cm2 and 7.5 x 7.5 cm2 at the SSD of 100 cm, corresponding to the projected field sizes of 10.0 x 10.0 cm2, 20.0 x 20.0 cm2 and 30.0 x 30.0 cm2 at the SSD of 400 cm. Inline and crossline profiles were obtained at the depths of 2.0, 10.0 and 20.0 cm using the scanning speed of 0.3 cm/s. Additionally, center area from both diagonal profiles were obtained at the depth of 10.0 cm using the field size of 160.0 x 160.0 cm2 at the SSD of 400 cm with CA 45°.
In the calculation of PDD curves and central axis dose profiles, corresponding geometry was used as a solid water phantom and virtually generated BP2 phantom. All PDD curves were normalized to 77 % the dose at the depth of 10.0 cm, while for the profiles it was done to 100 % the dose at the central axis. The calculated and measured PDDs and profiles were plotted together to analyze any deviations at the extended SSD.
2.2.2. Absolute dose
The absolute dose was measured with a thimble IC (PTW30013, PTW-Freiburg GmbH, Freiburg, Germany) using three different phantoms: 1) In a large water phantom (BP2), the dose was obtained at the depths of 10.0 cm and 20.0 cm defined as a distance from the phantom’s outer wall. 2) In a small water phantom (30 x 30 x 30 cm2), the measurements were performed at the depth of 10.0 cm. 3) To simulate lungs, the doses were obtained in the middle of two 2-cm-thick and two 7-cm-thick polystyrene (0.032 g/cm3) slabs placed between 2- and 3-cm-thick slabs of solid water (1.032 g/cm3) (Figure 2). This phantom was scanned with the Aquilion LB (Toshiba Corp., Tokyo, Japan) CT scanner using 0.5-mm-thick slices, 0.7 x 0.7 mm2 in-plane resolution, and 120 kV tube voltage. Finally, the CT image set was imported to TPS. In all phantoms, the dose of 300 MU was measured four times using a dose rate of 400 MU/min and a projected field size of 10.0 x 10.0 cm2 at the SSD of 400 cm. These measurements were replicated and calculated with the AAA and MC in the identical beam geometry using identical virtually generated water phantoms and a lung phantom based on the set of CT images.
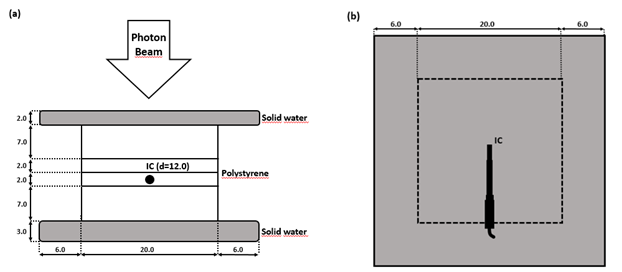
Figure 2: Lung phantom made of two 2-cm-thick and two 7-cm-thick polystyrene slabs placed between 2- and 3-cm-thick solid water slabs. (a): A side view of the dosimetry setup. (b): A top view of the dosimetry setup. Units in figure are cm (IC: ionization chamber, d: depth).
For the sake of accuracy, the measurements were repeated in the small water phantom with the RPL dosimeters in order to define the correction factors for the energy response. The doses were recorded using five RPLs placed to the middle of the field. The results of IC and RPL measurements were used to calculate the correction factors for the RPLs, which take into account the energy response and dose correction. This was done for three different batches of RPL dosimeters to get individual correction factors for each of the batches.
2.2.3. Anthropomorphic phantom
An anthropomorphic phantom (CIRS ATOM Model 701-C Adult Male Dosimetric Phantom, Computerized Imaging Reference Systems, Inc., Norfolk, VA, USA) was used to simulate the TBI treatment (Figure 3). Its anatomical references are height of 173 cm, weight of 73 kg and thorax dimensions of 23 cm x 32 cm. The phantom was scanned with the CT in a head first-decubitus left position (2-mm-thick slices, 1.4 x 1.4 mm2 in-plane resolution, 120 kV tube voltage) and the CT images were imported to the TPS. An RT plan was calculated by following our routine clinical practice for the TBI treatment: two fields (AP and PA) with the field size of 40.0 x 40.0 cm2 (defined at the SSD of 100 cm), a CA 45° and a mean dose of 2.0 Gy per fraction in the whole body volume. The phantom was placed to the center of the treatment field and the SSD of 400 cm was set to the middle of the sternum. Inside the phantom, the 45 RPL dosimeters were placed accordingly: five in the head, five in the neck, four in both lungs, two in the heart and 25 in the stomach and pelvic regions. The same plan was then re-calculated with the MC. Calculated doses with AAA and MC were collected from the positions of RPL dosimeters. In the TPS, the corresponding 45 structures were created and placed accordingly inside the scanned phantom.
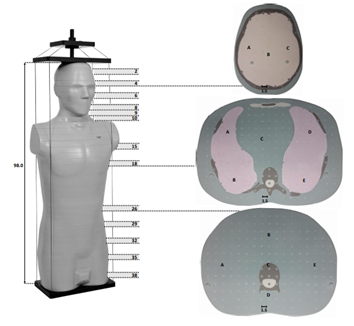
Figure 3: Anthropomorphic phantom ATOM designed for investigating the organ dose and whole body effective dose. The 25-mm-thick cross-sections (2…, 38) used for the measurements are marked, as well as the measurement points (A-E) at the three different cross-sections. Units in figure are cm (brown: bone tissue, grey: soft tissue, light red: lung tissue, yellow: brain tissue).
3. Results
3.1. Percentage depth dose curves and central axis dose profiles
The measured and calculated PDD curves for 160.0 x 160.0 cm2 field size at the SSD of 400 cm are presented in Figure 4 and examples of measured and calculated field profiles are presented in Figure 5. In the selected profiles, the differences between measurements and calculations are largest of all profiles. The measured and calculated diagonal profiles with a CA 45° for 160.0 x 160.0 cm2 field size at 10 cm depth at the SSD of 400 cm are presented in Figure 6. The PDD curves were normalized 77 % the dose at the depth of 10.0 cm and profiles were normalized 100 % the dose at the central axis. The calculated PDD curves differ 2 % or less from the measured ones at the depths of 30.0 cm or less.
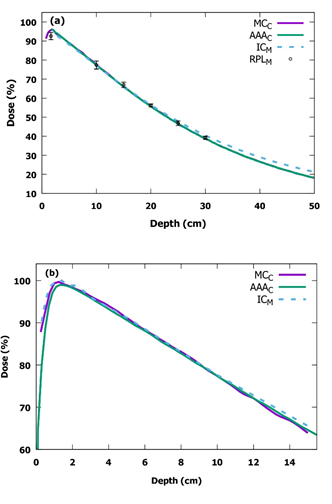
Figure 4: Measured (M) and calculated (C) PDD curves for 160.0 x 160.0 cm2 field size at the SSD of 400 cm in (a) the IBA Blue Phantom 2 water phantom and in (b) the solid water phantom. Note, there is a different scale in the vertical and the horizontal axes in (a) and (b) (PDD: percentage depth dose, SSD: source-to-surface distance, IC: ionization chamber, MC: Monte Carlo, AAA: analytical anisotropic algorithm, RPL: radiophotoluminescence).
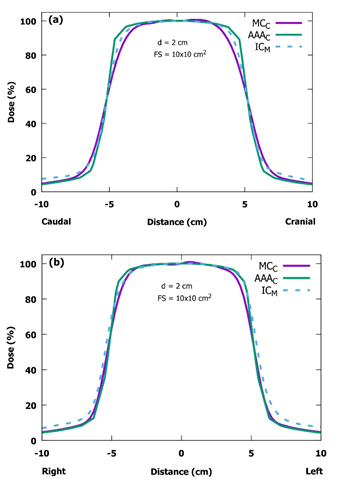
Figure 5: Measured (M) and calculated (C) inline (a) and crossline (b) beam profiles for the projected field size of 10.0 x 10.0 cm2 at the depth of 2.0 cm at the SSD of 400 cm in the IBA Blue Phantom 2 water phantom. In the selected profiles, the differences between measurements and calculations are greater than in the other profiles. The patient would be lying on her/his left side and this would be the AP field (SSD: source-to-surface distance, IC: ionization chamber, MC: Monte Carlo, AAA: analytical anisotropic algorithm, d: depth, FS: field size).
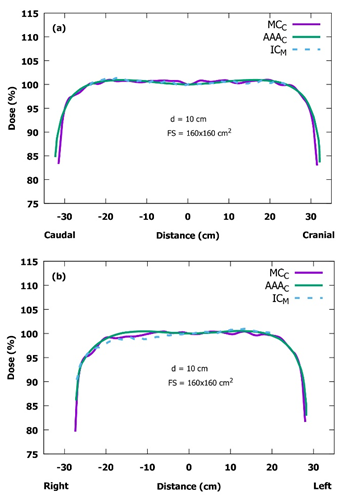
Figure 6: Measured (M) and calculated (C) diagonal profiles for 160.0 x 160.0 cm2 field size at the SSD of 400 cm with the collimator rotation angle of 45° and at the depth of 10 cm. (a) the vertical (top-down) diagonal profile. (b) the horizontal (left-right) diagonal profile. Note the modified scaling in the vertical axes (SSD: source-to-surface distance, IC: ionization chamber, MC: Monte Carlo, AAA: analytical anisotropic algorithm, d: depth, FS: field size).
3.2. Absolute dose
Table 1 shows the results of the absolute dose measurements and calculations in two different water phantoms, as well as in a lung phantom. The statistical uncertainty in all MC simulations was 0.3 %. The results show that the AAA- and MC-calculated absolute doses in water are close to the measured ones, overestimating the doses by up to 1.8 % and 2.2 %, respectively. Contrary to that in the lung phantom, the corresponding differences are up to 7.0 % and 3.3 % for the AAA and MC calculations, respectively.
|
Measured |
AAA |
MC |
Diff, AAA |
Diff, MC |
|
|
(cGy) |
(cGy) |
(cGy) |
(%) |
(%) |
|
|
Blue Phantom 2 (10 cm depth) |
1.31 |
1.31 |
1.31 |
0.4 |
0.4 |
|
Blue Phantom 2 (20 cm depth) |
0.84 |
0.83 |
0.84 |
0.8 |
0.3 |
|
Water phantom (10 cm depth) |
1.29 |
1.31 |
1.32 |
1.8 |
2.2 |
|
Lung phantom |
1.09 |
1.18 |
1.06 |
7 |
3.3 |
Table 1: IC-measured and AAA- and MC-calculated absolute doses using the field size of 10 x 10 cm2 at the SSD of 400 cm in the IBA Blue Phantom 2, 30 x 30 x 30 cm3 water phantom and lung phantom (SSD: source-to-surface distance, AAA: analytical anisotropic algorithm, MC: Monte Carlo, IC: ionization chamber).
3.3. Anthropomorphic phantom
Table 2 shows the results of the point dose measurements and calculations in the anthropomorphic phantom and Figure 7 shows AAA and MC dose distributions in the whole body and lung area. The measured doses were corrected with the energy response correction factors deduced from the absolute dose measurements. The results are presented as mean (standard deviation, SD) doses for several measurement points of the same region. The results show that the measured and MC-calculated doses are in good agreement, the maximum difference of 2.1 % being in the right lung, while for the whole body volume it is only 1.0 % in average. In contrast to the MC calculation, the AAA calculation overestimates the mean dose of whole body volume by 6.2 % in comparison to the measured dose. For the smaller body volumes, the differences can be even larger, up to 8.3 % observed in the head.
|
Measured |
AAA |
MC |
Diff, AAA |
Diff, MC |
|
|
(Gy) |
(Gy) |
(Gy) |
(%) |
(%) |
|
|
Head |
1.76 (0.02) |
1.92 (0.03) |
1.76 (0.02) |
8.3 |
0 |
|
Neck |
1.97 (0.10) |
2.13 (0.07) |
2.00 (0.10) |
7.8 |
1.5 |
|
Right lung |
2.09 (0.07) |
2.14 (0.02) |
2.13 (0.02) |
2.6 |
2.1 |
|
Left lung |
2.12 (0.10) |
2.15 (0.02) |
2.14 (0.04) |
1.4 |
1.2 |
|
Mediastinum |
1.72 (0.01) |
1.87 (0.02) |
1.73 (0.01) |
8.1 |
1 |
|
Pelvis |
1.88 (0.10) |
2.00 (0.07) |
1.90 (0.10) |
6.4 |
0.8 |
|
Whole body |
1.91 (0.14) |
2.03 (0.03) |
1.93 (0.15) |
6.2 |
1 |
Table 2: RPL- measured and AAA- and MC-calculated mean doses using the field size of 160 x 160 cm2 at the SSD of 400 cm in the anthropomorphic phantom. The standard deviations (SD) are in parenthesis (RPL: radiophotoluminescence, AAA: analytical anisotropic algorithm, MC: Monte Carlo, SSD: source-to-surface distance).
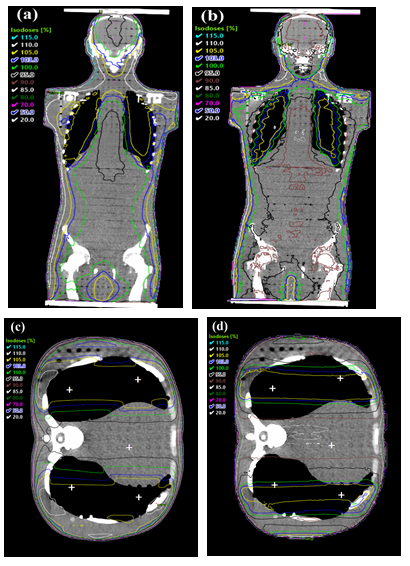
Figure 7: Dose distribution of AAA and MC in the whole body and lung area. (a) Dose in a whole body calculated with AAA. (b) Dose in a whole body calculated with MC. (c) Dose in a lung area calculated with AAA. RPL measurement points are marked with white crosses (d) Dose in a lung area calculated with MC (MC: Monte Carlo, AAA: analytical anisotropic algorithm, RPL: radiophotoluminescence).
4. Discussion
In this study, we evaluated the applicability of the Varian Eclipse’s AAA version 15.6.04 for TBI treatments at the extended SSD of 400 cm. Several studies have investigated the accuracy of TPSs, but only a few of those have utilized Eclipse’s AAA calculation. Lamichhane et al. [5] validated both AAA 11.0.47 and Acuros 11.0.47 at the extended SSD of 400 cm and they concluded that AAA’s relative dose distribution agreed well with the measurements. However, the deviation in absolute dose exceeded by up to 10 % and therefore, it was not recommended for the TBI calculation. Hussain et al. [6] validated AAA 8.6.15 at the extended SSD of 179.5 cm. Their conclusion was that the AAA’s prediction of the dose distributions in water is accurate, the largest overestimation of dose being 4.9 % in the chest region. In addition, Lamichhane et al. [7] evaluated AAA and Acuros algorithms in Eclipse 15.6.04 to calculate the doses in the lungs shielded with blocks. They concluded that the AAA and Acuros calculation should be used with caution, as assistance with the clinical decision-making. Moreover, the AAA was able to provide good absolute dose agreement, when the relative electron density was optimized. Tyson et al. [8] evaluated field-in-field technique using AAA 10.0.28 and stated it to be more accurate than the current conventional TBI calculation methods. To our knowledge, this is the first time the EGSnrc MC methods are used to evaluate the accuracy of AAA (version 15.6.04) calculation in the TBI treatments at the SSD of 400 cm.
In general, both PDD curves and central axis dose profiles were clinically acceptable. All calculated and measured PDD curves were in good agreement for the first 30.0 cm in depth, whereas at larger depths the calculated curves began to deviate slightly from the measured ones. This deviation has only a small effect on the TBI treatments, if the patients are treated using the AP/PA technique. Naturally, the effect becomes more important with obese patients thicker than 40 cm in the direction of x-ray beam propagation. The dose profiles, both measured and MC-calculated ones, are almost identical in the inline axis, and also AAA-calculated profiles differ only slightly from them. The largest discrepancy in all profiles is in the crossline axis in the region of the field edge. The measured crossline profiles are more gently curved in top of the field edge (the left side in Figure 5b). The difference seems to be largest with the smallest field size of 10.0 x 10.0 cm2 that is probably due to mechanical inaccuracy of the jaw positions. In comparison to the SSD of 100 cm in the standard conditions, all the mechanical inaccuracies are multiplied by four when the SSD of 400 cm is used. This same effect can be noticed also in the MC calculation where one has to manually input the coordinates of the jaw edges to move jaws in certain positions. The difference can be partly due to the slightly different energy spectrum at extended SSDs. In practice, however, this has no clinical significance due to the large field size of 40.0 x 40.0 cm2 used in the TBI treatment. The AAA-calculated crossline profiles are in good agreement, when compared with those from the measurements. The diagonal profiles calculated and measured in the BP2 phantom are in relatively good agreement. The physical size of the BP2 phantom limits the extent of measured profiles. There can be seen a tilt in the measured diagonal profile (Figure 7b). It is located on the top side of the phantom. The tilt is probably due to differences in the scattering materials (air vs. lift table). The discrepancies in the profiles between the MC calculation and the measurements can be due to differences in the TrueBeam and the manufacturer’s MC input file, describing the initial electron beam hitting the X-ray target and treatment head geometry above the jaws, which was used to generate the phase-space files. The PDD and beam profile results are consistent with those presented by Lamichhane et al. [5], where they have normalized their PDDs to the dose maximum and concluded that the AAA underestimates doses. Our results suggest that the AAA underestimates the dose at larger depths than 30 cm, while both of these studies indicate that the photon energy of AAA was lower than the actual one. The differences between these studies can be due to different versions of the Eclipse.
All calculated and measured absolute dose results in water are almost identical, most of the differences being less than 1.0 %. The largest observed difference was 1.8 % for both calculations compared with measurements, when the small water phantom was used. In comparison to the measured results, the AAA- and MC-calculated results in lung phantom differed by 7.0 % and 3.3 %, respectively. Such a large difference is probably due to the fact that in the AAA calculation the results are based on dose-to-water approach, while in the MC calculation and measurements results are based on dose-to-medium approach. The observed deviations are not as large as Lamichhane et al. [5] observed (27.6 %) that is probably due to different calculation methods. They observed the largest deviations, when they calculated doses in the CT-scanned phantoms containing the IC. This method was abandoned in this study because of the calibration of the used IC. Our results suggest that the AAA calculation can handle quite well the small-field dose calculations at the extended SSD of 400 cm that would be important for the use of field-in-field technique in the TBI treatment planning. These results are equivalent with the results by Tyson et al. [8]. When the described dose is more than 10 Gy, the field-in-field technique could be used for shielding the critical organs, such as lungs. However, for the implementation of more sophisticated methods such as field-in-field approach to the TBI treatments, additional work is still needed.
When comparing the results achieved in the anthropomorphic phantom, we noticed that the AAA calculation overestimates the mean dose of whole body volume by about 6 % compared with the measurements, the largest difference being 8.3 % in the head. The difference between AAA and MC can be observed also in Figure 7. Somewhat surprisingly in the lungs, both AAA and MC calculations have almost identical results and in comparison to the measurements, the largest differences of 2.6 % and 2.1 %, respectively, are observed in the right lung. Our results cannot be compared directly with those by Lamichhane et al. [5] because of the way they used the radiochromic film. In the end, however, they came to a conclusion that the dose distribution is good that is in line with our results. TPSs may introduce minor systematic errors in the calculations at an extended SSD, but they are most likely more accurate than the commonly used traditional calculations that they could replace.
5. Conclusions
In conclusion, our data indicate that an AAA calculation is a feasible and quite accurate way to perform clinical TBI treatment planning at the extended SSD of 400 cm. The calculated and measured PDD curves were in good agreement at the depths of 30.0 cm or less. Also, the central axis dose profiles were clinically acceptable, having the largest uncertainties close the field edges. One needs, however, to pay attention to these issues in particular, if obese patients are going to be treated. The AAA calculation functioned well with the small field sizes, while with the large field sizes it overestimated the mean dose by 6.2 % in the whole body volume. These results suggest that in order to achieve a higher level of accuracy in the TBI planning, one must carefully validate the TPS at extended SSDs.
Conflict of interest
No conflicts of interest.
Acknowledgments
The authors want to thank the radiographers Anita Kaijanen and Anna Nieminen for their kind help in radiological examinations at the Department of Oncology and Radiotherapy of Turku University Hospital (Turku, Finland).
Funding
This work was supported by the Division of Imaging of Turku University Hospital [grant number 14607] and the State Research Funding of Finland [grant number K3009]. The funding had no role in: study design; in the collection, analysis and interpretation of data; in the writing of the report; nor in the decision to submit the article for publication.
References
- Wong JYC, Filippi AR, Dabaja BS, et al. Total Body Irradiation: Guidelines from the International Lymphoma Radiation Oncology Group (ILROG). Int J Radiat Oncol Biol Phys 101 (2018): 521-529.
- Khan FM, Gibbons JP. The Physics of Radiation Therapy. 5th ed. Philadelphia: Lippincott Williams & Wilkins (2014).
- Pierce G, Balogh A, Frederick R, et al. Extended SSD VMAT treatment for total body irradiation. J Appl Clin Med Phys 20 (2019): 200-211.
- Jahnke A, Jahnke L, Molina-Duran F, et al. Arc therapy for total body irradiation – A robust novel treatment technique for standard treatment rooms. Radiother Oncol 110 (2014): 553-537.
- Lamichhane N, Patel VN, Studenski MT. Going the distance: validation of Acuros and AAA at an extended SSD of 400 cm. J Appl Clin Med Phys 17 (2016): 63-73.
- Hussain A, Villarreal-Barajas E, Brown D, et al. Validation of the Eclipse AAA algorithm at extended SSD. J Appl Clin Med Phys 11 (2010): 90-100.
- Lamichhane N, Studenski MT. Improving TBI lung dose calculations: Can the treatment planning system help? Med Dosim 45 (2019): 168-171.
- Tyson TE, Podgorsak MB, Singh AK, et al. Improved dose homogeneity using electronic compensation technique for total body irradiation. J Appl Clin Med Phys 19 (2018): 159-167.
- Taylor ML, Kron T, Franich RD. A contemporary review of stereotactic radiotherapy: Inherent dosimetric complexities and the potential for detriment. Acta Oncol (Madr) 50 (2011): 483-508.
- Chetty IJ, Curran B, Cygler JE, et al. Report of the AAPM Task Group No. 105: Issues associated with clinical implementation of Monte Carlo-based photon and electron external beam treatment planning. Med Phys 34 (2007): 4818-4853.
- Chakarova R, Krantz M. A Monte Carlo evaluation of beam characteristics for total body irradiation at extended treatment distances. J Appl Clin Med Phys 15 (2014): 4708.
- Serban M, Seuntjens J, Roussin E, et al. Patient-specific compensation for Co-60 TBI treatments based on Monte Carlo design: A feasibility study. Phys Medica 32 (2016): 67-75.
- Kawrakow I, Mainegra-Hing E, Rogers DWO, et al. The EGSnrc Code System: Monte Carlo Simulation of Electron and Photon Transport, NRCC Report PIRS-701. Natl Res Counc Canada (2019): 2001-219.
- Popescu IA, Shaw CP, Zavgorodni SF, et al. Absolute dose calculations for Monte Carlo simulations of radiotherapy beams. Phys Med Biol 50 (2005): 3375-3392.
- Zavgorodni S, Alhakeem E, Townson R. Monitor backscatter factors for the Varian 21EX and TrueBeam linear accelerators: Measurements and Monte Carlo modelling. Phys Med Biol 59 (2014): 911-924.
- Partanen M, Ojala J, Niemela J, et al. Comparison of two Monte Carlo-based codes for small-field dose calculations in external beam radiotherapy. Acta Oncol 56 (2017): 891-893.
- Eclipse Photon and Electron Algorithms 15.5. Reference Guide (2017).
- Saikkonen A, Niemela J, Sipila P, et al. Commissioning of the MultiRad 350 cell and small animal x-ray irradiation system. Phys Medica 59 (2019): 107-111.
