A New Invasive Method of Continuously Monitoring Myocardial Ischemia in Interventional Cardiology – Electrocardiography from the Coronary Sinus
Article Information
Yury L. Shevchenko*, Dmitry Y. Ermakov
St. George Clinic of Thoracic and Cardiovascular Surgery, Pirogov National Medical & Surgical Center, Russian Federation
*Corresponding Author: Yury L. Shevchenko, Academician of RAS, St. George Clinic of Thoracic and Cardiovascular Surgery, Pirogov National Medical & Surgical Center, Russian Federation
Received: 14 May 2020; Accepted: 26 May 2020; Published: 29 May 2020
Citation: Yury L. Shevchenko, Dmitry Y. Ermakov. A New Invasive Method of Continuously Monitoring Myocardial Ischemia in Interventional Cardiology – Electrocardiography from the Coronary Sinus. Cardiology and Cardiovascular Medicine 4 (2020): 191-202.
Share at FacebookAbstract
Background
The aim of this work is to assess the ability to control myocardial ischemia (MyI) using a method of unified Electrocardiography from the coronary sinus (ECGCS).
Materials and methods
This study included 88 patients with single-vessel lesions of different coronary arteries (CA) who had a 10-channel EE installed into their coronary sinus (CS) during percutaneous coronary intervention (PCI). Ischemia was monitored by an electrophysiological recording system (EPRS) with the following settings: electrode consolidation into five cathode-anode pairs with a frequency range of 30–500 Hz, a cutoff of 1-cm signal, and an amplitude of 0.3 mV/cm. ROC analysis determined the method sensitivity and specificity for different cut-off points.
Results
According to ECG-CS, at maximum ischemic exposure (during stent implantation), the average ST segment deviations from the isoline were: with ADA intervention – depression in CS leads 1-2 – 0.12±0.03 mV, CS 3-4 – 0.1±0.02 mV; elevation – 0.14±0.04 mV and 0.11±0.02 mV, respectively; LCX – ST depression in CS leads 3-4 – 0.11±0.02 mV, CS 5-6 – 0.11±0.02 mV; elevation – 0.12±0.02 mV and 0.15±0.03 mV, respectively; RCA – ST depression in CS leads 7-8 – 0.1±0.01 mV, CS 9-10 – 0.12±0.02 mV; elevation – 0.13±0.02 mV, and 0.14±0.03 mV, respectively. The ECG-CS method sensitivity according to ROC analysis in the case of ST depression was 79.5%, specificity 100%; for ST elevation – 83% and 100%, respectively.
Conclusion
ECG-CS is an effective, highly informative and promising new method of invasive MyI control in interventional cardiology.
Keywords
ECG from coronary sinus; Coronary heart disease; Percutaneous coronary intervention; Monitoring myocardial ischemia
ECG from coronary sinus articles, Coronary heart disease articles, Percutaneous coronary intervention articles, Monitoring myocardial ischemia articles
Article Details
Abbreviations:
American College of Cardiology (ACC), American Heart Association (AHA), Anterior descending artery (ADA), Left circumflex artery (LCX), Right coronary artery (RCA), Russian Academy of Sciences (RAS).
Introduction
Cardiovascular diseases (CVD) are a significant medical and societal problem due to the high disability and mortality rate those who suffer from them face. Among cardiovascular diseases, coronary heart disease (CHD), the most common manifestation of which is stable angina pectoris, has particularly high incidence in the Russian Federation (RF). In Russia, almost 10 million people of working age suffer from CHD, and more than a third of them have angina pectoris [5, 10].
In most Western countries, including Russia, 75–80% of coronary artery revascularization procedures are performed by interventional cardiologists [5]. An increase in the number of interventions for obliterating atherosclerosis of coronary arteries creates a vector for both further developing existing and introducing new invasive methods that detect myocardial ischemia [10].
With the development of interventional cardiology (IC), the accurate determination of the location and extent of myocardial ischemia in different blood supply zones (BSZ) of CA becomes an extremely important component of percutaneous coronary intervention. Currently, ECG monitoring in patients with CHD during cardiovascular interventions (CI) in the coronary arteries is a pressing issue for interventional cardiologists. Under X-ray operating room conditions, considering the lack of possibility to apply electrodes of the chest leads because they impede visualization during fluoroscopy, existing ECG registration methods do not allow for the full assessment of the degree of myocardial ischemia [9, 10].
A promising solution to this problem was the introduction of the intracardiac electrocardiography method to interventional cardiology. According to theoretical and experimental models of the cardioelectric field, the formation of systolic and diastolic currents of myocardial damage during ischemia causes four possible types of potential distribution: the resting potential (RP) of the ischemic region is less (in absolute value) than the RP of the region with normal perfusion – hypopolarization; the resting potential of the damaged area is higher (in absolute value) than the RP of the normal perfusion region – hyperpolarization; the action potential (AP) of the pathological region is less than the AP of a healthy region – hypodepolarization; the AP of a damaged area is higher than the AP of a healthy area – hyperdepolarization. In this case, synergy between the first and third types of action potential displacement is possible [1, 3, 4, 7].
The installation of EE into the coronary sinus makes it possible to detect the potential difference on the cathode-anode pairs of the electrode at the moment of reduction of coronary perfusion, which is expressed in intracardiac leads of the ECG as the displacement of the ST-segment relative to the isoline. Moreover, the displacement amplitude correlates with the degree of ischemia, and the displacement direction (depression or elevation) correlates with the localization of the ischemic focus and the charge of the damaged area.
In 2019, at Pirogov National Medical & Surgical Center (Russian Federation, Moscow), RAS Academician and Professor Yury L. Shevchenko proposed, developed and demonstrated a method of electrocardiography from the coronary sinus using an electrophysiological recording system to continuously monitor MyI during endovascular coronary interventions [9, 10]. The aim of the study was to assess the capabilities of the method during endovascular coronary interventions.
Materials and methods
Study population
The prospective study included 88 (100 %) patients with stable CHD with a single-vessel lesion of CA who had PCI procedures planned at Pirogov National Medical & Surgical Center between 2018 and early 2020.
Inclusion criteria: presence of CHD, age from 18 to 70 years, endovascular coronary interventions, hemodynamically significant damage to one coronary artery.
Exclusion criteria: unstable angina pectoris; primary rhythm and conductivity disorders; III-IV degree mitral insufficiency; impaired renal function (creatinine level > 200 μmol/l); contraindications for standard antiplatelet therapy; history of CABG; occlusive lesion of CA.
All patients were divided into three groups: group I included 32 (36.4%) patients with lesions of the anterior descending artery (ADA), group II – 27 (30.6%) CHD patients with circumflex artery (CX) lesions, and group III – 21 (33%) patients with lesions of the right coronary artery (RCA).
Standard functional intraoperative monitoring of the patient's condition
A routine PCI was performed according to the standard technique with constant ECG monitoring in 3 standard and 3 augment limb leads, pulse oximetry and indirect measurement of blood pressure with an interval of 5–10 minutes using a multiparameter configured Datex-Ohmeda Cardiocap/5 (GE) monitor.
ECG from the coronary sinus
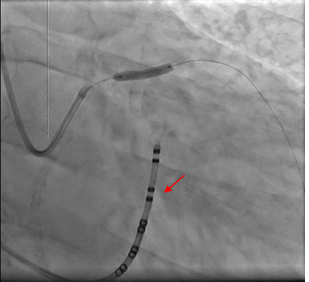
To carry out invasive intraoperative monitoring of myocardial ischemia in our study, we used the WorkMate electrophysiological recording system (St. Jude Medical). Coronary sinus catheterization was performed through the subclavian vein with insertion of 7F introducer. Under X-ray control, an endocardial 10-channel CS electrode was installed into the coronary sinus in the left oblique projection. To obtain accurate diagnostic results about myocardial ischemia, we used the bipolar EPRS mode with the following settings: consolidation of electrodes into five cathode-anode pairs with a frequency range of 30-500 Hz, a cutoff of a 1-cm signal, and an amplitude of 0.3 mV/cm. Digital analysis of the obtained data was carried out using the EP WorkMate Recording System v.4.3.2 computer program.
Statistics
Statistical processing of the material provided for the obtainment of cross tabulation, charts, graphs and analytical indicators of the structure (p), mean values (M) and standard deviations (±sd). Quantitative variables were described by the following statistics: number of patients, arithmetic mean value (M), standard deviation from the arithmetic mean value (δ), 25th and 75th percentiles, median. The differences were considered statistically significant at an error level p < 0.05; a 'p' value less than or equal to a given level indicates the statistical significance of the result. ROC-analysis was performed to determine the sensitivity and specificity of the method for different cut-off points.
Results
All 88 (100%) patients were diagnosed with CHD on the basis of a clinical examination with analysis of complaints, past medical history, objective research methods and stress test performance.
According to the clinical and anamnestic data, the patients of the three groups did not differ significantly (Table 1).
|
Criterion |
Number of patients |
|
|
Number of patients |
88 (100%) |
|
|
Men |
68 (77.3%) |
|
|
Women |
20 (22.7%) |
|
|
Average age |
57.4±2.1 |
|
|
FC |
I |
0 |
|
II |
53 (60.2%) |
|
|
III |
35 (39.8%) |
|
|
IV |
0 |
|
|
Arterial hypertension |
58 (65.9%) |
|
|
Diabetes mellitus |
13 (14.8%) |
|
|
History of ischemic stroke |
2 (2.3%) |
|
|
Hyperlipidemia |
54 (61.4%) |
|
|
Obesity |
47 (53.4%) |
|
|
Smoking |
41 (46.6%) |
|
Table 1: Preoperative characteristics of patients according to clinical and anamnestic data
The right type of coronary blood supply was prevailing – 73 (82.9%). The degree of stenosis and its extent were 81 ± 10.3% and 8.9 ± 3.3 mm, respectively. In each group, according to the ACC/AHA classification, the prevailing types of lesions were B1 and B2, with 29 (32.9%) and 38 (43.2%) respective occurrences; type A occurred in 10 patients (11.4%), as did type C (11.4%). Angiographic characteristics of the patients are presented in Table 2.
|
Parameter |
Amount |
||
|
Number of patients |
88 (100%) |
||
|
Type of myocardial blood supply, n (%) |
Right |
73 (82.9%) |
|
|
Left |
9 (10.2%) |
||
|
Balanced |
6 (6.9%) |
||
|
Affected arterial territory |
ADA |
32 (36.4%) |
|
|
LCX |
27 (30.6%) |
||
|
RCA |
29 (33%) |
||
|
The degree of stenosis, % |
81±10.3 |
||
|
The extent of the lesion, mm |
8.9±3.3 |
||
|
The proper diameter of the artery, % |
3.1±0.4 |
||
|
Lesion types according to ACC/ANA |
Type A |
10 (11.4%) |
|
|
Type B1 |
29 (32.9%) |
||
|
Type B2 |
38 (43.2%) |
||
|
Type C |
11 (12.5%) |
||
|
SYNTAX Score I |
ADA |
8.34±1.58 |
|
|
LCX |
4.87±1.91 |
||
|
RCA |
2.76±0.71 |
||
Table 2: Angiographic characteristics of patients
Reliable criteria for ischemia by ECG-CS were considered to be changes in the ST-segment in 2 adjacent leads above 0.1 mV. Immediately after the electrode was inserted into the coronary sinus, yet before the introduction of the instruments into the coronary bed, no ischemic changes were detected in patients in any of the 3 groups (p = NS).
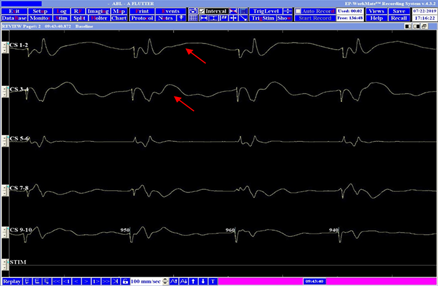
Prior to stent placement, 18 (56%) patients from group I had predilation of the CA stenosis zone with a balloon catheter. During balloon inflation of ADA, ischemic changes (p < 0.05) were recorded on the ECG with an endocardial electrode. ST depression was recorded in CS leads 1-2 and averaged 0.09 ± 0.02 mV, in CS 3-4: 0.09±0.05 mV. ST elevation was registered in CS leads 1-2 – 0.1 ± 0.04 mV, CS 3-4 – 0.1 ± 0.05 mV (Figures 1–2). Body-surface ECG did not reveal significant myocardial ischemia.
|
Rest |
Balloon inflation |
Stent placement |
At the end of the intervention |
|||||
|
(mV) |
depression |
elevation |
depression |
elevation |
depression |
elevation |
depression |
elevation |
|
Body-surface ECG |
||||||||
|
I |
0.04±0.02 |
0.07±0.03* |
0.06±0.05* |
0.1±0.01* |
0.09±0.03* |
0.08±0.01 |
0.04±0.01 |
|
|
II |
0.03±0.01 |
0.06±0.03 |
0.04±0.02 |
0.08±0.01 |
0.07±0.01 |
0.06±0.03 |
||
|
III |
0.03±0.01 |
0.03±0.01 |
0.05±0.04 |
0.03±0.01 |
0.06±0.01 |
0.03±0.01 |
0.04±0.01 |
|
|
aVR |
0.02±0.01 |
0.01±0.01 |
0.06±0.01 |
0.02±0.01 |
||||
|
aVL |
0.04±0.01 |
0.05±0.01 |
0.03±0.01 |
0.08±0.01 |
0.05±0.04 |
0.05±0.04 |
||
|
aVF |
0.02±0.01 |
0.02±0.01 |
0.03±0.01 |
0.02±0.01 |
0.06±0.03 |
0.02±0.01 |
||
|
Intracardiac ECG |
||||||||
|
CS 1-2 |
0.04±0.01 |
0.05±0.02 |
0.09±0.02* |
0.1±0.04* |
0.12±0.03* |
0.14±0.04* |
0.05±0.03 |
0.03±0.01 |
|
CS 3-4 |
0.07±0.02 |
0.07±0.02 |
0.09±0.05* |
0.1±0.05* |
0.1±0.02* |
0.11±0.02* |
0.06±0.03 |
0.04±0.02 |
|
CS 5-6 |
0.06±0.01 |
0.08±0.01 |
0.05±0.02 |
0.07±0.03 |
0.06±0.01 |
0.05±0.03 |
0.03±0.03 |
0.03±0.01 |
|
CS 7-8 |
0.03±0.01 |
0.04±0.01 |
0.05±0.02 |
0.05±0.01 |
0.06±0.02 |
0.06±0.02 |
0.06±0.01 |
0.03±0.03 |
|
CS9-10 |
0.05±0.01 |
0.03±0.01 |
0.07±0.01 |
0.05±0.01 |
0.05±0.02 |
0.06±0.03 |
0.05±0.02 |
0.05±0.03 |
* - p<0.05
Table 3: Ischemic dynamics of ST segment during interventions in ADA
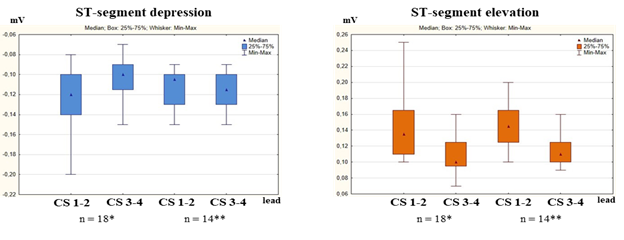
During stenting of ADA, in its standard leads ECG-CS revealed a significant (p < 0.05) ST depression in CS leads 1-2 (0.12 ± 0.03 mV), CS 3-4 (0.1 ± 0.02 mV); elevation: 0.14±0.04 mV and 0.11±0.02 mV, respectively (Figure 3).
(*after balloon occlusion, **after direct stenting).
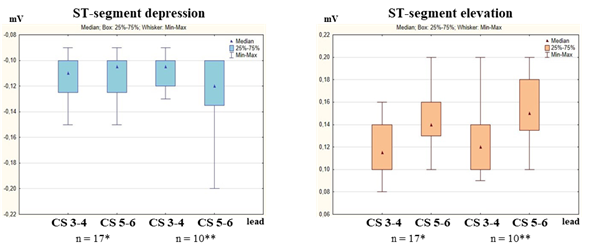
In group II, the predilation of the stenosis zone was performed in 17 (63%) patients. With intervention into the LCX territory (Figure 4) during balloon inflation, there were ischemic changes (p < 0.05) recorded on ECG-CS. ST depression was recorded in CS leads 3-4 – 0.08 ± 0.03 mV, and in CS 5-6 – 0.09 ± 0.04 mV. ST elevation was registered in the same leads and averaged 0.1 ± 0.04 mV, 0.12 ± 0.05mV. Body-surface ECG did not reveal significant myocardial ischemia.
(*after balloon occlusion, **after direct stenting).
During stenting of LCX, no diagnostic criteria were identified in standard leads. Intracardiac ECG revealed ST depression in CS leads 3-4 – 0.11 ± 0.02 mV, in CS 5-6 – 0.11 ± 0.02 mV; elevation – 0.12 ± 0.02 mV and 0.15 ± 0.03 mV (p < 0.05), respectively.
|
Rest |
Balloon inflation |
Stent placement |
At the end of the intervention |
||||||
|
(mV) |
depression |
elevation |
depression |
elevation |
depression |
elevation |
elevation |
depression |
|
|
Body-surface ECG |
|||||||||
|
I |
0.02±0.01 |
0.01±0.01 |
0.07±0.02 |
0.06±0.03 |
0.05±0.02 |
0.03±0.01 |
0.03±0.01 |
0.03±0.02 |
|
|
II |
0.03±0.01 |
0.04±0.01 |
0.04±0.01 |
0.03±0.01 |
0.04±0.02 |
0.04±0.02 |
|||
|
III |
0.02±0.01 |
0.03±0.02 |
0.02±0.01 |
0.02±0.01 |
0.04±0.02 |
0.04±0.02 |
|||
|
aVR |
0.03±0.02 |
0.04±0.01 |
0.05±0.02 |
0.05±0.03 |
0.03±0.01 |
0.03±0.01 |
|||
|
aVL |
0.03±0.01 |
0.04±0.01 |
0.07±0.03* |
0.07±0.02 |
0.06±0.03 |
0.07±0.02 |
0.04±0.02 |
0.03±0.01 |
|
|
aVF |
0.02±0.01 |
0.03±0.01 |
0.04±0.01 |
0.03±0.01 |
0.03±0.01 |
0.03±0.01 |
|||
|
Intracardiac ECG |
|||||||||
|
CS 1-2 |
0.04±0.02 |
0.04±0.01 |
0.04±0.02 |
0.03±0.01 |
0.04±0.02 |
0.04±0.03 |
0.04±0.01 |
0.05±0.01 |
|
|
CS 3-4 |
0.05±0.03 |
0.05±0.02 |
0.08±0.03* |
0.1±0.04* |
0.11±0.02* |
0.12±0.02* |
0.03±0.03 |
0.06±0.01 |
|
|
CS 5-6 |
0.03±0.01 |
0.03±0.01 |
0.09±0.04* |
0.12±0.05* |
0.11±0.02* |
0.15±0.03* |
0.05±0.03 |
0.07±0.01 |
|
|
CS 7-8 |
0.04±0.01 |
0.03±0.01 |
0.03±0.01 |
0.05±0.03 |
0.04±0.01 |
0.04±0.01 |
0.03±0.01 |
0.03±0.02 |
|
|
CS 9-10 |
0.03±0.01 |
0.03±0.01 |
0.04±0.01 |
0.04±0.02 |
0.03±0.01 |
0.04±0.01 |
0.02±0.01 |
0.04±0.02 |
|
* - p<0.05
Table 4: Ischemic dynamics of ST segment during interventions in LCX
In 15 cases (52%) before stent placement, patients from group III had stenosis zone predilation. At the time of balloon inflation during intervention in the RCA territory, there were ischemic changes (p < 0.05) recorded on ECG-CS. ST depression was recorded in CS leads 7-8 and averaged 0.09 ± 0.04 mV, and in CS 9-10 – 0.14 ± 0.05 mV. ST elevation was registered in the same leads: 0.12 ± 0.03 mV, and 0.12 ± 0.05 mV, respectively. Body-surface ECG did not reveal significant myocardial ischemia (p > 0.05).
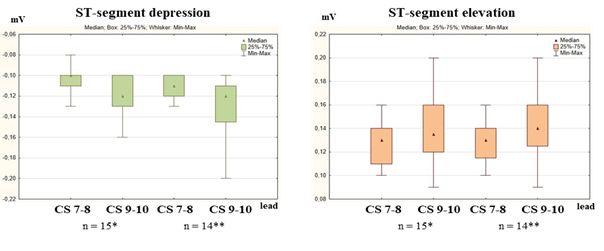
During stenting of the RCA, the changes in standard leads were nonspecific. Intracardial ECG revealed ST depression in CS leads 7-8 – 0.1 ± 0.01 mV, and CS 9-10 – 0.12 ± 0.02 mV; elevation in CS 7-8 – 0.13 ± 0.02 mV, and in CS 9-10 – 0.14 ± 0.03 mV (p < 0.05), respectively (Figure 5).
(*after balloon occlusion, **after direct stenting).
|
Rest |
Balloon inflation |
Stent placement |
At the end of the intervention |
|||||
|
(mV) |
depression |
elevation |
depression |
elevation |
depression |
elevation |
elevation |
depression |
|
Body-surface ECG |
||||||||
|
I |
0.02±0.01 |
0.04±0.01 |
0.04±0.02 |
0.03±0.02 |
0.03±0.01 |
0.04±0.03 |
0.04±0.02 |
|
|
II |
0.05±0.01 |
0.06±0.03 |
0.05±0.02 |
0.04±0.02 |
0.05±0.02 |
0.03±0.01 |
0.04±0.01 |
|
|
III |
0.04±0.03 |
0.06±0.04* |
0.05±0.04 |
0.07±0.01 |
0.09±0.01* |
0.05±0.02 |
0.03±0.01 |
|
|
aVR |
0.04±0.01 |
0.03±0.01 |
0.04±0.01 |
0.04±0.02 |
0.03±0.01 |
0.04±0.01 |
||
|
aVL |
0.05±0.01 |
0.04±0.01 |
0.04±0.01 |
0.03±0.01 |
0.04±0.01 |
0.03±0.02 |
||
|
aVF |
0.02±0.01 |
0.04±0.01 |
0.04±0.02 |
0.07±0.01 |
0.06±0.03 |
0.06±0.03 |
0.04±0.01 |
|
|
Intracardiac ECG |
||||||||
|
CS 1-2 |
0.04±0.02 |
0.03±0.01 |
0.06±0.02 |
0.05±0.01 |
0.05±0.02 |
0.04±0.02 |
0.04±0.03 |
0.03±0.01 |
|
CS 3-4 |
0.05±0.01 |
0.04±0.01 |
0.07±0.01 |
0.04±0.01 |
0.03±0.02 |
0.02±0.02 |
0.05±0.03 |
0.05±0.01 |
|
CS 5-6 |
0.06±0.02 |
0.05±0.02 |
0.05±0.03 |
0.03±0.01 |
0.06±0.03 |
0.07±0.03 |
0.05±0.03 |
0.02±0.01 |
|
CS 7-8 |
0.07±0.01 |
0.04±0.02 |
0.09±0.04* |
0.12±0.03* |
0.1±0.01* |
0.13±0.02* |
0.06±0.02 |
0.03±0.02 |
|
CS 9-10 |
0.06±0.01 |
0.06±0.01 |
0.14±0.05* |
0.12±0.05* |
0.12±0.02* |
0.14±0.03* |
0.05±0.02 |
0.04±0.02 |
* - p<0.05
Table 5: Ischemic dynamics of ST segment during interventions in RCA
According to ECG obtained by standard methods and using an endocardial electrode (p = NS), no ischemic changes were detected in any of the groups after stenting (p > 0.05).
In all three groups there were no amplitude differences detected in patients with stenosis predilation and those who had direct coronary stenting (p > 0.05), which indicates the high accuracy of the ECG-CS diagnostic method.
The frequency of the revealed ST depression and elevation in all three groups (p = NS) did not differ and amounted to 48% and 52% (p > 0.05), respectively.
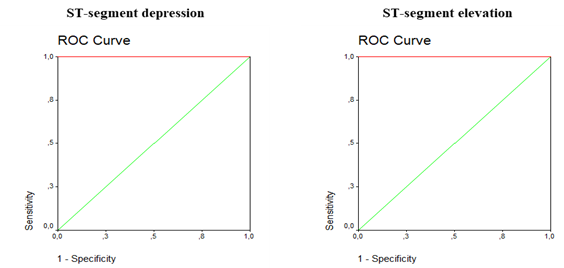
The sensitivity of the ECG-CS method according to ROC-analysis in case of ST depression was 79.5%, specificity 100%. When registering ST elevation on an intracardiac cardiogram, the sensitivity of the method was 83% with a specificity of 100% (Figure 6).
Discussion
The insufficient accuracy of ECG obtained in the only frontal plane with limb leads during coronary intervention led to the creation of the ECG method from the coronary sinus, which is based on the unification of the existing standardized technique of invasive electrophysiological studies [9, 10].
The use of ECG-CS allows medical professionals to obtain objective information on the dynamics of the ST-segment at every stage of coronary stenting. The use of an endocardial electrode makes it possible to record significant changes in the ST-segment in all the blood supply zones of coronary arteries. The analysis data indicate that in the ADA blood supply zone, significant ST-segment dynamics were recorded in CS leads 1-2, and CS 3-4 of the endocardial electrode. In the BSZ of CCA, the leads responsible for ST-segment changes were CS 3-4 and CS 5-6. In the RCA blood supply zone, changes in the ST-segment were visualized in CS leads 7-8 and CS 9-10 (p < 0.05).
The obtained distribution of CS electrode leads responsible for various CAs corresponds to the topographic characteristics of the coronary sinus and the myocardial perfusion location: EL CS 1-2 and CS 3-4 are located in the projection of the anterior wall of the left ventricle (LV) and interventricular septum – the ADA blood supply zone; CS 5-6, and CS 7-8 – lateral and, partially, posterior (BSZ of CCA, RCA); CS 9-10 – in the projection of the posterior wall of the LV (RCA blood supply zone).
In all the coronary artery blood supply zones at the moment of vascular occlusion, the minimum displacement of the ST-segment in absolute value was 0.07 mV, the maximum – 0.25 mV. There was no significant difference in the amplitude of the ST-segment in patients with stenosis predilation and those who had direct coronary stenting. The incidence of ST depression was 48% and the elevation, 52%.
The value of the obtained amplitudes and incidence of ST depressions and elevations did not contradict the existing mathematical and biophysical models of myocardial ischemia and experimental data [1, 2, 6, 8].
Furthermore, ROC-analysis data showed high sensitivity and specificity of ECG-CS, another indicator of the method’s high accuracy in relation to myocardial ischemia.
Conclusion
The technique of an intracardiac ECG from the coronary sinus suggested by Professor Yury L. Shevchenko makes it possible not only to assess the degree of ischemia during endovascular coronary interventions, but also to quite accurately determine the location of the ischemic focus in the projection of a particular myocardial artery.
The intracardiac ECG from the coronary sinus is a unified, effective, highly informative and promising method for clinical use to perform invasive control of ischemia, opening up additional possibilities for monitoring the electrical activity of the heart during endovascular coronary interventions.
Funding statement
This study did not receive any competitive grants from sponsors in the public, commercial, or nonprofit sectors.
Conflict of interests
The authors report that there is no relationship that could be interpreted as a conflict of interest.
References
- Aidu EA, Trunov VG, Titomir LI, Tysler M, Turzova M, Szathmary V. Electrocardiographic ST segment changes as an indicator for localization of injury potentials. A computer simulation study. Kardiologia. 15 (2006): 21-24.
- Aras K, Burton B, Swenson D, MacLeod R. Spatial organization of acute myocardial ischemia. Journal of electrocardiology 49 (2016): 323-336.
- Arteyeva NV, Azarov JE. The role of transmural repolarization gradient in the inversion of cardiac electric field: model study of ECG in hypothermia. Annals of Noninvasive Electrocardiology 22 (2017): e12360.
- Barth TJ, Griebel M, Keyes DE, et al. Computing the electrical activity in the heart. Berlin, Heidelberg: Springer-Verlag (2006): 307.
- Bokeriya LA, Milievskaya EB, Kudzoeva ZF, et al. Serdechno-sosudistaya hirurgiya – 2018. Bolezni i vrozhdennye anomalii sistemy krovoobrashcheniya (in Russian) [Cardiovascular surgery – 2018. Diseases and congenital malformations of the circulatory system]. Moscow: NMICSSKH im. A.N. Bakuleva MZ RF (2018): 270.
- Burton BM, Aras KK, Good WW, Tate JD, Zenger B, MacLeod RS. Image-based modeling of acute myocardial ischemia using experimentally derived ischemic zone source representations. Journal of electrocardiology 51 (2018): 725-733.
- Fallahi A, Khorram HG, Kokabi A. Electrocardiogram signal generation using electrical model of cardiac cell: application in cardiac ischemia. Journal of medical engineering & technology 43 (2019): 207-216.
- Johnston BM, Coveney S, Chang ET, Johnston PR, Clayton RH. Quantifying the effect of uncertainty in input parameters in a simplified bidomain model of partial thickness ischaemia. Medical & biological engineering & computing 56 (2018): 761-780.
- Shevchenko YuL, Marchak DI, Gerashchenko AV, et al. Pre-operative preparation and electrophysiological monitoring of the myocardium state with heart endovascular interventions. International Conference Scientific research of the SCO countries: synergy and integration. Participants’ reports in English. Part 1 (2019): 159-167.
- Shevchenko YuL, Sveshnikov AV, Marchak DI, et al. Electrocardiography of the coronary sinus in intracardiac interventions (in Russian). Bull Pir Nat Med & Surg Cent 14 (2019): 4-11.

