Whole-Genome Transcriptome Profiling in PFOS-treated Uterine Artery Endothelial Cells Isolated from Pregnant Women
Article Information
Jay S. Mishra1 and Sathish Kumar1, 2, 3*
1Department of Comparative Biosciences, School of Veterinary Medicine, University of Wisconsin, Madison, Wisconsin, United States of America
2Department of Obstetrics and Gynecology, School of Medicine and Public Health, University of Wisconsin, Madison, Wisconsin, United States of America
3Endocrinology-Reproductive Physiology Program, University of Wisconsin, Madison, Wisconsin, United States of America
*Corresponding Author: Sathish Kumar. Department of Comparative Biosciences, School of Veterinary Medicine, University of Wisconsin, Madison, Wisconsin, United States of America. Email: skumar82@wisc.edu
Received: 11 May 2023; Accepted: 18 May 2023; Published: 24 May 2023
Citation:
Jay S. Mishra and Sathish Kumar. Whole- Genome Transcriptome Profiling in PFOS-treated Uterine Artery Endothelial Cells Isolated from Pregnant Women. Journal of Environmental Science and Public Health. 7 (2023): 79-93.
Share at FacebookAbstract
Empirical evidence from human studies has demonstrated a correlative relationship between perfluorooctane sulfonate (PFOS) exposure and increased risks of preeclampsia and fetal developmental complications. Although experimental and circumstantial data suggest that PFOS induces endothelial dysfunction, leading to decreased uterine arterial blood flow and gestational hypertension, the precise regulatory mechanisms responsible for this effect remain unknown. To address this issue, we treated human uterine artery endothelial cells (hUAECs) isolated from pregnant women with 10 μmol/L PFOS or vehicle and conducted comparative transcriptomic analyses. We identified a total of 19 differentially expressed genes, 9 of which were upregulated and 10 were down-regulated in PFOS-treated pregnant hUAECs. Pre-ranked gene set enrichment analysis unveiled a distinct set of activated genes involved in osmotic stress, cellular stress response, translation regulation, metabolic regulation, and oxidationreduction processes in PFOS-treated pregnant hUAECs. Furthermore, PFOS treatment resulted in the down-regulation of genes implicated in cardiac muscle cell proliferation, embryonic morphogenesis, and muscle cell proliferation. In addition, we observed differential splicing events in 2678 genes in hUAECs exposed to PFOS, with cross-comparison analysis revealing 4 genes that were both differentially expressed and alternatively spliced and were implicated in oxidative stress and cardiac development. In conclusion, this study provides a comprehensive understanding of the molecular mechanisms underlying PFOS-induced gestational uterine artery endothelial dysfunction during pregnancy, offering a valuable resource for future research in this field.
Keywords
PFOS, Genome, Transcriptome, Endothelial cells, Pregnancy.
PFOS articles; Genome articles; Transcriptome articles; Endothelial cells articles; Pregnancy articles.
Article Details
1. Introduction
Per- and polyfluoroalkyl substances (PFAS) encompass a vast array of approximately 5000 synthetic compounds, which are extensively utilized in consumer and industrial goods due to their unique characteristics, including heat resistance, water and oil repellence, and stability [1]. These substances do not degrade, remain in the environment for a long time, and bio-accumulate inside human bodies for up to 3 to 9 years [2]. Human exposure to PFAS occurs through various routes, including drinking water, contaminated food and fish, dermal contact with PFAS products, occupational exposure, and inhalation of contaminated indoor air and dust [3]. PFOS (Perfluorooctane Sulfonic Acid), is widely prevalent among the numerous PFAS compounds. PFOS is most commonly found and highly concentrated PFAS in drinking water in many regions of the USA [4]. Research has established the extensive prevalence of PFOS among the general public, with its presence being identified in various human matrices, including blood, urine, breast milk, and amniotic fluid [4-7]. In recent risk assessment reports, the United States Environmental Protection Agency and the European Food Safety Authority have identified PFOS as a potential reproductive toxicant that can cause adverse developmental effects during pregnancy [8, 9]. Since PFOS has been detected in blood samples of the majority of pregnant women [10], understanding the potential health effects of PFOS exposure during pregnancy has become a growing concern.
During normal pregnancy, the maternal cardiovascular system undergoes significant changes, including decreased systemic blood pressure, vascular resistance, and increased blood volume and cardiac output [11]. Uterine blood flow plays a crucial role in this process. The maternal uterine artery undergoes exquisite remodeling during pregnancy, which allows it to withstand a 20–40 fold increase in blood flow compared to the nonpregnant state [12, 13]. The endothelial cells in the uterine arteries are crucial for these pregnancy-related uterine vascular adaptations [14]. The clinical relevance of optimal uterine artery endothelial cell function is frequently emphasized by its malfunction contributing to gestational pathologies such as fetal growth restriction and preeclampsia and increased risk of metabolic diseases such as diabetes and cardiovascular diseases later in life [15, 16]. The local production of vasodilators, particularly nitric oxide (NO) by the uterine artery endothelial cells, is critical for the pregnancy-associated rise in uterine blood flow [17, 18]. Therefore, any disruption in the uterine artery endothelial function can lead to complications during pregnancy.
Epidemiological studies have established a correlation between PFOS exposure and preeclampsia [19]. Animal studies indicate that PFOS exposure in pregnant rats may contribute to gestational hypertension, reduced uterine arterial blood flow, attenuated endothelium-dependent relaxation response, and decreased eNOS activity and NO production [20, 21]. In nonpregnant animals, PFOS exposure disrupts the communication between endothelial cells and astrocytes, resulting in inflammation, cardiac fibrosis, and myocardial hypertrophy [22]. In vitro studies demonstrate that PFOS induces endothelial permeability aberrations and triggers tight junction opening [23]. PFOS exposure also inhibits angiogenesis in human umbilical vein endothelial cells by reducing cellular sprouting through diminished vascular endothelial growth factor signaling [24]. Furthermore, the EPA ToxCast™ project identifies PFOS as a potential disruptor of blood vessel formation and remodeling [66]. Additionally, prenatal PFOS exposure leads to increased cardiovascular dysfunction in offspring, including hypertension and decreased endothelial function [25]. Although circumstantial and experimental evidence indicates that PFOS causes endothelial dysfunction with an associated decrease in uterine arterial blood flow and gestational hypertension, the specific regulatory mechanisms through which PFOS induces endothelial dysfunction remain unclear. In order to improve our understanding of this issue, we conducted a study using human uterine artery endothelial cells (hUAECs) isolated from healthy pregnant women and treated with PFOS. Our study represents the first comprehensive evaluation of the global transcriptome changes, alternative splicing, and potential pathways implicated in PFOS-induced gestational uterine arterial endothelial dysfunction.
2. Material and Methods
2.1 RNA Sample Preparation from hUAECs
Dr. Dongbao Chen, University of California Irvine, provided the hUAECs. These cells were isolated from pregnant women (35–36 weeks of gestation) between 30 and 45 years old undergoing hysterectomy. Written consent was obtained from all participants, and ethical approval (HS#2013–9763) was granted by the Institutional Review Board at the University of California Irvine. The isolation and culture methods for hUAECs were performed as described previously [26, 27]. The cells were purified, validated, and cultured in endothelial cell medium (ECM; ScienCell, La Jolla, CA) containing 5% fetal bovine serum, endothelial growth supplements, and 1% penicillin/streptomycin. The cells were used within 4–5 passages and were treated with PFOS for 24 hours at a concentration of 10 µmol/L. This dose (10 µmol/L ) was chosen because PFOS in human serum range between 0.6 and 4.8 μM following exposure [28]. Others have used similar PFOS concentrations for in vitro studies [29, 30]. Thus, in this in vitro exposure study, the culture was treated with vehicle (DMSO) or 10 µmol/L PFOS for 24 h (n = 4), followed by comparative transcriptomic analysis. RNA was isolated from the cells using an RNeasy mini kit (Qiagen, Valencia, CA), and the experimental procedures are depicted in Figure 1.
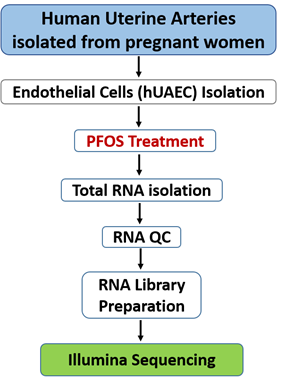
Figure 1: RNA-seq experiment workflow
2.2 Library Preparation and Sequencing
Before sequencing library preparation, the integrity and concentration of RNA were evaluated using a bio-analyzer (Agilent Technologies, Santa Clara, CA) and approximately 1-2 µg of total RNA from each sample was utilized for RNA-seq library preparation using the KAPA Stranded RNA-Seq Library Prep Kit (Illumina, San Diego, CA) [31]. The mRNA was enriched from the total RNA using the NEBNext Poly(A) mRNA Magnetic Isolation Module (#E7490S, NEB; Ipswich, MA), and rRNA was removed using the RiboZero Magnetic Gold Kit (MRZG126, Illumina). The mRNA was then fragmented into small pieces with divalent cations under elevated temperatures. These RNA fragments were then converted into first-strand cDNA using random primers and SuperScript II reverse transcriptase (Invitrogen, Waltham, MA ), followed by second-strand cDNA synthesis using DNA Polymerase I and RNase H. The cDNA fragments underwent end repair and had a single 'A' base added before ligating the indexing adapters. The final cDNA library was purified and enriched through PCR.
The completed libraries were subjected to quality control assessments, including concentration determination, fragment size distribution analysis between 400-600 bp, and detection of adapter dimer contamination using Agilent 2100 Bioanalyzer (Agilent Technologies, Santa Clara, CA). The library quantity was evaluated using the absolute quantification qPCR method. The barcoded libraries were pooled in equal amounts and utilized for sequencing. The DNA fragments within the well-mixed libraries were denatured using 0.1 M NaOH to produce single-stranded DNA molecules, loaded onto channels of the flow cell at a concentration of 8 pM, and amplified in situ with the NovaSeq 6000 S4 Reagent Kit (300 cycles). The sequencing process was conducted using the Illumina NovaSeq 6000 system in accordance with the manufacturer's guidelines, with a total of 150 cycles being run.
2.3 Data Processing and Bioinformatics Analysis
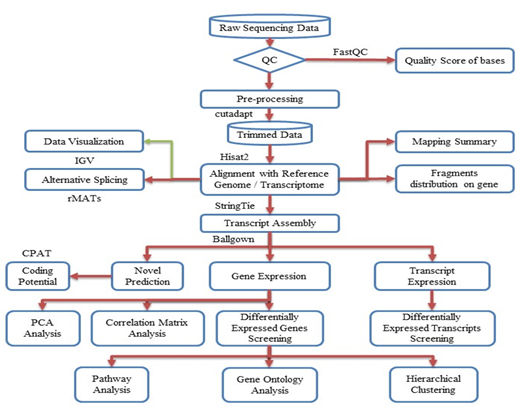
Figure 2: Workflow pipeline for sequencing, data processing, differential expression, alternative splicing, and bioinformatics analysis.
The entire workflow pipeline for sequencing, data processing, differential expression, alternative splicing, and bioinformatics analysis is depicted in Figure 2. Image analysis and base calling were performed using Solexa pipeline v1.8 (Off-Line Base Caller software, v1.8). The raw paired-end reads quality was assessed using the FastQC software. The reads were trimmed (51 and 31 adaptor bases removed using cutadapt) and mapped to the reference genome utilizing the Hisat2 software. Transcript abundances for each sample were estimated using StringTie, and the FPKM value was calculated for gene and transcript levels using the R package Ballgown. Differentially expressed genes and transcripts were filtered using the Ballgown R package. Novel genes and transcripts were predicted from the assembled results by comparing them to the reference annotation using StringTie and Ballgown. The coding potential of these sequences was evaluated using CPAT [32]. Alternative splicing events were detected using rMATS [33]. Principal component analysis and correlation analysis were conducted based on gene expression levels using statistical computing and graphics environments such as R, Python, or Shell.
2.4 Digital PCR (dPCR) Validation of DEGs
The copy number analysis of the top 4 up- and down-regulated genes from the RNA sequencing data set was performed using the QIAcuity one-plate digital PCR instrument (Qiagen). A total of 1 µg of total RNA from both vehicle- and PFOS-treated hUAECs (n = 4/group) was reverse transcribed using an iScript cDNA synthesis kit (Bio-Rad Laboratories, Hercules, California), and 20 ng cDNA was used per reaction in each well of a 96-well PCR nanoplate containing 8.5K partitions per well. The PCR reactions were set up using 0.8 µM gene-specific forward and reverse primers and 4 µL of 3× EvaGreen PCR master mix (Qiagen). The amplification was performed according to the manufacturer's instructions, using a 3-step cycling protocol for 40 cycles: denaturation at 95°C for 15 sec, annealing at 60°C for 15 sec, and extension at 72°C for 15 sec followed by 5 min cooling period at 40°C. In the QIAcuity dPCR instrument, software version 2.0 was used for thermocycling, partitioning, and data analysis based on the random distribution of the target sequence into 8500 partitions per well. Gene-specific primers for YTHDF3, TDG, SORD, LRRC8D, NDRG5, PRKAR1A, MYC, and CCDC137 were purchased from Integrated DNA Technologies (Coralville, Iowa; see Table 1).
|
Gene |
Forward |
Reverse |
|
YTHDF3 |
GCTACTTTCAAGCATACCACCTC |
ACAGGACATCTTCATACGGTTATTG |
|
TDG |
CATGCAGCAGTGAACCTTGTGG |
GGTCATCCACTGCCCATTAGGA |
|
SORD |
GCCGATACAATCTGTCACCTTCC |
CGCCTTCCTCAAAGGTGACATTG |
|
LRRC8D |
CGTGAAGTTCACTGATGTGGCTG |
TTAAGGTGCCGCAACTCTCGGA |
|
NDRG4 |
GCCTTCTGCATGTAGTGATCCG |
GTGCTTGGTGATCTCCTGCATG |
|
PRKAR1A |
TATGGAACACCGAGAGCAGCCA |
CATCTTCCGCTTTCTCAGTGTGC |
|
MYC |
CCTGGTGCTCCATGAGGAGAC |
CAGACTCTGACCTTTTGCCAGG |
|
CCDC137 |
TATGAGGAGCCGCCAAGAGATG |
CCTCTCCCTTTGCTTCCTTCTC |
Table 1: Human- specific primer sequences used for dPCR analysis
3. Results
3.1 Statistics of the hUAEC Transcriptome
High-throughput next-generation RNA sequencing was used to uncover the variances in transcriptional regulation and alternative splicing patterns between control and PFOS-treated hUAECs. A total of 178,130,275 raw paired-end reads were obtained, with a Q30 quality score ranging from 92%–93%. Supplementary Table S1 and Figure S1 present the quality scores for all samples. Following preprocessing and trimming, approximately 94% of reads (177,964,704) were successfully aligned to the human genome assembly GRCh37 utilizing hisat2 (Table 2). The application of StringTie transcript assembly and ballgown expression analysis revealed the presence of positive transcriptional signal (FPKM reads) for 11,036 genes and 26,310 transcripts in the control group, as well as 11,054 genes and 26,124 transcripts in the PFOS-treated hUAECs. The differential gene expressions between groups based on genes with ANOVA p-value ≤ 0.05 on FPKM abundance were confirmed through principal component analysis (Supplementary Figure S2A). The strong correlation in gene expression between biological samples in both groups was further supported by a Pearson R2 score exceeding 0.92 (Supplementary Figure S2B). The overall experimental design is illustrated in Figure 1, and the comprehensive workflow pipeline encompassing sequencing, data processing, differential expression, alternative splicing, and bioinformatics analysis is presented in Figure 2.
|
Sample |
Raw Pairs |
Trimmed |
Mapped |
Unmapped |
|
V1 |
20816103 |
20806923 |
94.69% |
5.31% |
|
V2 |
16526274 |
16518739 |
93.63% |
6.37% |
|
V3 |
21347578 |
21331521 |
94.85% |
5.15% |
|
V4 |
21401824 |
21389977 |
95.50% |
4.50% |
|
P1 |
21878019 |
21871270 |
95.33% |
4.67% |
|
P2 |
28802744 |
28740516 |
93.03% |
6.97% |
|
P3 |
22930108 |
22915770 |
94.30% |
5.70% |
|
P4 |
24427625 |
24389988 |
93.62% |
6.38% |
Table 2: Summary of hUAEC mRNA Sequencing.
mRNA of hUAECs treated with vehicle and PFOS (n=4/group) were sequenced on the Illumina X-ten/NovaSeq platform, yielding approximately 50–80 million 2 × 125-bp paired-end reads per sample, which was then mapped to the human reference genome (GRCh37). V-Vehicle treated; P-PFOS treated.
3.2 Differentially Expressed Genes (DEGs)
Out of the total number of identified genes, 11036 and 11054 were detected in the control and PFOS-treated groups, respectively. Using the R package ballgown with a fold change cutoff of 1.5, a p-value cutoff of ≤0.05, and a minimum FPKM value of ≥0.5 in one group, we identified differential expression of 19 genes. Among the DEGs, the majority (52.6%, 10 genes) were found to be downregulated in the PFOS-treated group, while the remaining genes (47.4%, 9 genes) were upregulated compared to the control group. DEG expression profiles were prepared for all biological replicates and presented on a heatmap (Figure 3) and Circos plot (Figure 4). The 9 upregulated protein-coding genes were: AP002748.4, HNRNPA1L2, LRRC8D, YTHDF3, SORD, EEF1G, NPIPA7, TDG, AC006486.1 (Table 3). The 10 downregulated gene were: MYC, ACDC137, NDRG4, PRKAR1A, ARMT1, HIPK1, PBX2, GNA11, IINC00094, CLCN5 (Table 4).
|
Gene Name |
Locus |
log2FC |
Fold Change |
p-value |
q value |
|
AP002748.4 |
chr11:66276550-66301084 |
1.2198876 |
2.3292856 |
0.0383892 |
0.999661 |
|
HNRNPA1L2 |
chr13:53214921-53217931 |
1.2195783 |
2.3287863 |
0.0351532 |
0.999661 |
|
LRRC8D |
chr1:90286573-90402170 |
1.1324837 |
2.1923584 |
0.0420282 |
0.999661 |
|
YTHDF3 |
chr8:64081112-64125344 |
1.0068202 |
2.0094772 |
0.0318647 |
0.999661 |
|
SORD |
chr15:45315302-45369383 |
0.7746909 |
1.7108235 |
5.77E-05 |
0.744206 |
|
EEF1G |
chr11:62327073-62341558 |
0.6726028 |
1.5939461 |
0.0456739 |
0.999661 |
|
NPIPA7 |
chr16:16472912-16487811 |
0.6665088 |
1.5872273 |
0.029134 |
0.999661 |
|
TDG |
chr12:104359582-104382652 |
0.609161 |
1.5253719 |
0.0182253 |
0.999661 |
|
AC006486.1 |
chr19:42738735-42759284 |
0.5863786 |
1.5014731 |
0.0424556 |
0.999661 |
Table 3: Upregulated differentially expressed genes (DEGs) in PFOS treated compared with control.
|
Gene Name |
Locus |
log2FC |
Fold Change |
p-value |
q value |
|
MYC |
chr8:128747680-128753680 |
-2.114034 |
0.2310002 |
0.0247795 |
0.999661 |
|
CCDC137 |
chr17:79633394-79640934 |
-1.265227 |
0.416034 |
0.0129473 |
0.999661 |
|
NDRG4 |
chr16:58496750-58547532 |
-0.910151 |
0.5321296 |
0.0083197 |
0.999661 |
|
PRKAR1A |
chr17:66507921-66547460 |
-0.759105 |
0.5908629 |
0.0442921 |
0.999661 |
|
ARMT1 |
chr6:151773393-151791236 |
-0.742352 |
0.5977641 |
0.0014993 |
0.999661 |
|
HIPK1 |
chr1:114471814-114520491 |
-0.739487 |
0.5989523 |
0.0033497 |
0.999661 |
|
PBX2 |
chr6:32152518-32157963 |
-0.653634 |
0.6356772 |
0.0087111 |
0.999661 |
|
GNA11 |
chr19:3094408-3124002 |
-0.647347 |
0.6384534 |
0.0058419 |
0.999661 |
|
LINC00094 |
chr9:136890561-136899788 |
-0.617223 |
0.6519248 |
0.0315418 |
0.999661 |
|
CLCN5 |
chrX:49687225-49863892 |
-0.596516 |
0.6613489 |
0.0003333 |
0.999661 |
Table 4: Downregulated differentially expressed genes (DEGs) in PFOS treated compared with control.
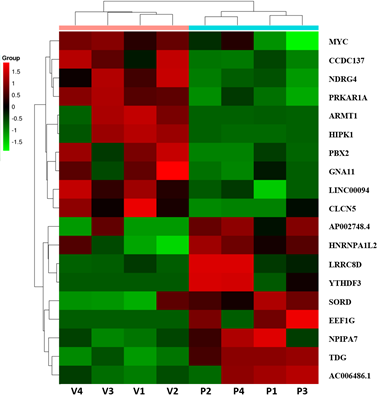
Figure 3: Heatmap of expression data for the 19 DEGs. Columns represent individual libraries; rows indicate gene symbols of DEGs. The z-score scale was applied for visualization expression values (FPKM) of each biological replicate. The red indicates higher values, and the green indicates lower values.
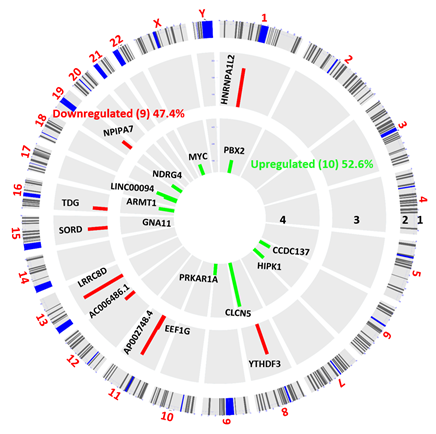
Figure 4: Circos plot of differentially expressed genes (DEGs) between vehicle and PFOS treated hUAEC. DEGs more than 1.5-fold (P < 0.05, paired test) are presented as green bar (Downregulated, track 4) and red bar (Upregulated, track 3). DEG locations are shown as rectangular lines (track 2) along with chromosomes (track 1).
3.3 dPCR Validation of Differentially Expressed Genes
We performed dPCR absolute quantification of the top four up-and-down-regulated genes identified in the datasets to validate our RNA sequencing findings. Our results showed the same direction of expression under dPCR and had comparable log2 fold change confirming that the copy numbers of LRRC8D, YTHDF3, TDG, and SORD were increased, while the copy numbers of MYC, CCDC137, NDRG5, and PRKAR1A were decreased in PFOS-treated hUAECs compared to vehicle-treated controls (Figure 5A). Additionally, the Pearson’s correlation analysis showed the expression levels calculated via RNA-Seq were significantly positively correlated to the expression levels determined via dPCR, supporting the validity of our findings (Figure 5B).
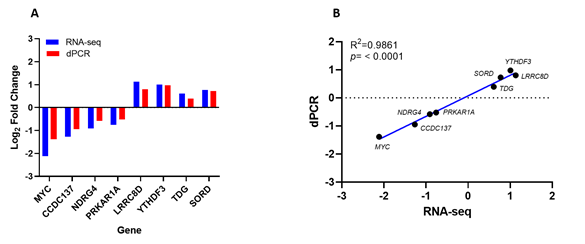
Figure 5: Digital PCR (dPCR) validation of the four up and downregulated genes from RNA sequencing data. (A) Log2 fold change comparison of RNA-seq and digital PCR-based absolute quantification. (B) Correlation between RNA-seq and dPCR gene expression (R2 = 0.98, n= 4 per group, p < 0.0001).
3.4 Functional Enrichment and KEGG Pathway Analysis
To elucidate the cellular and molecular mechanisms affected by PFOS exposure, we conducted a pre-ranked gene set enrichment analysis (PGSEA) for Gene Ontology (GO). Our analysis identified 17 activated processes in the 'biological process' category, with the top four processes being response to osmotic stress (p = 7.93e-05), regulation of translation (p = 3.29e-03), organophosphate metabolic process (p = 1.05e-02), and oxidation-reduction process (p = 1.23e-02). Additionally, we identified 122 suppressed processes, with the top four being cardiac muscle cell proliferation (p = 4.75e-06), embryonic morphogenesis (p = 6.19e-06), muscle cell proliferation (p = 7.98e-06), and animal organ development (p = 2.17e-05), all with FDR = 0.001 (Figure 6).
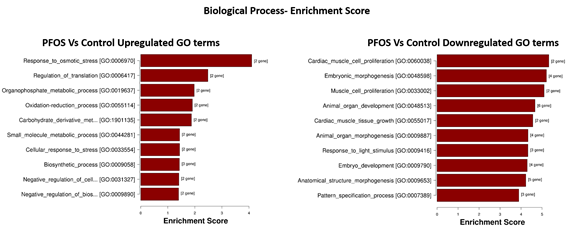
Figure 6: Top 10 enriched GO terms related to Biological Processes. Ordered from top to bottom by p-value (-log10 scaled), with the most significant pathway on the top.
In the 'cellular component' category, PFOS activated five processes, with the top three being intracellular membrane-bounded organelle (p = 6.28e-02), endoplasmic reticulum (p = 6.28e-02), and extracellular exosome (p = 7.42e-02) with FDR = 0.36. Additionally, we found 29 suppressed processes, with the top three being synapse (p = 3.07e-03), lysosomal membrane (p = 3.65e-03), and vacuolar membrane (p = 4.70e-03) with FDR = 0.07 (Figure 7).
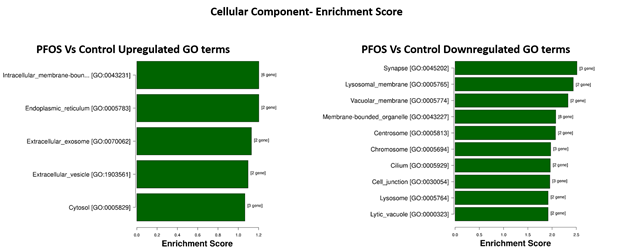
Figure 7: Top 10 enriched GO terms related to Cellular Component, ordered from top to bottom by p-value (-log10 scaled), with the most significant pathway on the top.
Finally, in the 'molecular function' category, PFOS activated four processes, with the top three being organic cyclic compound binding (p = 5.81e-02), protein binding (p = 5.84e-02), and identical protein binding (p = 7.68e-02). Furthermore, we identified 70 suppressed processes, with the top three being protein binding (p = 1.74e-03), purine ribonucleotide binding (p = 1.94e-03), and purine nucleotide binding (p = 1.99e-03), all with FDR = 0.03 (Figure 8).
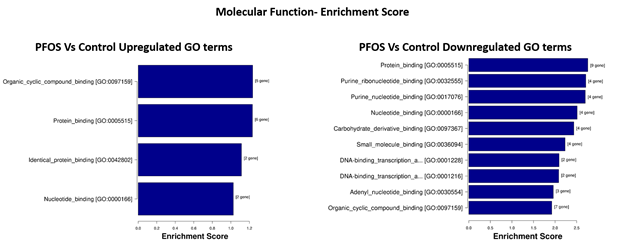
Figure 8: Top 10 enriched GO terms related to Molecular Function, ordered from top to bottom by p-value (-log10 scaled), with the most significant pathway on the top.
Upon conducting KEGG pathways analysis, it was found that DEGs were involved in three suppressed pathways, but none were activated in the PFOS-exposed group. These pathways include cellular senescence (p = 2.18e-03), human cytomegalovirus infection (p = 4.49e-03), and pathways in cancer (p = 2.38e-02) (Figure 9).
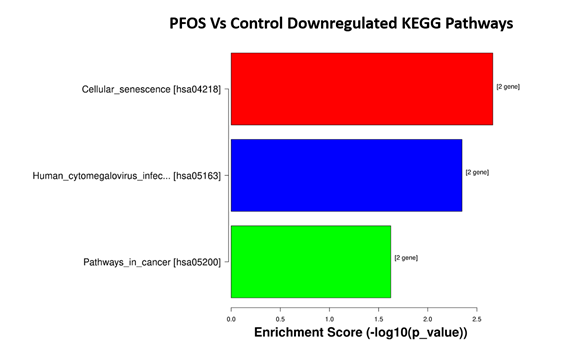
Figure 9: Top 3 significant pathways. They are ordered from top to bottom by p-value (-log10 scaled), with the most significant pathway on the top.
3.5 Alternative Splicing Patterns
Using splice junction counts as input, alternative splicing events (ASE) were investigated using the rMATS paired model (v3.2.1 beta) to determine the extent of alternative splicing changes in PFOS-treated hUAECs. Five basic and widely accepted alternative splicing modes were identified, including alternative 5' splice site (A5SS), alternative 3' splice site (A3SS), skipped exon (SE), retained intron (RI), and mutually exclusive exons (MXE). The hUAECs exhibited a total of 49,802 ASEs, with SE being the most frequently observed mode (69.2% or 34,443 SE events) and A5SS being the least common (6.1% or 3,055 A5SS events) (Figure 10).
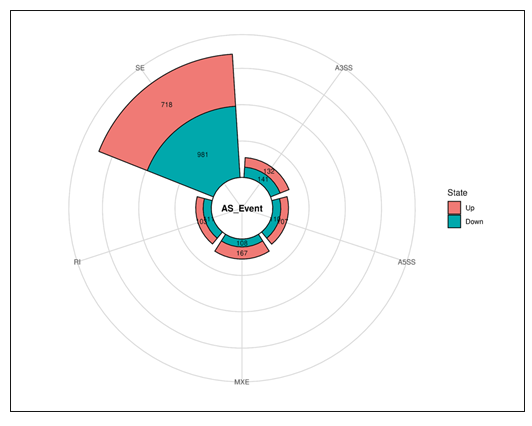
Figure 10: Differential alternative splicing events summary plots.
Out of the 49,802 ASEs identified, a total of 2,678 events exhibited differential alternative splicing (DASE) in PFOS-exposed hUAECs compared to vehicle-treated cells (at the threshold of FDR > 0.1, p > 0.05). Of the 2,678 DASE events, there were 217 A5SS (with 107 increased events and 110 decreased events), 273 A3SS (with 132 increased events and 141 decreased events), 1,699 SE (with 718 increased events and 981 decreased events), 214 RI (with 103 increased events and 111 decreased events), and 275 MXE (with 167 increased events and 108 decreased events) (Table 5).
|
ASE Type |
No. of Events (%) |
Differential ASE Events (DASE) |
Significant Number of Events (Up) |
Significant Number of Events (Down) |
|
A5SS |
3055 (6.1) |
217 |
107 |
110 |
|
A3SS |
4582 (9.2) |
273 |
132 |
141 |
|
SE |
34443 (69.2) |
1699 |
718 |
981 |
|
RI |
3692 (7.4) |
214 |
103 |
111 |
|
MXE |
4030 (8.1) |
275 |
167 |
108 |
|
Total |
49802 (100) |
2678 |
1227 |
1451 |
Table 5: Summary of the numbers of five types of ASE and significant upregulated and downregulated events
Further cross-comparison analysis revealed 4 genes (NDRG4, PRKAR1A, TDG, YTHDF3) that were both differentially expressed and alternatively spliced, and were implicated in oxidative stress and cardiac development. We found that PFOS downregulated gene NDRG4 was represented in all 5 ASEs while PRKAR1A was associated with 3 ASEs (A3SS, A5SS, SE). Similarly, PFOS-upregulated genes TDG and YTHDF3 were associated with 3 ASEs (A3SS, RI, SE) and 2 ASEs (MXE and SE), respectively. The top 2 representative rMATS sashimi plots for up (YTHDF3 and TDG) and down (NDRG4 and PRKAR1A) exon skipping events in PFOS- and vehicle-treated hUAECs are presented in Figure 11.
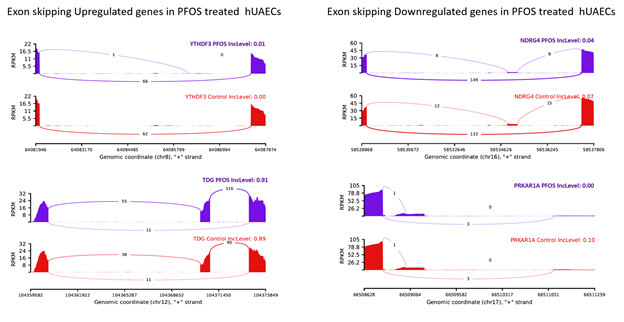
Figure 11: rMATS sashimi plot showing the up/down regulated exon skipping in PFOS-treated hUAECs. The higher rate of skipped exon events at the transcripts of YTHDF3 and TDG and a lower rate of skipped exon events at the transcripts of NDRG and PRKAR1A are presented. The tracks represent PFOS-treated (blue) and vehicle-treated (red) samples. The number on curved lines indicates continuous (top number) and differentially-spliced (bottom number) exon-exon junction read counts. The x-axis depicts genomic coordinates. Inc level represents the exon inclusion level in PFOS- and vehicle-treated hUAECs.
4. Discussion
The present study, for the first time, employed high-throughput next-generation RNA sequencing to discern the differences in transcriptional regulation and alternative splicing patterns between vehicle and PFOS-treated hUAECs. In the control and PFOS-treated groups, 11,036 and 11,054 genes were detected, respectively, and 19 genes were differentially expressed, of which 10 genes were downregulated and 9 genes were upregulated in the PFOS-treated group compared to the control group. PFOS exposure induced activation of pathways related to stress response and suppression of pathways involved in cardiac muscle cell proliferation and embryogenesis. Differential exon skipping appears to be the most predominant alternative splicing event in hUAECs, with 4 genes, including NDRG4, PRKAR1A, TDG and YTHDF3, exhibiting both differential gene expression and differential alternative splicing in the PFOS-exposed hUAECs. While many of these genes were associated with pathologies [34-37], the differential expression of these genes in PFOS-exposed hUAECs relative to controls suggests that these genes may have a unique role in mediating PFOS-induced gestational uterine vascular endothelial dysfunctions. In mammals, the maternal uterine artery undergoes exquisite remodeling during pregnancy. The diameter of the uterine artery in the late pregnant state becomes two to three-fold larger compared to the nonpregnant state in both humans and animals [13, 38, 39]. This increase in uterine artery diameter is accompanied by a substantial rise in blood flow, with a striking 20-40 fold increase observed during late pregnancy [40, 41]. The endothelial cells in the uterine arteries are crucial for these pregnancy-related uterine vascular adaptations [14]. Any constraint in the uterine artery blood flow leads to pregnancy disorders such as preeclampsia and fetal growth restriction [16]. The prevailing consensus posits a correlation between gestational pathologies and pro-oxidative and inflammatory conditions [42, 43]. Nevertheless, the underlying etiological factors that underpin the induction of oxidative stress and inflammation in pregnancy pathologies remain unclear. Studies suggest that environmental exposures, specifically PFOS, are linked to heightened risks of adverse pregnancy outcomes [44-46]. However, the mechanistic basis for how PFOS elicits these gestational complications remains unknown. In this present study, a comprehensive analysis of the transcriptome of hUAECs revealed that PFOS triggers alterations in many pathways associated with osmotic stress, cellular stress response, translation regulation, metabolic regulation, and oxidation-reduction processes. It is noteworthy that these GO terms are intricately linked to oxidative stress. Despite numerous reports attesting to the association between PFOS and oxidative stress in pregnancy [47, 48], the precise mechanisms through which PFOS induces oxidative stress are yet to be fully elucidated. However, this study provides evidence that PFOS exposure upregulates several genes, including LRRC8D, SORD, TDG, EEF1G, and YTHDF3, which play a pivotal role in the induction of oxidative stress. For example, LRRC8D, which encodes a protein that generates anion channels, stimulates Nox1, NF-κB activity and extracellular superoxide production [49]. Similarly, PFOS induced upregulation of SORD (encodes sorbitol dehydrogenase), which elevates the reduced form of NADH, leading to the activation of NADH oxidase activity and the production of superoxide anions [50]. Moreover, PFOS exposure elicits the upregulation of TDG, which encodes the enzyme thymine DNA glycosylase. TDG plays a crucial role in DNA repair and epigenetic regulation, as well as in the regulation of gene expression involved in endothelial cell response to stress, including inflammation and oxidative stress [51, 52]. Therefore, the activation of LRRC8D, SORD, TDG, EEF1G, and YTHDF3 genes in hUAECs following PFOS exposure is noteworthy and warrants further exploration to ascertain whether their activation contributes to the induction of oxidative stress and endothelial dysfunction. Simultaneously, we observed that exposure to PFOS elicited suppression of several pathways, such as cardiac muscle cell proliferation, cardiac muscle tissue growth, embryonic morphogenesis, animal organ development, and anatomical structure morphogenesis. All these GO terms are associated with cardiovascular development and embryogenesis. More specifically, exposure to PFOS has been observed to downregulate the expression of critical genes, including NDRG4, PRKAR1A, HIPK1, PBX2, GNA11, and MYC, which play vital roles in embryonic morphogenesis, cardiac muscle growth, and proliferation. For example, NDRG4 regulates the Wnt signaling pathway, which is critical for cell migration, proliferation, and tissue patterning during cardiovascular development [53, 54]. Downregulation of HIPK2, a transcriptional cofactor downstream of the TGF-β/BMP signaling pathway, affects cellular responses to TGF-β during fetal development, leading to poor adherens junction formation and excessive proliferation in endothelial cells, resulting in early embryonic lethality [55, 56]. PBX2 plays a role in organ and tissue formation and patterning, including the cardiovascular, nervous, skeletal, and digestive systems [57], while GNA11 regulates smooth muscle contraction and angiogenesis [58]. MYC controls cell proliferation, differentiation, and survival, and its downregulation can lead to abnormal phenotypes such as heart bleeding, pericardium edema, and spinal curvature [59]. Numerous investigations have demonstrated a correlative relationship between exposure to PFOS and developmental toxicity, as evidenced by several studies [60-63]. Maternal exposure to PFOS has been shown to result in impaired cardiac function, characterized by systolic alterations, left ventricular hypertrophy, and fibrosis, as well as an increased likelihood of cardiac developmental anomalies in offspring [21, 64]. Despite uncertainties regarding the precise mechanisms by which PFOS induces developmental toxicity, it is imperative to explore the potential involvement of several identified genes (NDRG4, PRKAR1A, HIPK1, PBX2, GNA11, and MYC) in the pathogenesis of PFOS-induced cardiac developmental dysfunction.
Analysis in the context of molecular functions showed that PFOS exposure triggered the activation of four distinct processes, with the top three being organic cyclic compound binding, protein binding, and identical protein binding. This finding suggests that PFOS may have an impact on protein function and structural dynamics within cells. On the other hand, we identified 70 suppressed processes as a result of PFOS exposure, with the top three being protein binding, purine ribonucleotide binding, and purine nucleotide binding. The suppression of protein binding, in particular, is a significant finding, as it suggests that PFOS may interfere with the proper formation and functioning of protein complexes, which are essential for many cellular processes. Specifically, our findings suggest that PFOS may disrupt normal cellular processes by altering protein function and binding. Consistently, both the experimental and computational analyses indicate that PFOS binds with human serum albumin, FAT6 and FAT3/4 and alters their function [65].
The splicing of precursor mRNA is a crucial step in gene regulation that allows for the production of functionally diverse proteins from a single gene, known as isoforms. These isoforms may play unique roles in protein-protein, protein-ligand, protein-nucleic acid, or protein-membrane interactions, as well as in localization and enzymatic properties [66]. Alternative splicing mechanisms are triggered in response to demand and cellular need. A macromolecular machine tightly regulates this process, including splicing enhancers, silencers, serine-arginine-rich proteins, and spliceosomes. These components work synergistically and antagonistically to ensure precise control of splicing [66-68]. Intriguingly, our findings indicate that PFOS exposure was associated with the activation of five processes in the 'cellular component' category, including intracellular membrane-bounded organelles, endoplasmic reticulum, and extracellular exosomes, which were all linked to the regulation of alternative splicing [69, 70]. Consistently, we detected 2,678 differential splicing events in hUAECs exposed to PFOS, suggesting that PFOS exposure significantly altered the splicing landscape. In addition, a subset of differentially expressed genes, including NDRG4, PRKAR1A, TDG, and YTHDF3, showed changes in splicing patterns, indicating that splicing could contribute to the differential expression of these genes. Further studies are warranted to investigate whether changes in splicing patterns are associated with functional alterations. Furthermore, it is essential to elucidate whether diversification of splicing or switching to alternative splicing variants is more critical for PFOS-induced endothelial dysfunction.
In conclusion, this study has shed light on the previously unknown mechanisms underlying the cardiovascular complications associated with maternal PFOS exposure. Our findings have identified a number of potential candidate genes that may play a role in mediating these effects. Further investigations are needed to elucidate the specific contributions of these candidate genes in PFOS-induced abnormal cardiovascular adaptations during pregnancy and developmental toxicity.
Acknowledgments:
We thank Dr. Dongbao Chen, University of California Irvine, for providing the hUAECs.
Funding
Financial Support from the National Institute of Health (NIH) through grants R01ES033345 and R01HL134779, awarded to S.K., is greatly appreciated. The content is solely the authors' responsibility and does not necessarily represent the official views of NIH. The funding agency was not involved in the design, analysis, or interpretation of the data reported.
References
- Buck RC, Franklin J, Berger U, et al. Perfluoroalkyl and polyfluoroalkyl substances in the environment: terminology, classification, and origins. Integr Environ Assess Manag 7 (2011): 513-541.
- Olsen GW, Burris JM, Ehresman DJ, et al. Half-life of serum elimination of perfluorooctanesulfonate,perfluorohexanesulfonate, and perfluorooctanoate in retired fluorochemical production workers. Environ Health Perspect 115 (2007): 1298-1305.
- Sunderland EM, Hu XC, Dassuncao C, et al. A review of the pathways of human exposure to poly- and perfluoroalkyl substances (PFASs) and present understanding of health effects. J Expo Sci Environ Epidemiol 29 (2019): 131-147.
- LaKind JS, Verner MA, Rogers RD, et al. Current Breast Milk PFAS Levels in the United States and Canada: After All This Time, Why Don't We Know More? Environ Health Perspect 130 (2022): 25002.
- McDonough CA, Choyke S, Barton KE, et al. Unsaturated PFOS and Other PFASs in Human Serum and Drinking Water from an AFFF-Impacted Community. Environ Sci Technol 55 (2021): 8139-8148.
- Zhang T, Sun H, Qin X, et al. PFOS and PFOA in paired urine and blood from general adults and pregnant women: assessment of urinary elimination. Environ Sci Pollut Res Int 22 (2015): 5572-5579.
- Stein CR, Wolff MS, Calafat AM, et al. Comparison of polyfluoroalkyl compound concentrations in maternal serum and amniotic fluid: a pilot study. Reprod Toxicol 34 (2012): 312-316.
- Chain EPoCitF, Knutsen HK, Alexander J, et al. Risk to human health related to the presence of perfluorooctane sulfonic acid and perfluorooctanoic acid in food. EFSA J 16 (2018): 05194.
- Health Effects Support Document for Perfluorooctane Sulfonate (PFOS). EPA 822-R-16-002. Washington, DC: U.S. EPA 8 (2021).
- Peterson AK, Eckel SP, Habre R, et al. Detected prenatal perfluorooctanoic acid (PFOA) exposure is associated with decreased fetal head biometric parameters in participants experiencing higher perceived stress during pregnancy in the MADRES cohort. Environ 9 (2022): 100286.
- Sanghavi M, Rutherford JD. Cardiovascular physiology of pregnancy. Circulation 130 (2014): 1003-1008.
- Browne VA, Julian CG, Toledo-Jaldin L, et al. Uterine artery blood flow, fetal hypoxia and fetal growth. Philos Trans R Soc Lond B Biol Sci 370 (2015): 20140068.
- Osol G, Mandala M. Maternal uterine vascular remodeling during pregnancy. Physiology (Bethesda) 24 (2009): 58-71.
- Boeldt DS, Bird IM. Vascular adaptation in pregnancy and endothelial dysfunction in preeclampsia. J Endocrinol 232 (2019): 27-44.
- Gluckman PD, Hanson MA, Cooper C, et al. Effect of in utero and early-life conditions on adult health and disease. N Engl J Med 359 (2008): 61-73.
- Kornacki J, Gutaj P, Kalantarova A, et al. Endothelial Dysfunction in Pregnancy Complications. Biomedicines 9 (2021).
- Nelson SH, Steinsland OS, Suresh MS, et al. Pregnancy augments nitric oxide-dependent dilator response to acetylcholine in the human uterine artery. Hum Reprod 13 (1998): 1361-1367.
- Magness RR, Shaw CE, Phernetton TM, et al. Bird IM. Endothelial vasodilator production by uterine and systemic arteries. II. Pregnancy effects on NO synthase expression. Am J Physiol 272 (1997): 1730-1740.
- Huang R, Chen Q, Zhang L, et al. Prenatal exposure to perfluoroalkyl and polyfluoroalkyl substances and the risk of hypertensive disorders of pregnancy. Environ Health 18(2019): 5.
- Rogers JM, Ellis-Hutchings RG, Grey BE, et al. Elevated blood pressure in offspring of rats exposed to diverse chemicals during pregnancy. Toxicological sciences : an official journal of the Society of Toxicology 137 (2014): 436-446.
- Dangudubiyyam SV, Mishra JS, Song R, et al. Maternal perfluorooctane sulfonic acid exposure during rat pregnancy causes hypersensitivity to angiotensin II and attenuation of endothelium-dependent vasodilation in the uterine arteries dagger. Biol Reprod 107 (2022): 1072-1083.
- Yu Y, Wang C, Zhang X, et al. Perfluorooctane sulfonate disrupts the blood brain barrier through the crosstalk between endothelial cells and astrocytes in mice. Environ Pollut 256 (2020): 113429.
- Wang X, Li B, Zhao WD,et al. Perfluorooctane sulfonate triggers tight junction "opening" in brain endothelial cells via phosphatidylinositol 3-kinase. Biochem Biophys Res Commun 410 (2011): 258-263.
- Forsthuber M, Widhalm R, Granitzer S, et al. Perfluorooctane sulfonic acid (PFOS) inhibits vessel formation in a human 3D co-culture angiogenesis model (NCFs/HUVECs). Environ Pollut 293 (2022):118543.
- Dangudubiyyam SV, Mishra JS, Zhao H, et al. Perfluorooctane sulfonic acid (PFOS) exposure during pregnancy increases blood pressure and impairs vascular relaxation mechanisms in the adult offspring. Reprod Toxicol 98 (2020): 165-173.
- Mishra JS, Te Riele GM, Qi QR, et al. Estrogen Receptor-beta Mediates Estradiol-Induced Pregnancy-Specific Uterine Artery Endothelial Cell Angiotensin Type-2 Receptor Expression. Hypertension 74 (2019): 967-974.
- Zhang HH, Chen JC, Sheibani L, et al. Pregnancy Augments VEGF-Stimulated In Vitro Angiogenesis and Vasodilator (NO and H2S) Production in Human Uterine Artery Endothelial Cells. J Clin Endocrinol Metab 102 (2017): 2382-2393.
- Olsen GW, Gilliland FD, Burlew MM, et al, Mandel JH. An epidemiologic investigation of reproductive hormones in men with occupational exposure to perfluorooctanoic acid. J Occup Environ Med 40 (1998): 614-622.
- Pierozan P, Cattani D, Karlsson O. Perfluorooctane sulfonate (PFOS) and perfluorooctanoic acid (PFOA) induce epigenetic alterations and promote human breast cell carcinogenesis in vitro. Arch Toxicol 94 (2020): 3893-3906.
- Tukker AM, Bouwman LMS, van Kleef R, et al, Westerink RHS. Perfluorooctane sulfonate (PFOS) and perfluorooctanoate (PFOA) acutely affect human alpha(1)beta(2)gamma(2L) GABA(A) receptor and spontaneous neuronal network function in vitro. Sci Rep 10 (2020): 5311.
- Gopalakrishnan K, Kumar S. Whole-Genome Uterine Artery Transcriptome Profiling and Alternative Splicing Analysis in Rat Pregnancy. Int J Mol Sci 21 (2020).
- Mortazavi A, Williams BA, McCue K, et al. Mapping and quantifying mammalian transcriptomes by RNA-Seq. Nat Methods 5 (2008): 621-628.
- Shen S, Park JW, Lu ZX, et al. rMATS: robust and flexible detection of differential alternative splicing from replicate RNA-Seq data. Proc Natl Acad Sci U S A 111 (2014): 5593-5601.
- Zheng PF, Hong XQ, Liu ZY, et al. m6A regulator-mediated RNA methylation modification patterns are involved in the regulation of the immune microenvironment in ischaemic cardiomyopathy. Sci Rep 13 (2023): 5904.
- Mousa M, Albarguthi S, Albreiki M, et al. Whole-Exome Sequencing in Family Trios Reveals De Novo Mutations Associated with Type 1 Diabetes Mellitus. Biology (Basel) 12 (2023).
- Wang H, Mao M, Liu D, et al. Association between subclinical hyperthyroidism and a PRKAR1A gene variant in Carney complex patients: A case report and systematic review. Front Endocrinol (Lausanne) 13 (2022): 951133.
- Jandrey EHF, Moura RP, Andrade LNS, et al. NDRG4 promoter hypermethylation is a mechanistic biomarker associated with metastatic progression in breast cancer patients. NPJ Breast Cancer 5 (2019): 11.
- Obimbo MM, Ogeng'o JA, Saidi H. Comparative regional morphometric changes in human uterine artery before and during pregnancy. Pan Afr Med J 13 (2012): 30.
- Mandala M, Osol G. Physiological remodelling of the maternal uterine circulation during pregnancy. Basic Clin Pharmacol Toxicol 110 (2012): 12-18.
- Palmer SK, Zamudio S, Coffin C, et al. Quantitative estimation of human uterine artery blood flow and pelvic blood flow redistribution in pregnancy. Obstet Gynecol 80 (1992): 1000-1006.
- Bruce NW. The distribution of blood flow to the reproductive organs of rats near term. J Reprod Fertil 46 (1976): 359-362.
- Aouache R, Biquard L, Vaiman D, et al. Oxidative Stress in Preeclampsia and Placental Diseases. Int J Mol Sci 19 (2018).
- Harmon AC, Cornelius DC, Amaral LM, et al. The role of inflammation in the pathology of preeclampsia. Clin Sci (Lond) 130 (2016): 409-419.
- Padula AM, Ning X, Bakre S, et al. Birth Outcomes in Relation to Prenatal Exposure to Per- and Polyfluoroalkyl Substances and Stress in the Environmental Influences on Child Health Outcomes (ECHO) Program. Environ Health Perspect 131 (2023): 37006.
- Preston EV, Hivert MF, Fleisch AF, et al. Early-pregnancy plasma per- and polyfluoroalkyl substance (PFAS) concentrations and hypertensive disorders of pregnancy in the Project Viva cohort. Environ Int 165 (2022):107335.
- Hall SM, Zhang S, Hoffman K, et al. Concentrations of per- and polyfluoroalkyl substances (PFAS) in human placental tissues and associations with birth outcomes. Chemosphere 295 (2022):133873.
- Taibl KR, Schantz S, Aung MT, et al. Associations of per- and polyfluoroalkyl substances (PFAS) and their mixture with oxidative stress biomarkers during pregnancy. Environ Int 169 (2022): 107541.
- Jiao X, Liu N, Xu Y, et al. Perfluorononanoic acid impedes mouse oocyte maturation by inducing mitochondrial dysfunction and oxidative stress. Reprod Toxicol 104 (2021): 58-67.
- Choi H, Rohrbough JC, Nguyen HN, et al. Oxidant-resistant LRRC8A/C anion channels support superoxide production by NADPH oxidase 1. J Physiol 599 (2021): 3013-3036.
- Obrosova IG, Fathallah L, Lang HJ. Interaction between osmotic and oxidative stress in diabetic precataractous lens: studies with a sorbitol dehydrogenase inhibitor. Biochem Pharmacol 58 (1999): 1945-1954.
- Onabote O, Hassan HM, Isovic M, et al. The Role of Thymine DNA Glycosylase in Transcription, Active DNA Demethylation, and Cancer. Cancers (Basel) 14 (2022).
- Hudson J, Farkas L. Epigenetic Regulation of Endothelial Dysfunction and Inflammation in Pulmonary Arterial Hypertension. Int J Mol Sci 22 (2021).
- Ai R, Sun Y, Guo Z, et al. NDRG1 overexpression promotes the progression of esophageal squamous cell carcinoma through modulating Wnt signaling pathway. Cancer Biol Ther 17 (2016): 943-954.
- Tian Y, Cohen ED, Morrisey EE. The importance of Wnt signaling in cardiovascular development. Pediatr Cardiol 31 (2010): 342-348.
- Chalazonitis A, Tang AA, Shang Y, et al. Homeodomain interacting protein kinase 2 regulates postnatal development of enteric dopaminergic neurons and glia via BMP signaling. J Neurosci 31 (2011): 13746-13757.
- Shang Y, Doan CN, Arnold TD, et al. Transcriptional corepressors HIPK1 and HIPK2 control angiogenesis via TGF-beta-TAK1-dependent mechanism. PLoS Biol 11 (2013): 1001527.
- Selleri L, Zappavigna V, Ferretti E. 'Building a perfect body': control of vertebrate organogenesis by PBX-dependent regulatory networks. Genes Dev 33 (2019): 258-275.
- Zou QY, Zhao YJ, Li H, et al. GNA11 differentially mediates fibroblast growth factor 2- and vascular endothelial growth factor A-induced cellular responses in human fetoplacental endothelial cells. J Physiol 596 (2018): 2333-2344.
- Yang Z, Fu L, Cao M, et al. PFAS-induced lipidomic dysregulations and their associations with developmental toxicity in zebrafish embryos. Sci Total Environ 861 (2023): 160691.
- Liu Y, Yu G, Zhang R, et al. Early life exposure to low-dose perfluorooctane sulfonate disturbs gut barrier homeostasis and increases the risk of intestinal inflammation in offspring. Environ Pollut 329 (2023): 121708.
- Annunziato KM, Marin M, Liang W, et al. The Nrf2a pathway impacts zebrafish offspring development with maternal preconception exposure to perfluorobutanesulfonic acid. Chemosphere 287 (2022): 132121.
- Zhang H, Lu H, Yu L, et al. Effects of gestational exposure to perfluorooctane sulfonate on the lung development of offspring rats. Environ Pollut 272 (2021): 115535.
- Reardon AJF, Karathra J, Ribbenstedt A, et al. Neurodevelopmental and Metabolomic Responses from Prenatal Coexposure to Perfluorooctanesulfonate (PFOS) and Methylmercury (MeHg) in Sprague-Dawley Rats. Chem Res Toxicol 32(2019): 1656-1669.
- Ou Y, Zeng X, Lin S, et al. Gestational exposure to perfluoroalkyl substances and congenital heart defects: A nested case-control pilot study. Environ Int 154 (2021): 106567.
- Delva-Wiley J, Jahan I, Newman RH, et al. Computational Analysis of the Binding Mechanism of GenX and HSA. ACS Omega 6 (2021): 29166-29170.
- Wang Y, Liu J, Huang BO, et al. Mechanism of alternative splicing and its regulation. Biomed Rep 3 (2015): 152-158.
- Lynch KW. Regulation of alternative splicing by signal transduction pathways. Adv Exp Med Biol 623 (2007): 161-174.
- Black DL. Protein diversity from alternative splicing: a challenge for bioinformatics and post-genome biology. Cell 103 (2000): 367-370.
- Carew NT, Nelson AM, Liang Z, et al. Linking Endoplasmic Reticular Stress and Alternative Splicing. Int J Mol Sci 19 (2018).
- Statello L, Maugeri M, Garre E, et al. Identification of RNA-binding proteins in exosomes capable of interacting with different types of RNA: RBP-facilitated transport of RNAs into exosomes. PLoS One 13 (2018): 0195969.
Supplementary Materials:
Supplementary Table S1 and Figure S1. Q30 quality scores and whiskers plot for all samples. Supplementary Figure S2. Principal component analysis (PCA) and Pearson R2 gene-expression correlation analysis. RNA Sequencing data availability: The RNA sequencing data from this study have been deposited in to Gene Expression Omnibus (GEO) Sequence Read Archive (SRA) with accession number GSE232176.
Table S1: Quality scores.
|
Sample |
Reads Count |
Bases Num |
Bases Num (Q ≥ 30) |
Q30 (%) |
|
V1 |
20816103 |
20806923 |
94.69% |
5.31% |
|
V2 |
16526274 |
16518739 |
93.63% |
6.37% |
|
V3 |
21347578 |
21331521 |
94.85% |
5.15% |
|
V4 |
21401824 |
21389977 |
95.50% |
4.50% |
|
P1 |
21878019 |
21871270 |
95.33% |
4.67% |
|
P2 |
28802744 |
28740516 |
93.03% |
6.97% |
|
P3 |
22930108 |
22915770 |
94.30% |
5.70% |
|
P4 |
24427625 |
24389988 |
93.62% |
6.38% |
Generally, the percentage of the number of bases with Q≥ 30 should greater than 80%.
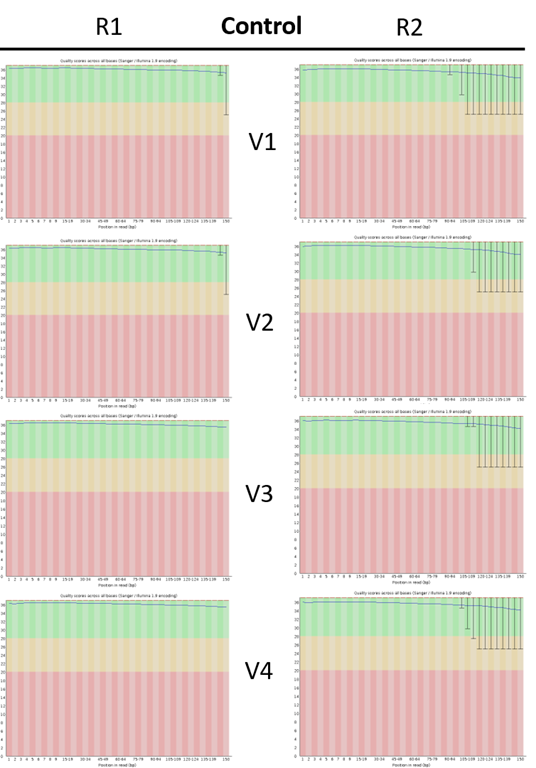
Supplementary Figure S1A: Control quality score whiskers plots
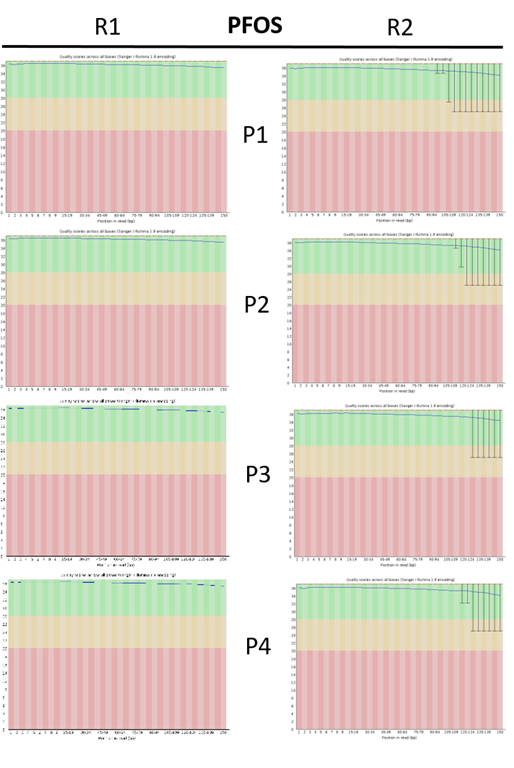
Supplementary Figure S1B: PFOS quality score whiskers plots
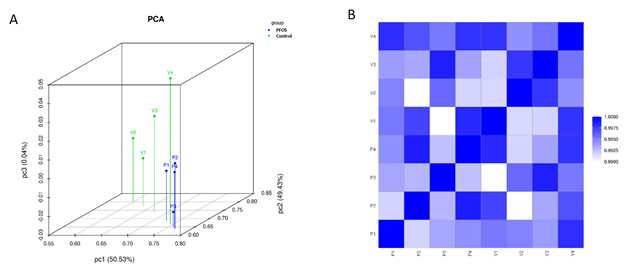
Supplementary Figure S2: Principal component (PCA) and Pearson R2 gene-expression correlation analysis
PCA was performed with genes that have ANOVA p value > 0.05 on FPKM abundance estimations. The figures above is an overview of samples clustering. The PCA revealed the distinguishable gene expression profiling among the samples. Pearson R2 correlation of gene expression between the 4 biological replicates were presented above, showing the score was above 0.9.
