Discovery of Novel Prognostic Biomarkers and Therapeutic Targets for Esophageal Cancer
Article Information
Qian Zhao1#, Yuyu Qiu2, 3#, Jinghua Yang1*, Zhong-Fa Yang2*
1Clinical Systems Biology Laboratories, Hospital of Zhengzhou University, Zhengzhou, China
2Clinical Medical Colleges, Weifang Medical University, Weifang, China
3Scientific Medical Institute, Shandong Medical University, Taian, China
*Corresponding author: Jinghua Yang, Clinical Systems Biology Laboratories, The First Affiliated Hospital of Zhengzhou University, Zhengzhou, Henan Province, China
Zhong-Fa Yang, Clinical Medical Colleges, Weifang Medical University, Weifang, Shandong Province, China
# - These authors contribute equally to the work
Received: 18 August 2020; Accepted: 25 August 2020; Published: 22 September 2020
Citation: Qian Zhao, Yuyu Qiu, Jinghua Yang, Zhong-Fa Yang. Discovery of Novel Prognostic Biomarkers and Therapeutic Targets for Esophageal Cancer. Archives of Clinical and Biomedical Research 4 (2020): 426-440.
Share at FacebookAbstract
Esophageal cancer is one of the most common and lethal malignant tumors. Previous studies revealed the importance of microRNA (miRNA) and their targets in the occurrence, metastasis and prognosis of esophageal cancer. With the availability of The Cancer Genome Atlas (TCGA) database and the development of analytical tools, it is efficient and convenient to identify new biomarkers and key target genes associated with esophageal cancer prognosis through bioinformatic data mining. Five differentially expressed microRNA genes were identified to have significant association with the survival of the esophageal patients. Seven differentially expressed mRNA targets were selected to have significant association with the poor outcomes. These microRNA and mRNA genes could be the candidate biomarkers for tumor prognosis and/or therapeutic targets to improve the survival of esophageal cancer patients.
Keywords
TCGA; Esophageal cancer; MicroRNA; Survival analysis; RNA regulatory network
Article Details
1. Introduction
Esophageal cancer, currently the sixth most common cause of cancer-associated death worldwide, refers to tumors stemming from the esophageal mucosa. These tumors may progress locally to affect the underlying submucosa and muscular layer; they could eventually invade nearby cells such as the tracheobronchial tree, recurrent laryngeal nerve, thoracic aorta, or diaphragm. Esophageal cancer cases have significantly increased in the past forty years. In 2018, there were an estimated 572,034 new diagnoses of esophageal cancer and a resulting 508,585 reported mortalities [1]. Recent data from the World Health Organization (WHO) suggest that age-standardized cases are higher across eastern Asia than any other region, especially in the central area of China-Henan province [1-3]. Not only does the risk of esophageal cancer increase with age, but patients with esophageal cancer may have comorbidities that are related to risk factors associated with specific histological subtypes [4]. Currently, adenocarcinoma and squamous cell carcinoma account for over 95% of all cases of esophageal cancer globally [5]. While in the 1960s squamous cell carcinoma, which is often associated with alcohol and tobacco consumption and primarily affects the upper and middle esophagus, was the more common subtype of esophageal cancer. In recent years, there has been a rise in gastro-esophageal reflux disease (GORD) and Barrett’s esophagus in healthy young men across developed countries. This rise has contributed to esophageal adenocarcinoma now being the more common subtype throughout Western Europe and North America. Lower esophagus and gastro-esophageal junction cancers are typically adenocarcinoma, and are often associated with GORD, Barrett’s esophagus, high body mass index, and male. Metastasis of both subtypes of cancer typically occurs to the peri-esophageal lymph nodes, liver, and lungs [2, 6-8]. Less than 20% of patients diagnosed with esophageal cancer survive for 5 or more years; clearly, the case mortality rate is high [9]. Thus, based on the current state of onset and treatment of patients with esophageal cancer, the importance of finding relevant tumor markers has become increasingly urgent.
The development of the TCGA database, which adopts high-throughput next generation sequencing technology, provides the opportunity for researchers to better understand the genetics of cancer, thereby improving their ability to prevent, diagnose, and treat the malignancies. The TCGA database includes both standardized clinical information and sufficient samples for most cancers, as well as gene (mRNA) expression, microRNA (miRNA) expression, information on copy number variation, DNA methylation, and single nucleotide polymorphisms. Previous studies have shown that mutations and ectopic expression in individual miRNAs can lead to serious physiological consequences, partially by affecting cell proliferation, death and/or immune function [10]. These effects are mainly due to the regulation of messenger RNA (mRNA) by miRNA. Additionally, various types of miRNAs display different levels of expression in specific types of malignancies. Therefore, it is reasonable to utilize the mRNA and miRNA expression data of esophageal samples in the TCGA database to find novel biomarkers in our study. Evidence indicates that there is a statistical correlation of differential expression of miRNA and mRNA between malignant tumor cells and normal cells. In this study, we identified prognosis-related miRNA and mRNA and constructed miRNA-mRNA interaction networks. These findings may help us better understand the role of miRNA-mRNA interaction in tumors. We utilized a group of tools and databases, including the R language and its associated packages, the STRING protein database, the Cytoscape Network, the miRNA target prediction database miRcode and the Gene Ontology database (GO), to analyze the next generation RNA sequencing data of esophageal samples in TCGA database, and identify highly specific biomarkers and potential therapeutic targets associated with esophageal cancer. We first demonstrated the overall differential expression of miRNA and mRNA in esophageal cancer cells in comparison to the normal cells. We next constructed the protein-protein interaction network and the miRNA-mRNA regulatory network by only including the differentially expressed miRNA and mRNA in esophageal cancer. From the constructed network, we identified five miRNAs (miR-18a, miR-29c, miR-181b, miR-345 and miR-615) and seven pivotal genes (AASS, AKAP6, ARHGAP24, ESM1, FABP3, GK and NFIX) that are statistically correlated to the survival of patients with esophageal cancer. Our findings provide a novel theoretical basis for the prognosis and targeted therapy of esophageal cancer. The detailed regulatory network between miRNA and mRNA, however, remains to be further elucidated.
2. Materials and Methods
2.1 Data resource
Publicly available dataset of esophageal cancer, including samples for clinical phenotype information, miRNA and mRNA expression data was obtained from the TCGA database (https://portal.gdc.cancer.gov/repository). Data analysis and application in this study were performed in accordance with the TCGA publication guidelines and data access policies.
2.2 Differential gene expression
mRNA and miRNA expression data were differentially analyzed using the R package “DESeq2”. Examined genes with a mean value > 0 were included in the screening. P Value < 0.01 and absolute value of log2 fold change ≥ 2.0 were set as the cut-off parameters to screen for differentially expressed genes.
2.3 Survival statistical analysis
Differentially expressed gene candidates were further screened by univariate Cox regression analysis and log-rank test Kaplan-Meier curves, with p Value < 0.05 indicating a significant correlation with survival outcomes. The false discovery rate (FDR) was applied to correct the multiple hypothesis test.
2.4 miRNA - mRNA interaction network construction
miRNA targeted mRNA genes were predicted using the analysis tool miRcode (https:// www.mircode.org). The predicted target mRNAs were intersected with differentially expressed gene set. The differentially expressed, predicted target mRNAs were further screened by Cox and Kaplan - Meier survival analysis to obtain the final gene set that were also significantly related to the survival of esophageal cancer patients.
2.5 Protein interaction network construction
The protein interaction network of differentially expressed protein coding genes was constructed through the Search Tool for the Retrieval of Interacting Genes (STRING, https://string-db.org/) and was displayed through Cytoscape software (version 3.7.2), an opensource platform for visualizing and integrating complex networks with additional feature data.
2.6 Functional enrichment analysis
Differentially expressed mRNA genes were analyzed for functional and pathway enrichment by using the Gene Ontology (GO) and Kyoto Encyclopedia of Genes and Genomes (KEGG) databases. The GO analysis reveals the analyzed genes function in biology process (GO_BP), cellular component (GO_CC) and molecular function (GO_MF). The KEGG analysis shows the pathway enrichment of the same set of differentially expressed genes. Adjusted P value and FDR < 0.05 was considered statistically significant.
3. Results
3.1 Identification of differentially expressed miRNA and mRNA in esophageal cancer
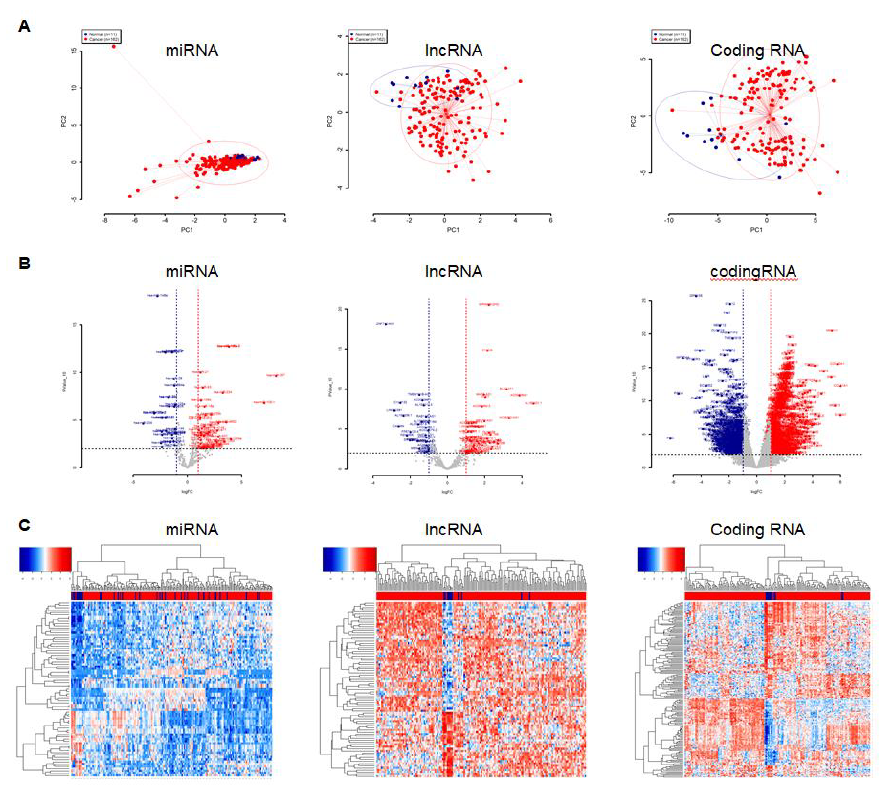
We included all 162 esophageal cancer samples as well as the 11 corresponding normal tissues from the TCGA database. We first performed a principle component analysis (PCA) to compare the gene expression of tumor cells to normal cells. The overall miRNA expression in esophageal cancer cells were indistinguishable from normal cells, but the expression variation was larger in tumor cells (Figure 1A left panel). For the identified mRNAs, we only selected the long-noncoding RNA (lncRNA) and protein coding RNA for further analysis. The overall expression of lncRNA and protein coding RNA in tumor cells were markedly different from normal cells, as they were spatially separated in PCA plots (Figure 1A middle and right panels). We next performed the differential analysis using the R package DESeq2 and set the filtering thresholds (pValue <= 0.01 and the absolute fold changes >= 2) to identify the differentially expressed miRNAs and mRNAs. A total of 77 and 1692 differentially expressed miRNAs and mRNAs were discovered, respectively. For miRNA, 46 miRNAs were upregulated and 31 were downregulated (Figure 1B and 1C left panels). Among a total of 83 lncRNAs, 53 were increasingly expressed and 30 were decreasingly expressed (Figures 1B and 1C middle panels). For a total of 1560 protein coding RNAs, 896 were upregulated and 664 were downregulated (Figures 1B and 1C right panels).
3.2 Protein functional analysis and protein interaction networking
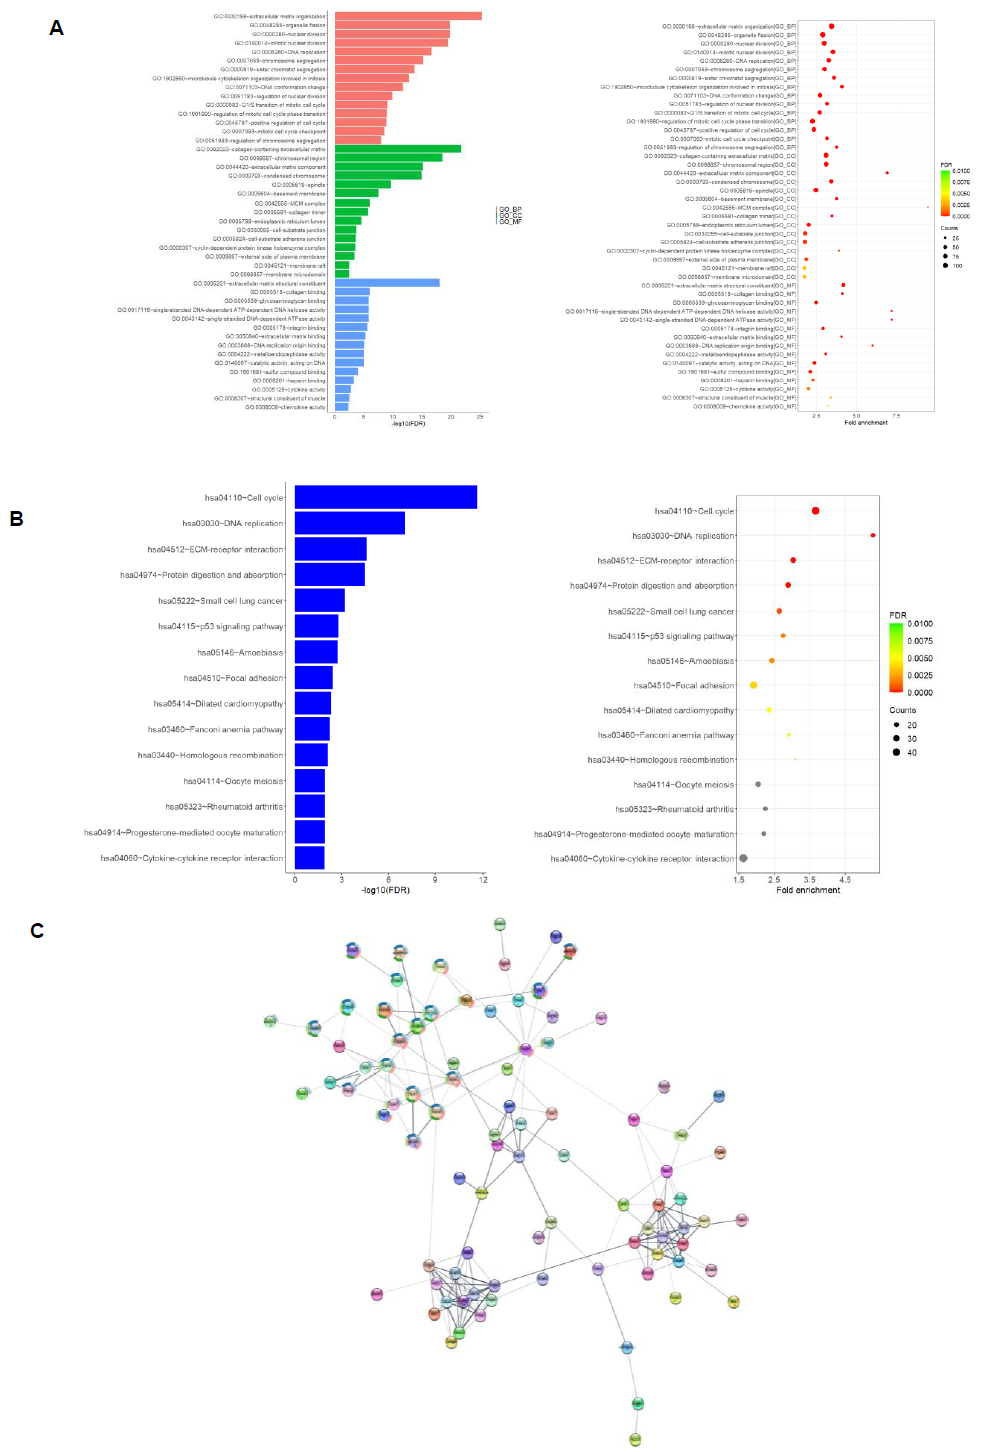
We found, through performing GO and KEGG functional enrichment analyses on the differentially expressed protein coding genes, significant enrichment in various functional characteristics. The result of the GO analysis revealed an enrichment of genes functioning in cell cycle regulation and extracellular matrix formation across all three sub-levels: biological process (GO_BP), cellular component (GO_CC), and molecular function (GO_MF) (Figure 2A). Similar enrichment was seen in the DNA replication, cell cycle, and extracellular matrix regulation of the KEGG functional enrichment analysis. Additionally, that analysis revealed enrichment in several cancer pathways, such as small cell lung cancer, p53 signaling and Fanconi anemia pathway (Figure 2B). We also constructed the differentially expressed protein interaction network through the usage of the STRING-db online database and visualized the results using Cytoscape software. The protein interaction network contains nodes representing the differentially expressed proteins and edges representing the interactions between these proteins (Figure 2C).
3.3 Identification of survival correlated and differentially expressed miRNA and mRNA in esophageal cancer
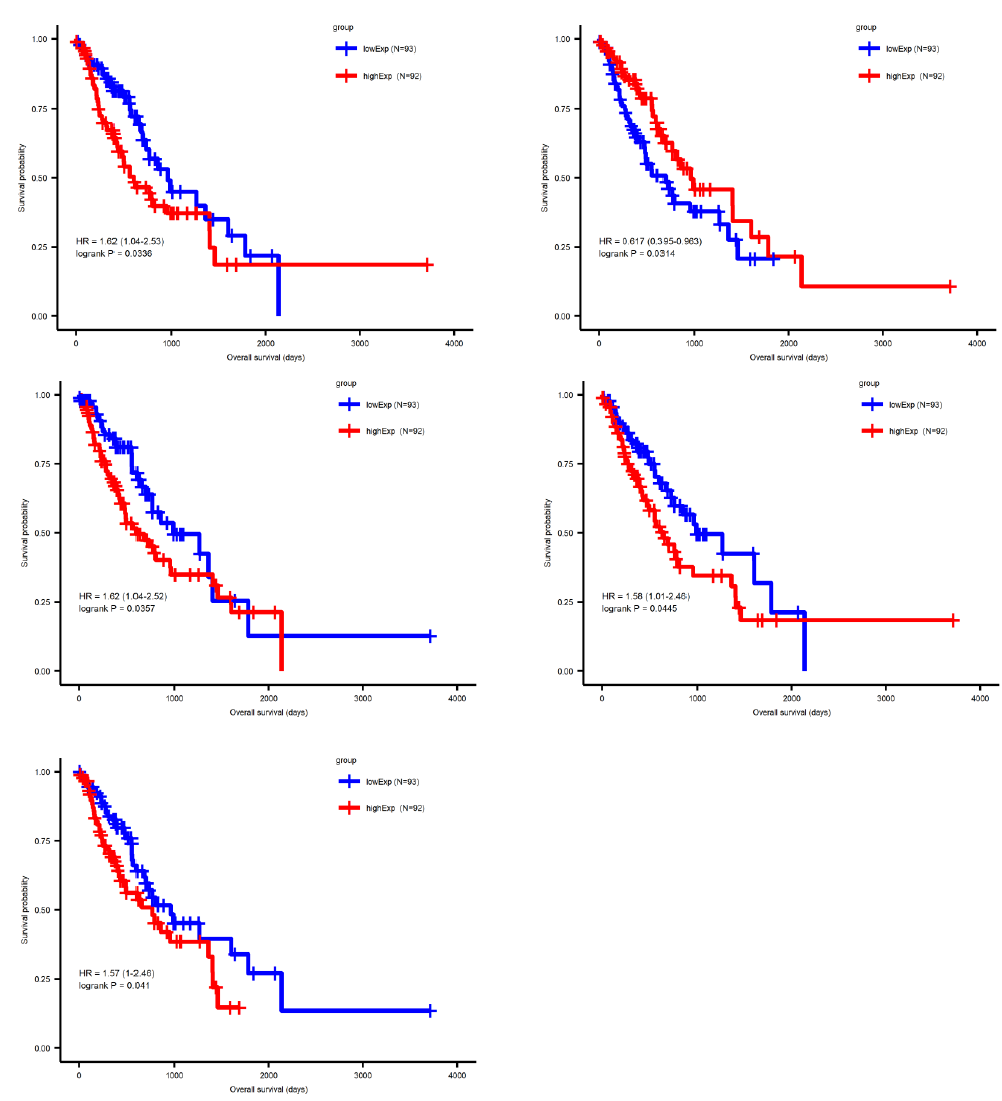
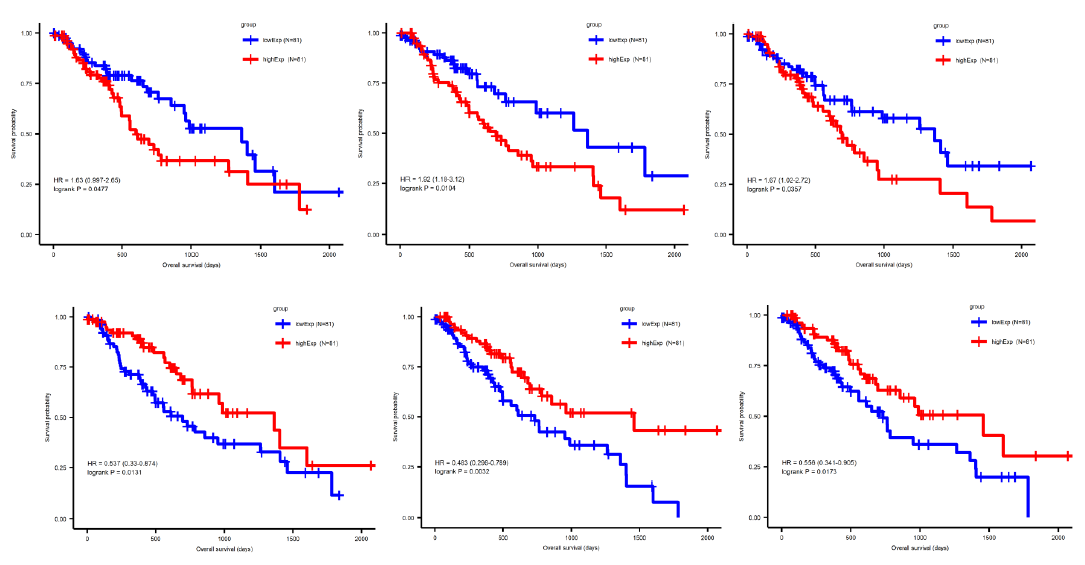
Sufficient evidence indicated that miRNA plays a central role in regulating tumor progression. To further distinguish the survival-correlated miRNAs from the differentially expressed miRNA candidates, we performed a Cox regression analysis and used a log-ranked Kaplan-Meier curve. Five out of 77 miRNAs were identified to be statistically significant in the survival status (pValue<0.05) of esophageal cancer patients (Figure 3), comprising four upregulated miRNAs (miR-18a, miR-181b, miR-345 and miR-615) and one downregulated miRNAs (miR-29c). Similarly, a total of 86 out of 1692 mRNAs were identified to be significantly correlated to survival. In order to narrow down the five candidate miRNAs and 86 mRNA genes, we intersected the differentially expressed miRNA or mRNA with the survival-correlated miRNA or mRNA candidates.
3.4 Prediction of miRNA target genes and constructing the miRNA-mRNA interaction network
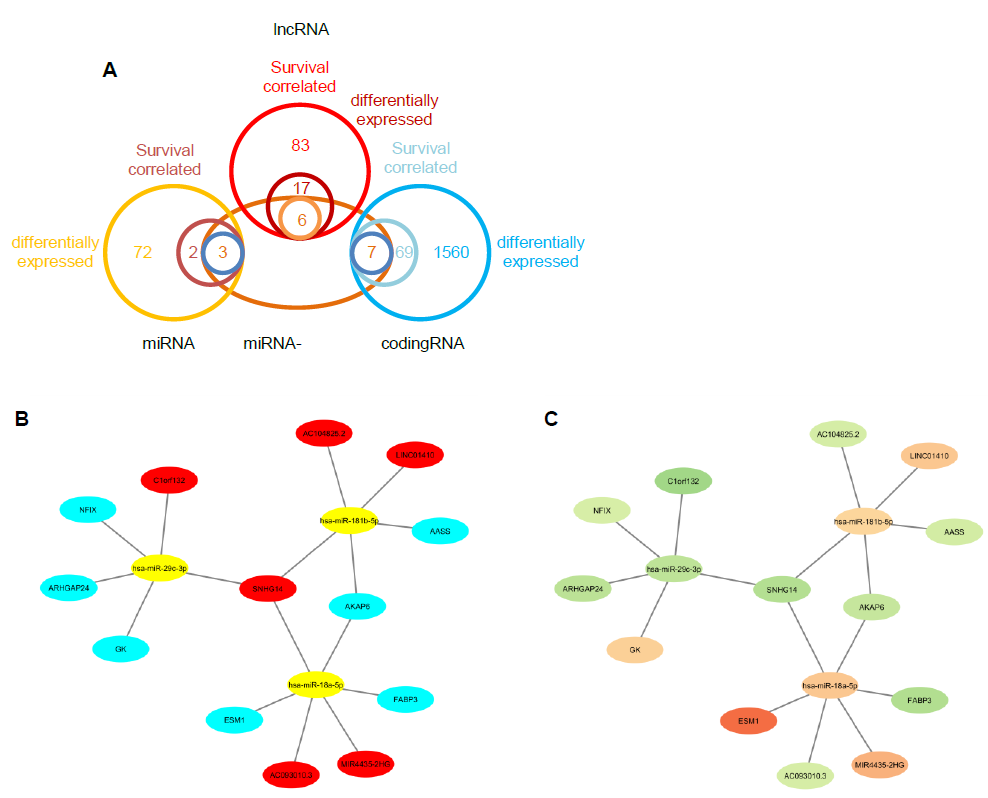
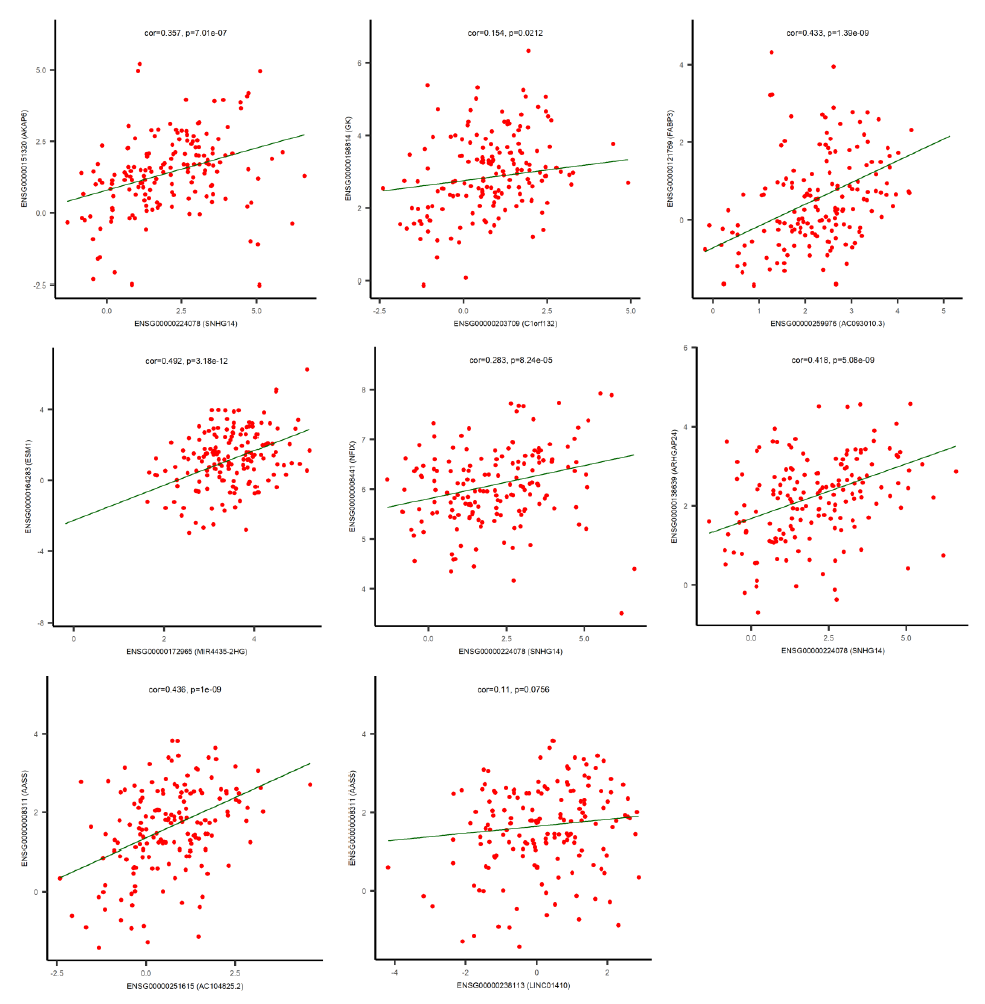
By using the miRNA target gene prediction database miRcode, we were able to identify theoretical potential target lncRNA and protein coding genes within the 86 survival-correlated and differentially expressed mRNA genes. We started with the five survival-correlated and differentially expressed miRNAs, then identified a total of 29 mRNA target genes that were predicted to be the targets of the selected miRNAs (Figure 4A). We finally obtained a total of three miRNAs (mR-18a, miR-29c and miR-181b), six lncRNAs (AC093010, AC104825.2, C1orf132, LINC01410, MIR4435-2HG and SNHG14), and seven protein coding RNAs (AASS, AKAP6, ARHGAP24, ESM1, FABP3, GK and NFIX) after additionally filtering by the log-ranked Kaplan Meier method. This process helped us to construct the miRNA-mRNA interaction network (Figures 4B and 4C). For miRNAs, the 5-year survival rate of esophageal cancer patients significantly increased when the expression of miR-29c was elevated and while the expression of miR-18a and miR-181b were decreased (Figure 3). For protein coding RNAs, the 5-year survival rate of the patients with esophageal cancer significantly increased when the expression levels of AASS, AKAP6, ARHGAP24 and NFIX were above the 50% median value and while ESM1, GK and FABP3 were below the 50% median value (Figure 5). According to the sponge theory, miRNA plays pivotal roles in regulating mRNA level, partly through its ability to simultaneously bind to certain lncRNA and protein coding RNA. In turn, lncRNA is capable of sequestering excess amounts of miRNA and releasing sufficient amounts of protein coding RNA for protein translation. There are five strong positive correlations (cor>0.35) pairs between the lncRNA – protein coding RNA, both of which are targets of selected miRNA (Figures 4A and 4B): AC104825 - AASS, SNHG14 - AKAP6, AC093010 - FABP3, MIR4435-2HG - ESM1 and SNHG14 - ARHGAP24 (Figure 6). While there are correlations between C1orf132 - GK, SNHG14 - NFIX and LINC01410 – AASS, they are relatively weak and therefore not as significant. Thus, the correlation pairs between lncRNA and protein coding RNA further support the predicted miRNA targets and the regulation network constructed in Figures 4B and 4C.
3.5 Protein interaction network of the crucial protein coding genes
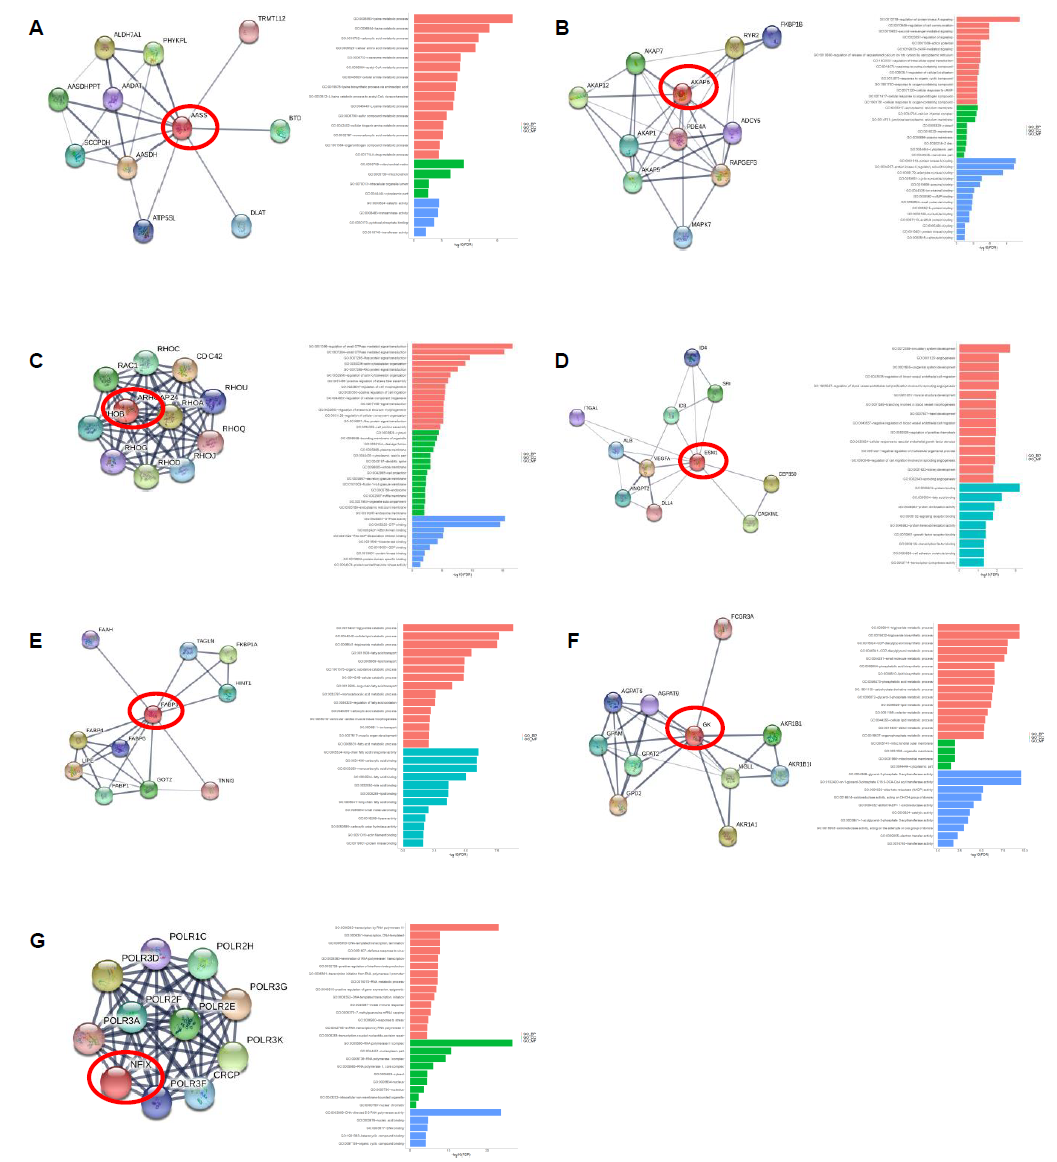
We performed protein interaction networking and GO analysis on each of these seven genes: AASS, AKAP6, ARHGAP24, ESM1, FABP3, GK and NFIX to better understand the possible mechanism of the above crucial protein coding genes. The AASS gene encodes a bifunctional enzyme that catalyzes the first two steps in the mammalian lysine degradation pathway (Figure 7), though it was mainly involved in lysine metabolic pathway. The AKAP6 gene binds to the regulatory subunit of cAMP-dependent protein kinase A (PKA) and anchors PKA to the nuclear membrane or sarcoplasmic reticulum, which is enriched in cell signaling pathway. ARHGAP24 gene is a Rho-GTPase activating protein, which predominantly interacted with proteins of G-protein-coupled receptor (GPCR) signal transduction pathway. ESM1 gene encodes a secreted protein which is mainly expressed in the endothelial cells in human lung. It was found to be enriched in angiogenesis pathway and gastric cancer network. FABP3 gene encodes fatty acid-binding protein 3 and its function is to arrest the growth of epithelial cells. Additionally, it is a tumor suppressor gene for breast cancer. It was predominantly involved in fatty acid, glucose and energy metabolic pathways. GK is an enzyme in the regulation of glycerol uptake and metabolism. It was found in glycerolipid and energy metabolic pathway. NFIX is capable of activating gene transcription, as it was enriched in transcriptional regulation pathways. Evidently, these genes and their associated pathways indicate that they are actively involved in several key cancer-related regulatory network.
Figure 1: The miRNA and mRNA expression dataset from TCGA esophageal cancer samples. A, PCA plots of overall miRNA (left), long non-coding mRNA (middle) and protein coding mRNA (right). The blue dots represent normal samples and the red dots represent tumor samples. B, Volcano plots of differentially expressed miRNA (left), long non-coding mRNA (middle) and protein coding mRNA (right). The red dots represent upregulated genes in tumor; the blue dots represent downregulated genes in tumor; the gray dots represent either insignificantly differentially expressed genes or genes that were not satisfied with the thresh cutoff parameter. C, Heatmap plots of differentially expressed miRNA (left), long non-coding mRNA (middle) and protein coding mRNA (right). The red color represents upregulated genes and blue color represents downregulated genes. The rows represent genes and the columns represent samples. The blue color in columns represent normal samples and the red color in columns represent tumor samples.
Figure 4: miRNA and mRNA interaction network construction. A, Venn diagram to display the miRNA and mRNA gene screening. B and C, the miRNA mRNA interaction network composed of the selected three miRNAs, six long non-coding mRNAs and seven protein coding mRNAs. In Figure B, red color represents long non-coding mRNAs; yellow color represents miRNAs; cyan color represents protein coding mRNAs. In Figure C, brown color represents upregulated genes and green color represents downregulated genes.
4. Discussion
The overall prognosis in esophageal cancer is poor, primarily due to the late presentation of symptoms and the aggressiveness of this tumor. As a result, many patients present with distant disease or a primary tumor with overgrowth to adjacent organs, making a cure nearly impossible for them [11]. Additionally, survival for patients with primary tumor size ≥T2, or tumor migrated to adjacent more than one lymph nodes is unexpectedly poor after the surgery. There are fewer data on patient prognoses from different countries, but patients with esophageal cancer have poor prognoses in most parts of the world, as indicated by similar global rates of incidence and mortality [12]. Previous studies revealed that there are a handful of genetic variations associated with esophageal cancer [13-26], and suggest that changes in gene regulation need to be explored. Thus, analyzing the tumor-related data in TCGA database to obtain the miRNA-mRNA regulatory network and predict novel tumor biomarkers could generate new findings for the diagnosis and treatment of esophageal cancer. We discovered five miRNAs that are significant in terms of sur ival status of esophageal cancer patients, including four upregulated miRNAs (miR-18a, miR-181b, miR-345 and miR-615) and one downregulated miRNAs (miR-29c), through univariate Cox regression analysis and Kaplan-Meier survival analysis. Several of these miRNAs have been previously associated with the molecular mechanisms of tumors. For example, miR-18a is associated with thyroid gland anaplastic carcinoma and medulloblastoma, miR-29c is associated with rhabdomyosarcomas, the soft tissue sarcomas that are one of the most common neoplasms in children and adolescents, and miR-181b is associated with hepatocellular carcinoma and pancreatic cancer. Although there are few reports of a role for these miRNAs in esophageal cancer, our study revealed evidence that they regulate pivotal target genes to affect tumorigenesis. We constructed the esophageal specific miRNA-mRNA interaction network using the miRNA target database combed with mRNA differential gene expression analysis. Within the network we identified seven pivotal protein coding genes (AASS, AKAP6, ARHGAP24, ESM1, FABP3, GK and NFIX) that are statistically correlated to the survival of patients with esophageal cancer. Even though the crucial function of these genes in esophageal cancer requires further investigation, they can serve as molecular biomarkers to indicate esophageal prognosis, as well as the potential therapeutic targets to improve the overall survival of esophageal patients.
References
- Bray F, Ferlay J, Soerjomataram I, Siegel RL, Torre LA, Jemal A. Global cancer statistics 2018: GLOBOCAN estimates of incidence and mortality worldwide for 36 cancers in 185 countries. CA Cancer J Clin 68 (2018): 394-424.
- Demeester SR. Epidemiology and biology of esophageal cancer. Gastrointest Cancer Res 3 (2009): S2-S5.
- Chin Hur, Melecia Miller, Chung Yin Kong, Emily C Dowling, Kevin J Nattinger, Michelle Dunn, et al. Trends in esophageal adenocarcinoma incidence and mortality. Cancer 119 (2013): 1149-1158.
- Cancer Research UK. Oesophageal cancer statistics. Cancer Research UK (2017).
- Short MW, Burgers KG, Fry VT. Esophageal cancer. Am Fam Physician 95 (2017): 22-28.
- Botterweck AA, Schouten LJ, Volovics A, Dorant E, van Den Brandt PA. Trends in incidence of adenocarcinoma of the oesophagus and gastric cardia in ten European countries. Int J Epidemiol 29 (2000): 645-654.
- Holmes RS, Vaughan TL. Epidemiology and pathogenesis of esophageal cancer. SeminRadiat Oncol 17 (2007): 2-9.
- Brown LM, Devesa SS, Chow WH. Incidence of adenocarcinoma of the esophagus among white Americans by sex, stage, and age. J Natl Cancer Inst 100 (2008): 1184-1187.
- Siegel R, Ma J, Zou Z, Jemal A. Cancer statistics, 2014. CA Cancer J. Clin 64 (2014): 9-29
- Xiao C, Rajewsky K. MicroRNA control in the immune system: basic principles. Cell 136 (2009): 26-36.
- Lagergren J, Smyth E, Cunninham G, Lagergren P. Oesophageal cancer. Lancet 390 (2017): 2383-2396.
- Christina Fitzmaurice, Daniel Dicker, Amanda Pain, Hannah Hamavid, Maziar Moradi-Lakeh, Michael F MacIntyre, et al. The Global burden of cancer 2013. JAMA Oncol 1 (2015): 505-527.
- Xi Liu, Min Zhang, Songmin Ying, Chong Zhang, Runhua Lin, Jiaxuan Zheng, et al. Genetic alterations in esophageal tissues from squamous dysplasia to carcinoma. Gastroenterology 153 (2017): 166-177.
- Fagundes R B, Melo C R, Putten A C, Moreira L F, de Barros S G. p53 immunoexpression: an aid to conventional methods in the screening of precursor lesions of squamous esophageal cancer in patients at high-risk?. Cancer Detect. Prev 29 (2005): 227-232.
- Müller Leandro B, Meurer Luise, Lopes Antônio Barros, Antunes Luis CM, Vanazzi Sara, Fagundes Renato B. Stepwise expression of CDKN2A and RB1 proteins in esophageal mucosa from patients at high risk for squamous cell carcinoma. Appl. Immunohistochem. Mol. Morphol 22 (2014): 669-673.
- George Couch, James E Redman, Lorenz Wernisch, Richard Newton, Shalini Malhotra, Sanford M Dawsey, et al. The discovery and validation of biomarkers for the diagnosis of esophageal squamous dysplasia and squamous cell carcinoma. Cancer Prev. Res (Phila.) 9 (2016): 558-566.
- Yongmei Song, Lin Li, Yunwei Ou, Zhibo Gao, Enmin Li, Xiangchun Li, et al. Identification of genomic alterations in oesophageal squamous cell cancer. Nature 509 (2014): 91-95.
- Yi-Bo Gao, Zhao-Li Chen, Jia-Gen Li, Xue-Da Hu, Xue-Jiao Shi, Zeng-Miao Sun, et al. Genetic landscape of esophageal squamous cell carcinoma. Nat. Genet 46 (2014): 1097-1102
- De-Chen Lin, Jia-Jie Hao, Yasunobu Nagata, Liang Xu, Li Shang, Xuan Meng, et al. Genomic and molecular characterization of esophageal squamous cell carcinoma. Nat. Genet 46 (2014): 467-473
- Romy E Verbeek, Lisanne F Spittuler, Anique Peute, Martijn G H van Oijen, Fiebo J ten Kate, Jacob R Vermeijden, et al. Familial clustering of Barrett’s esophagus and esophageal adenocarcinoma in a European cohort. Clin. Gastroenterol. Hepatol 12 (2014): 1656.e1-1663.e1
- Amitabh Chak, Heather Ochs-Balcom, Gary Falk, William M Grady, Margaret Kinnard, Joseph E Willis, et al. Familiality in Barrett’s esophagus, adenocarcinoma of the esophagus, and adenocarcinoma of the gastroesophageal junction. Cancer Epidemiol. Biomarkers Prev 15 (2006): 1668-1673
- Vaughan TL, Fitzgerald RC. Precision prevention of oesophageal adenocarcinoma. Nat. Rev. Gastroenterol. Hepatol 12 (2015): 243-248.
- Zhan Su, Laura J Gay, Amy Strange, Claire Palles, Gavin Band, David C Whiteman, et al. Common variants at the MHC locus and at chromosome 16q24.1 predispose to Barrett’s esophagus. Nat. Genet 44 (2012): 1131-1136.
- Puya Gharahkhani, Rebecca C Fitzgerald, Thomas L Vaughan, Claire Palles, Ines Gockel, Ian Tomlinson, et al. Genome-wide association studies in oesophageal adenocarcinoma and Barrett’s oesophagus: a large-scale meta-analysis. Lancet Oncol 17 (2016): 1363-1373.
- Matthew F Buas, Qianchuan He, Lisa G Johnson, Lynn Onstad, David M Levine, Aaron P Thrift, et al. Germline variation in inflammationrelated pathways and risk of Barrett’s oesophagus and oesophageal adenocarcinoma. Gut (2016).
- James Y Dai, Jean de Dieu Tapsoba, Matthew F Buas, Lynn E Onstad, David M Levine, Harvey A Risch, et al. A newly identified susceptibility locus near FOXP1 modifies the association of gastroesophageal reflux with Barrett’s esophagus. Cancer Epidemiol. Biomarkers Prev 24 (2015): 1739-1747.

